Japanese Candlestick charting dramatically increases the information conveyed to the visual analysis. Each candlestick trading formation or series of formations can clearly illustrate the change of investor sentiment. This process is not apparent in standard bar chart interpretation. Each candle formation has a unique name. Some have Japanese names, others have English names.
Single candles are often referred to as YIN and YANG lines. These terms are actually Chinese, but are used by Western analysts to account for opposites; in/out, up/down, and over/under. INN and YOH are the Japanese equivalents. YIN is bearish. YANG is bullish. There are nine basic YIN and YANG lines in Candlestick analysis. These are expanded to fifteen to cover all possibilities clearly. The combination of most patterns can be reduced to one of these candlestick patterns.
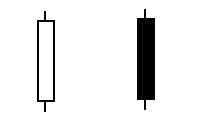
Long days
A long day represents a large price move from open to close when candlestick charting. Long represents the length of the candle body. What qualifies a candle body to be considered long? That is a question that has to be answered relative to the chart being analyzed. The recent price action of a stock will determine whether a “long” candle has been formed. Analysis of the previous two or three weeks of trading should be a current representative sample of the price action.
Short Days
Short days can be interpreted by the same analytical process of the long candles on candlestick charts. There are a large percentage of the trading days that do not fall into either of these two categories.
Maruboza
In Japanese chart analysis, Marubozu means close cropped or close-cut. Bald or Shaven Head are more commonly used in candlestick analysis. It’s meaning reflects the fact that there are no shadows extending from either end of the body.
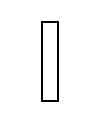
White Maruboza
The White Marubozu is a long white body with no shadows on either end. This is an extremely strong pattern used in stock analysis. Consider how it is formed. It opens on the low and immediately heads up. It continues upward until it closes, on its high. Counter to the Black Marubozu, it is often the first part of a bullish continuation pattern or bearish reversal pattern. It is called a Major Yang or Marubozu of Yang.

Black Marubozu
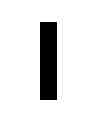
A long black body with no shadows at either end used in Japanese Candlesticks is known as a Black Marubozu. It is considered a weak indicator. It is often identified in a bearish continuation or bullish reversal pattern, especially if it occurs during a downtrend. A long black candle could represent the final sell off, making it an “alert” to a bullish reversal setting up. The Japanese often call it the Major Yin or Marubozu of Yin.
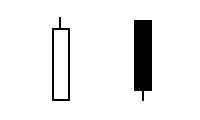
Closing Marubozu
A Closing Marubozu has no shadow at it’s closing end. A white body will not have a shadow at the top. A black body will not have a shadow at the bottom. In both cases, these are strong signals corresponding to the direction that they each represent.
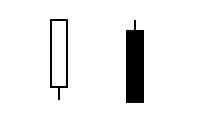
Opening Marubozu
The Opening Marubozu has no shadows extending from the open price end of the body. A white body would not have a shadow at the bottom end , the black candle would not have a shadow at it’s top end. Though these are strong signals, they are not as strong as the Closing Marubozu.
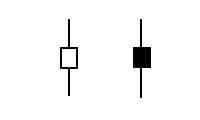
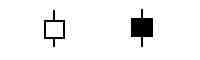
Spinning Top
Spinning Tops are depicted with small bodies relative to the shadows. This demonstrates some indecision on the part of the bulls and the bears. They are considered neutral when trading in a sideways market. However, in a trending or oscillating market, a relatively good rule of thumb is that the next days trading will probably move in the direction of the opening price. The size of the shadow is not as important as the size of the body for forming a Spinning Top.
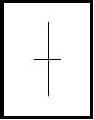
Doji
The Doji is one of the most important signals in candlestick analysis. It is formed when the open and the close are the same or very near the same. The lengths of the shadows can vary. The longer the shadows are, the more significance the Doji becomes. More will be explained about the Doji in the next few pages. ALWAYS pay attention to the Doji.
The dimension of knowing what the formations signify magnifies the potential for profits. The bodies, unlike the bars of bar charts, reveal an immense amount of information.
On to Candlestick Research Go To Products on Trading Candlestick Patterns
Speak Your Mind