There is no shortage of stock market information, whether you are researching the internet or the book stores. Be prepared to be flooded with material covering stock market information. The biggest decision is how to go about selecting which materials to start reading. Do you want to learn about day-trading? Are you more interested in learning options, or trading commodities? Maybe you want to be better educated to discuss your portfolio with your Broker. How do you know if the stock market information you are reviewing was written by someone qualified in the subject? Perhaps you will allow us to narrow the field a bit. Stephen Bigalow is not only the author of ‘High Profit Candlestick Patterns’, and ‘Profitable Candlestick Trading’, but He Trades For A Living! The same information he teaches throughout this website, and in all his training products, is the same information he uses every day to make his own trading decisions. He contributes new articles each week to aid other investors on the advantage of combining candlestick signals and how to read candlestick charts. We hope you enjoy the following training information for the Shooting Star Signal. For additional articles on trading individual candlestick signals please begin with Candlestick Images and Explanations.
The Shooting Star
Description
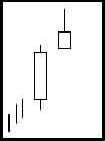
The Shooting Star is comprised of one candle. It is easily identified by the presence of a small body with a shadow at least two times greater than the body. It is found at the top of an uptrend. The Japanese named this pattern because it looks like a shooting star falling from the sky with the tail trailing it.
Criteria
- The upper shadow should be at least two times the length of the body.
- The real body is at the lower end of the trading range. The color of the body is not important although a black body should have slightly more bearish implications.
- There should be no lower shadow or a very small lower shadow.
- The following day needs to confirm the Shooting Star signal with a black candle or better yet, a gap down with a lower close.
Signal Enhancements
- The longer the upper shadow, the higher the potential of a reversal occurring.
- A gap up from the previous day’s close sets up for a stronger reversal move provided.
- The day after the Shooting Star signal opens lower.
- Large volume on the Shooting Star day increases the chances that a blow-off day has occurred although it is not a necessity.
Pattern Psychology
After a strong up-trend has been in effect, the atmosphere is bullish. The price opens and trades higher. The bulls are in control. But before the end of the day, the bears step in and take the price back down to the lower end of the trading range, creating a small body for the day. This could indicate that the bulls still have control if analyzing a Western bar chart. However, the long upper shadow represents that sellers had started stepping in at these levels. Even though the bulls may have been able to keep the price positive by the end of the day, the evidence of the selling was apparent. A lower open or a black candle the next day reinforces the fact that selling is going on.
Speak Your Mind