Archives for August 2019

Basics of Commodity Trading

To trade commodities successfully traders ought to start by learning the basics of commodity trading. Trading commodities is really commodities futures trading. Producers and processors of commodities buy and sell futures contracts for delivery on a specific date during any of the next months or years. Producers and processors are typically hedging their investment risk and helping to provide a stable market for the commodity in question. Speculators can trade the same commodity futures contracts by buying and selling futures or they can buy options and sell options on futures contracts. Commodity and futures training is a good place to start learning the basics of commodity trading. For those interested options trading in commodities marketsOptions Training with Stephen Bigalow will provide basic knowledge as well as the deeper insight gained from experience trading options in commodity futures.

Commodity futures as an asset class differ from stocks or long term bonds. A standard futures contract for corn futures, oil futures, or gold futures is a claim or a promise relating to a standardized quantity of a tangible asset. The claim for delivery or promise to deliver is on the contract expiration date. As a matter of fact, traders seldom hold a contract through to expiration but rather execute the opposite trade on the same commodity and expiration date in order to exit the trade. Because a futures contract has an expiration date it is not a claim upon the assets of a corporation. Supply and demand often cause pronounced commodity price shifts. Agricultural commodities are especially prone to large fluctuations in price as variation in weather conditions and amounts of crops planted or cattle culled from herds affect supply. The basics of commodity trading are that a trader in commodities is not concerned with competence of management, a margin of safety, or diversifying a stock portfolio into various market sectors. He or she is concerned with drought in Argentina or Russia, the opening of markets in Asia, or, in the case of gold, the seemingly continual devaluation of the US dollar.

The basics of commodity trading are that some commodities can be stored, like gold, oil, and corn. Some commodities, such as milk, have a short shelf life. Knowing the basics of commodity trading for a given set of commodities is essential for trading them. Traders should know that the decisions of large producers and buyers of commodities typically drive the markets in various commodities. Therefore, not all fluctuation in commodity prices is based upon the fundamentals of production and demand. It is also based on anticipation of market factors by large buyers and sellers. Thus, successful commodities trading requires the ability to anticipate the actions of other traders, the commodities market. Using technical analysis tools such as Candlestick chart patterns helps the trader see where the market is going. This is because trading patterns in commodity prices tend to repeat themselves. Knowing the basic Candlestick analysis patterns helps the smart trader with useful knowledge to successfully trade and profit from trading commodities.


Market Direction

What is the most important indicator when analyzing candlesticks signals? There are numerous confirming indicators that improve the effectiveness of candlestick signals. Stochastics play an important role for adding credence to the candlestick signals. Major moving averages demonstrate good support or resistance potentials. The T-line demonstrates whether a trend is going to continue or possibly reverse. However, the most important aspect when using candlestick analysis is the signals themselves.

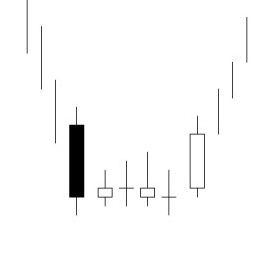
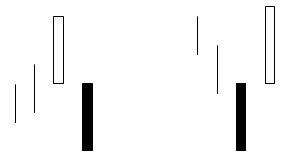
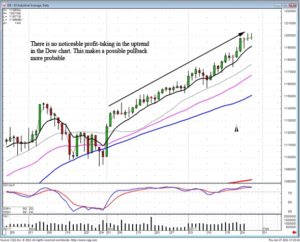
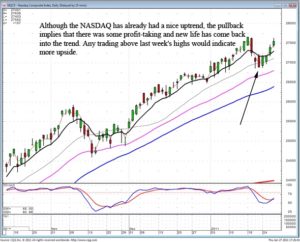
This was clearly demonstrated today in both the Dow and the NASDAQ. Yesterday both indexes closed just at the T-line. However, each had formed an indecisive Spinning Top formation. Both the Dow and the NASDAQ had stochastics showing oversold conditions. This would have suggested there was going to be more upside movement. The accuracy of trend analysis is greatly enhanced by knowing what each individual signal represents. Also, there are a few basic rules that can be applied to each signal.
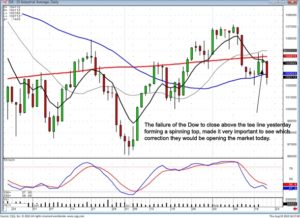
Commodities Dow

DOW

Although the stochastics were in the oversold condition, starting to curl up, knowing what should occur after specific signals made today’s trading relatively simple. The trend/price is going to move in the direction of how prices open after a Doji/spinning top. When the premarket futures were slightly soggy and the markets immediately started selling off, this produced immediate information. The Bulls were not yet able to take the market up through the T-line. How was this information useful?

A weaker open after a Spinning Top, right at the T-line, would have made any buying of long positions today not be executed until prices showed bullish strength. The weak open provided the prospect that the tee line was still acting as resistance. The uptrend had to be confirmed with a candlestick buy signal, which both indexes demonstrated a few days ago, and a close above the T-line. The weaker open today should have delayed any long position buying and instigated closing any long positions that were showing weakness or also not able to break through the T-line.

This is not sophisticated trend analysis. The visual aspects of candlestick signals and the simple rules that are associated with them provide a common sense trading format. There are many if/then trading rules that illustrate what reoccurring investor sentiment is doing. Those thought processes are very consistent.
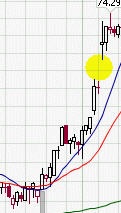
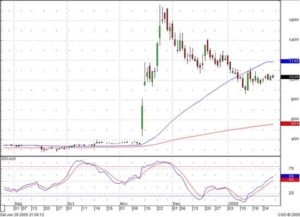
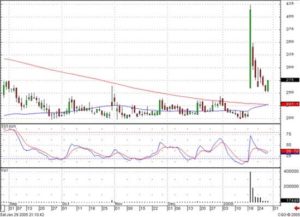
The effectiveness of reoccurring patterns provides huge profit potential in all trading entities. As illustrated in the October Live Cattle chart, the uptrend contained a number of pullbacks. Each time the price pulled back, it could be observed  the formations each day showed indecisive selling. This is a common indication the uptrend is just resting.
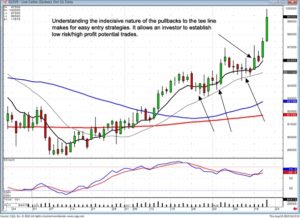
Commodities December Live Cattle

Dec Live Cattle

Obviously, knowing when  high probability buy setups occur, profits for the account can build up extremely fast. Having the ability to accurately analyze which direction the daily price chart will move allows for very profitable intraday trading. Knowing the daily bias is up, a trader can take advantage of the profit-taking during the day and buy back when the intraday buy signals occur. Once again, this is not sophisticated analysis. This is merely understanding the common sense information built into candlestick signals.

Chat session tonight at 8 PM ET — Everybody is welcome. Tonight we will discuss how to fine tune your trend analysis capabilities.

Good Investing,
The Candlestick Forum Team

Cradle Pattern

Cradle Pattern Illustration

Candlestick Cradle Pattern

Cradle Pattern

The Cradle Pattern is a variation of the series of Doji at the bottom. It is aptly named, in that it looks like a ‘cradle’. This makes the Cradle Pattern an easily identified reversal pattern. It begins with the same visual alert found in most candlestick bottoming signals; a large Bearish candle at the bottom of a downtrend. This illustrates the extensive selling at the bottom. The following day shows a candlestick signal such as a Doji, Spinning Top, Harami, Hammer, or Inverted Hammer, indicating that the selling had stopped. Now the candlestick investor should be watching for a Confirmation ‘Buy’ Candlestick Signal. Keep in mind, the small indecisive trading signals may occur for a number of days before the ‘buy’ signal appears.

The Cradle Pattern reveals investor sentiment. If the large dark candle is considered the headboard, the Bullish candle becomes the foot board. The Cradle Pattern formation is now hanging at the bottom, implying that the trend should move up from this level.


The Cradle Pattern was first introduced by Stephen Bigalow in his second book titled

High Profit Candlestick Patterns; Turning Investor Sentiment into High Profits

This Cradle Pattern is also part of our Flash Card Set 2 – High Profit Candlestick Patterns

The clear graphics makes learning these high profit patterns an easy process. Each pattern is fully explained on the backside of the card. The description of how and why the pattern is forming makes understanding the potential of the pattern easy to comprehend.  Having this valuable knowledge at your fingertips allows an investor to extract large profits from the markets.

HIGH PROFIT CANDLESTICK PATTERNS

Cradle Pattern
Dumpling Top
Fry Pan Bottom
Jay-Hook Pattern
Scoop Pattern
Trading Channels
Gap Down Hammer at the Bottom
Gap Up Inverted Hammer
Gap Down After a Doji at the Top
Gap Down Doji at the Bottom
Gap Down Bullish Engulfing
Gap Down Bearish Harami
Gap Down Shooting Star
Gap Down Hanging Man
Tweezers Bottom
Tweezers Top
Multiple Tails to the Downside
Series of Shadows at the Top
Series of Doji at the Top
Series of Doji at the Bottom
Doji End of Flat Trading Range Top
Doji End of Flat Trading Range Bottom
Combination Bullish Signals at the Bottom
Combination Sell Signals at the Top
Double Bullish Engulfing Pattern
Double Bearish Engulfing Pattern
Double Bottom
Double Top
Breakout Through Moving Averages
Moving Averages Act as Price Magnets
Moving Average as Support
Moving Average as Resistance

For the Candlestick Forum Original Flash Cards, with the Major Signals, please click here.

Gap Analysis with Candlestick Signals

Gap Analysis – Big profits with candlestick signals

The correct gap analysis for price movements can produce extremely large profits. One of the major advantages of candlestick signals is that it allows in investor to interpret the investor sentiment after a gap up in price. Being able to recognize strong buy patterns through gap analysis produces a very powerful trading format. Gap analysis includes gaps up in price after a major candlestick signal as well as evaluating a breakout candle. Being able to utilize the information conveyed from the candlestick formations allows an investor to exploit entry positions with maximum benefits.  Candlestick charts reveal these opportunities.

Candlestick signals provide two major functions for extracting profits from trading markets. The most common use is having the ability to identify trend reversals. Reversals can be witnessed in index trends, sector trends, and individual stock prices. They can also be used for analyzing other markets or trading entities that can affect the trading markets an investor is directly participating in.

Another highly profitable function of candlestick signals is using gap analysis for strong trend reversal situations or breakout situations. The analysis of a gap is very simple. It is a graphic illustration of the investors wanting to get in or out of a trading entity with such enthusiasm that it gaps the price away from the previous trading range of the prior time frame/day. In the case of a gap up from a candlestick signal at the bottom of a trend, the buying enthusiasm is apparent. This is the exact type of trend in which an investor wants to participate. A price in an oversold condition, demonstrating a candlestick reversal, followed by massive buying. Does a candlestick buy signal in an oversold condition, followed by a bullish candle illustrate a high probability reversal situation? Certainly! But what would be better? Witnessing a candlestick buy signal in an oversold condition followed by extremely strong buying, a gap up in price. Extremely large profits can be made in a portfolio when successfully utilizing gap analysis.

Breakouts

Breakouts illustrate a very strong change of investor sentiment towards a trading entity/stock. A specific announcement or a world event can create a dramatic change for a company’s future. Unless an investor has the time or the immediate accessibility to a very large research staff, most investors will shy away from a price move that may be up 20%, 50%, 100%, or greater. However, utilizing candlestick signals, an investor can successfully evaluate whether to, and when to, get into a stock position after the price has broken out. The information incorporated into candlestick signals makes the analysis of when to get in to a large price move very easy.

Breakouts for specific stocks are usually induced by an announcement directly related to the company’s future. The announcement usually pertains to things such as breakthroughs in technology or huge contract situations that should affect the cash flow of the company for a long time to come. The study of breakouts can be put into very simple steps. How does the announcement affect the future of the company? What did the candle formation on the day of the announcement indicate as far as investor sentiment? Will the results of the announcement be a short-term or long-term benefit to the company? All these questions can be very easily answered. The first function of the candlestick signals is to illustrate what investor sentiment conveyed at the end of that first day.

Combining Candlestick Signals and Gaps – Technical Analysis Chart Formations

Technical analysis chart formations provide high profit return potential when using Candlestick signals. Candlestick analysis involves the visual identification of patterns that have been recognized for hundreds the years. Identifying technical analysis chart formations that have produced a statistical probability result makes for an excellent trading format.

One of the most powerful technical analysis chart formations is the gap. Gaps occurring at different locations in a trend have different meanings. Taking advantage of what they reveal becomes highly profitable. Dissecting the implications of a gap/window makes its appearance easy to understand. Where a gap occurs is important. The ramification they reveal in a chart pattern is an important aspect to Japanese Candlestick analysis. Some traders make a living trading strictly from gap trading.

Gaps (Ku) are called windows (Mado) in Japanese Candlestick analysis. A gap or window is one of the most misunderstood technical messages. It is usually advised by a good percentage of investment advisors to not buy after a gap. The explanation being that it is too dangerous to predict what will happen next. That advice usually comes from somebody that does not know how to use gaps successfully. Gaps reveal powerful high profit trades. Candlestick signals, correlated with the appearance of a gap, provide high-probability profitable trade set-ups. The unique built-in forces, encompassed in the Candlestick signals, and the strength of a move revealed by the existence of a gap, produce powerful trading factors. The knowledge of what this combination of signals reveal will produce consistent and strong profits.

These technical analysis chart formations are not “hidden” secret signals or newly discovered formulas that are just now being exposed to the investment world. These are a combination of widely known but little used investment techniques. Candlestick signals obviously have a statistical basis to them or they would not still be in existence after many centuries. Gaps have very powerful implications. Combining the information of these two elements produces investment strategies that very few investors take the time to exploit.

Consider what a window or gap represents. In a rising market, it illustrates prices opening higher than any of the previous days trading range. What does this mean in reality? During the non-market hours, something made owning a stock, or any other trading entity, tremendously desirable. So desirable that the order imbalance opens the price well above the prior day’s body as well as the high of the previous day’s trading range. As seen in Figure 1, note the space between the high of the previous day and the low of the following day.

Gap Trading Example

Gap Trading Example

Witnessing a gap or window at the beginning of a new trend produces profitable opportunities. Gaps formed at the beginning of the trend reveal that upon the reversal of direction, the buyers have stepped in with a great amount of zeal. A common scenario is witnessing a prolonged downtrend. A Candlestick signal appears; a Doji, Harami, Hammer, or any other signal that would indicate that the investor sentiment is changing. What is required to verify a Candlestick reversal signal at the bottom? More buying the next day! A bullish candle indicates a reversal has occurred. A “gap-up” bullish candle indicates that a reversal has occurred with extraordinary force.

Many investors are apprehensive about buying a stock that has popped up from the previous day’s close. A risky situation! The hesitancy is caused by the percentage move. When most investors are happy with a 10% return annually, it is hard for an investor to commit funds to a position that has moved 12% in one day. Understanding what the gap-up represents eliminates that fear.

A Candlestick investor has been forewarned that the trend is going to change, viewing the Candlestick signal as the alert. A gap-up, illustrating buyer enthusiasm, reveals excessive strength. Use the gap as a strength indicator. The fact that the initial move is substantial should act as an indication that the remaining move of this new trend could be more substantial.

Always keep in mind, the markets do not care what investors fears and perceptions are. A price that has moved dramatically in one day may be cause for fear to enter a trade from most investors. They do not have the knowledge to understand what that strong move illustrates for the future.

Gaps form in many different places and forms. Some are easy to see, some need to be recognized. Utilizing the technical analysis chart formation information provides the capability to be involved with high profit trades. The information provided from the combination of a Candlestick buy signal or sell signal, followed by a gap, reveals an immense amount of information. And being able to analyze the technical analysis chart formation correctly provides an investor with the opportunity to make good consistent profits.

What is the Strongest Candlestick Signal? The Kicker Signal!

What is the strongest candlestick signal? The Kicker signal! It demonstrates a severe change an investor sentiment. A good rule of thumb is that if an investor sees a Kicker signal, he/she should go long or short depending on whether it is a Bullish Kicker or a Bearish Kicker.

And that is exactly what we saw happen today in the NASDAQ index. The Bearish Kicker signal, especially with the stochastics in the overbought area, indicates that we want to be out of our long positions, either sitting in cash or shorting the market.

Kicker Signal

KICKER SIGNAL
( Keri Ashi )

Description

The Kicker signal is the most powerful signal of all. It works equally well in both directions. Its relevance is magnified when occurring in the overbought or oversold area. It is formed by two candles. The first candle opens and moves in the direction of the current trend. The second candle opens at the same open of the previous day, a gap open, and heads in the opposite direction of the previous day’s candle. The bodies of the candles are opposite colors. This formation is indicative of a dramatic change in investor sentiment. The candlesticks visually depict the magnitude of the change.

Criteria

  1. The first day’s open and the second day’s open are the same. The price movement is in opposite directions from the opening price.
  2. The trend has no relevance in a Kicker situation.
  3. The signal is usually formed by surprise news before or after market hours.
  4. The price never retraces into the previous day’s trading range.

Signal Enhancements

  1. The longer the candles, the more dramatic the price reversal.
  2. Opening from yesterday’s close to yesterday’s open already is a gap. However, gapping away from the previous day’s open further enhances the reversal.

Pattern Psychology

The Kicker signal demonstrates a dramatic change in the investor sentiment. Something has occurred to violently change the direction of the price. Usually a surprise news item is the cause of this type of move. The signal illustrates such a change in the current direction that the new direction will persist with strength for a good while.

There is one caveat to this signal. If the next day prices gap back the other way, liquidate the trade immediately. This does not happen very often, but when it does, get out immediately.

Consolidation Pattern

Trading a consolidation pattern can result in substantial profits in trading stocks, trading futures, trading options, and trading commodities as well. When the market is coming to a consensus on the value of an equity it often generates a price chart that seems to oscillate above and below a given price. That price median or average price may be stable, trending up, or trending down. The point is that the stock price and other price swings above and below the mid range will tend to tighten up. The market is consolidating its opinion regarding the equity. At first glance this would seem to be the time to get out of the stock, commodity, option, or futures contract. If the equity is trading sideways, where is there any profit? Technical analysis with time honored technical analysis tools such as Candlestick patterns may tell traders that such a consolidation pattern may well be a prelude to a substantial upside breakout of stock price, commodity price, futures price, or option premium price.

Although a consolidation pattern results from market indecision it ends up with market consensus. A consolidation pattern may be superimposed on upward market trends. This kind of pattern can also be a prelude to market reversal. Knowing Candlestick analysis helps the trader anticipate just where the apparent market indecision is going to lead. Buying at the bottom of a downward trending stock price can lead to substantial profits for the trader who accurately reads the Candlestick chart patterns suggesting a consolidation pattern and uses discipline in trading the same. A consolidation pattern evolves as traders using fundamental analysis recognize the basic support and resistance zones of a stock or other equity. As technical traders read this price action they will anticipate price turnarounds and may, in fact, help to shrink the range between highs and lows even more. It comes to a point where the use of fundamental and technical analysis makes it clear to savvy traders that the equity’s basics and the sentiment of the market will support a higher (or lower) price. Then there is typically price a breakout and a substantial run up, or down. Using Candlestick pattern formations as a guide the trader can often gain profits from the accurate reading of a consolidation pattern.

There are a number of consolidation patterns, none exactly the same. As with trading all patterns the trader who first recognizes where the pattern is leading to may well be the one to make the most profit. Unfortunately, the same trader is opening himself up to losses if, in fact, he misreads what is happening and sees a consolidation pattern where none exists. The conservative trader will seldom over read a pattern but may be the last one in to a market swing and, thus, realize less profit. In both cases the trader is wise to set his stops as he makes his trade, follow the trend, and adjust stops along the way. The wise stock market, options market, commodity market, or futures market trader will continue to use Candlestick charting as a guide as the pattern and its breakout progresses. Learn technical trading with Candlesticks and take advantage of market indecision, market consolidation, and potential price breakouts.

Market Direction

Utilizing candlestick signals provides one huge advantage. They show you when it is time to buy. This also includes what to do after a price as opened much higher. There is valuable information built into the signals and each individual candlestick formation. Fortunately, the analytical tool for assessing what each signal/formation is revealing requires nothing more than common sense. Whether analyzing the market trend in general or looking for specific stock breakout patterns, candlestick analysis becomes mastered by merely recognizing reoccurring price patterns.

Remember how difficult it was to memorize facts, maps, figures, or  historical events in school? The difficulty came from questioning how useful that information was going to be for our future. Most of it was boring. Candlestick charts have a completely different result. Memorizing and understanding the chart patterns is going to create high probability big dollar trades.

As can be seen in the CCME chart, the open gapped up approximately 4%. One of the first questions from our chat room was “Is this open to big to be buying at these levels?” This is where recognizing the chart patterns becomes extremely valuable. Not only the longer term chart pattern, but also the immediate chart pattern. Note how the price of CCME had been drifting sideways and slightly down for the past two weeks. Once the T line caught up, a Morning Star signal appeared. Under these conditions a very simple but highly expected result occurs. The price moves up as if it had a slingshot effect coming out of a mini scoop pattern.

The analysis becomes relatively easy. A Morning Star signal at the lower end of a down sloping trend requires confirmation. A gap up in price is a very viable confirmation. What does it mean when a price after a candlestick reversal signal? The buyers want back into this position very aggressively. This is exactly the type of scenario an investor wants when establishing a position.

CCME Consolidation Pattern

CCME

The longer-term analysis also aids in the evaluation of this trade. A huge Fry Pan bottom has developed since the early part of November. The price has also moved up from a Fry Pan bottom/Cradle pattern that formed at the end of December. What do we expect after a Fry Pan bottom? A very strong price move! What do we expect after a very strong price move? The possibility of a J hook pattern! After a pullback to the T line and the formation of a Morning Star signal appearing, what type of pattern would develop if the price move higher? A J-hook pattern! When the price opened higher today, gapping up, this leads to buying immediately. All the makings of a positive trade are in place. Will all trades move up dramatically in this type of situation? Definitely not, but the probabilities project moving up today or over the next four days is greatly improved when using the rules applied the candlestick analysis. This is the type of memorization you want to keep applying to your investment practices. The charts will demonstrate where high profit trades setups will occur just like they have done many thousands of times in the past.

The Dow and the NASDAQ continued to show steady strength. The Dow would be more worrisome due to its lack of consolidation. However, this has been remedied with the NASDAQ pulling back a few days and starting back up, creating a market trend has taken some profits out and is now continuing the uptrend with new strength.

Dow Consolidation Pattern

DOW

NASDAQ Consolidation Pattern

NASDAQ

The longer this market continues in a slow steady uptrend, the more compelling the reversal signal needs to be. A slow steady uptrend in the markets is very beneficial to the candlestick investor. It allows for price patterns to breakout for inordinate profits. The formation of each candle provides information on investor sentiment.
Chat session tonight at 8 PM ET – We will discuss the appropriate actions after big price moves, such as Netflix. The development of each daily formation allows an investor to create a game plan for whether to stay in or get out. Join us tonight for a look into big price move analysis.

Good Investing,

The Candlestick Forum Team

Successful Commodities Trading

Even the beginner can engage in successful commodities trading. Traders can make money in successful commodities trading by choosing commodities that they have an interest in and knowledge of. Commodities traders can use technical analysis tools such as Candlestick chart analysis to track and predict price changes in a given commodity. Successful commodities trading comes down to combining technical analysis with fundamental analysis. A good place to gain a firm knowledge of the fundamentals of commodities trading is with Commodity and Futures Training. Once traders have learned the fundamentals of trading commodities they will choose a commodity to trade such as oil futures or gold futures. Those with an agricultural background or interest may consider live cattle commodity trading or corn futures. Discipline, a trading strategy, and attention to detail will convert knowledge and commodity price patterns into profits for the hard working trader.

The list of commodities to trade is long. Corn, mini-corn, corn swaps, corn calendar spread options, distiller’s dried grain futures, wheat, mini-wheat, wheat swaps, wheat calendar spread, soybean, min—soybean, soybean swaps and so forth is how the Nymex list of commodities products starts. Metals traded include industrial metals such as copper futures and precious metals with some industrial use such as gold and platinum. Energy products include crude oil futures as well as natural gas futures, coal futures, and energy credits. For successful commodities trading it is important to have a strong working knowledge of ones own traded commodities. It is always important to remember that the biggest traders in the commodities markets include the producers, processors, and commercial and industrial buyers of commodities. These companies are hedging their investment risk in buying and selling commodities. Having only a passing knowledge of a commodity that you are trading puts you at a distinct disadvantage compared to someone with a background in the industry in question and decades of trading experience.

Despite the fact that traders are working in markets where the biggest players are experts it is absolutely possible to be successful in commodities trading. Part of why traders are successful is that they learn each commodity that they trade very well. They learn the Candlestick pattern formations in current trading and in the past. They follow the appropriate information sources to stay current on fundamentals. And, they get to choose which commodities to trade. A wheat trader working for a multinational grain company may work to hedge his company’s investment risk in grains but will likely not be trading gold futures, silver futures, platinum, or palladium. The wise trade will be knowledge across several commodities and will be able to trade where the action is or avoid markets that are so volatile as to be dangerous. Successful commodities trading can often come from trading the right commodities at the right time as much as from technical skill.

Anyone successful in commodities trading is always a student of the art of trading and a student of the commodities that he or she trades. A successful trader maintains a keen interest in just how a successful trade came about and how an unsuccessful trade happened. Experience leads to success and failure. Reviewing Candlestick chart formations, becoming a student of Commodity market history, and always working to improve a commodity trading system by review of produces results. Learning from experience leads to successful commodities trading.

Stock Market Home Study Course – Trading the Two Crows Candlestick Pattern

An investor looking for a stock market home study course is looking for investment training that is simple to understand and easy to implement. Many a stock market home study course does not fulfill that criterion. Investors do not have a firm grip on the information being conveyed. Further expensive training courses are required. A stock market home study course that is simple to understand is the training course for learning candlestick signals. Candlestick signals provide one very simple element. They are  visually easy to recognize. The main facet for a stock market home study course should be being able to implement the investment training to successful investing without a multitude of additional courses. Candlestick signals and candlestick analysis utilizes common sense investment practices put into a graphic depiction.

The Japanese Rice traders have produced a number of reversal signals that have proven themselves successful over the past for centuries. The results of the signals are statistically proven. Not by computer back testing, but with actual profitable results through the centuries. A stock market home study course should provide a proven trading program that is  not still in the experimentation process. Candlestick signals provide investors with a very clear visual format for when a price reversal is occurring. Utilizing this information becomes a simple visual analysis.

Another element of a stock market home study course should be its application in all market conditions. Candlestick analysis not only provides a trading method for finding individual stocks, it provides an analysis process for projecting the directions on the markets. The information  conveyed through the proper use of candlestick signals  produces a training platform that allows an investor to exploit profits from all market conditions. The value of any stock market home study course is directly related to the effectiveness of the information provided. Candlestick signals provide high probability investment situations. Learn how to use the signals correctly and you will understand how the professional investors think. You’ll be able to exploit profits from the reoccurring emotional trading where most investors lose money.

There are 12 major candlestick signals. Learning those signals well will provide more investment knowledge than most investors will understand in their lifetimes. The remaining candlestick signals are not so important that they need to have a lot of time and effort spent on learning what they mean. However, being able to recognize the signals allows an investor to come back to a reference and get more information on what that signal is conveying. The Two Crows Pattern is part of our trading articles for Candlestick Secondary Signals. While these signals are considered ‘secondary’ it does not negate the effectiveness of their strong trading potential. They are called ‘secondary’ because they do not appear as frequently as The Major Candlestick Signals.

Two Crows Candlestick Pattern

TWO CROWS PATTERN

Description

The Two Crows Pattern is a 3-day pattern. It is only a top-reversal pattern. Like the Upside Gap, the Two Crows is a gap pattern, created between the long white candle at the top of an uptrend and the small balck candle at the second day. The black candles gaps open and pulls back before the end of the day. Even though it has pulled back, it did not fill the gap. The third day opens in the body of the small black candle. The Bears maintain the control and move it lower. They are able to fill the gap and close the price within the white candle body. The gap being filled so quickly eliminates any expectations from the bulls.

Criteria

  1. A long white candle continues the uptrend.
  2. The real body of the next day is black while gapping up and not filling the gap.
  3. The third day opens within the second day’s body and closes within the white candle’s body. This produces a black candle that filled in the gap.

Signal Enhancements

  1. If the third day were to close more than halfway down the white candle, it would form an Evening Star Pattern.

Pattern Psychology

After a strong uptrend has been in effect, the atmosphere is bullish. The price gap opens but cannot hold the gains. Before the end of the day, the bears step in and take the price back down. However, the gap up from the white candle was not filled. The next day, the price opens slightly higher, within the body of the previous black candle. The bulls aren’t as boisterous and cannot keep the momentum going. Prices head lower and closes in the white candle range. The gap up from the bullish exuberance of the previous day is very quickly wiped away. The further the third day closes into the white candle body, the more bearish the implications.

Great Stock Market Trades Found in Breakout Patterns

A major advantage of Candlestick formations is that they can identify dramatic changes in investor sentiment. One of the highest profit potentials for making money on big stock market trades is being able to analyze the investor sentiment upon a stock “breakout” situation. Utilizing the candlestick patterns to interpret the results of a breakout situation provides a huge advantage to the Candlestick investor.

A breakout is almost self-explanatory. It is the dramatic movement of a stock market trade moving out of its normal trading area. It also has the element of a significant percentage increase in its normal daily trading range. This is usually accompanied by a massive increase in volume. A breakout is usually the result of an unexpected event or surprise result of a company’s operations. This can be affected by both internal as well as external factors. A prime example was Invision Technologies, the company that manufactures the luggage scanning machines at airports. 9/11 brought this company to the forefront. The huge move, an extremely large white candle in that stock price, far above its trading range for the prior six months, immediately revealed a definite change of investor sentiment towards this company. Breakouts, revealed using Candlestick analysis, immediately identify the stock market trades that have huge percentage gains potential.

Other breakouts are usually caused by new fundamental potentials within a company’s product potential. Whatever causes the new investor sentiment in a stock, the resulting candle or candles provide the information needed that would indicate the upside strength of a new move in a stock price. Dynamic Materials Corp., BOOM, is a good illustration of a breakout. Note in the November chart, after trading for four years between $3 and $4 dollars a share, a news item created a new investor perspective on this company. The fact that the white candle, that broke this stock out, closed near the high end of the trading range was an indication that upon this stock doubling in price in one day, investors still felt confident to stay in the stock and not take profits yet.

Boom Candlestick Breakout

BOOM

Very rarely is a breakout on strong volume and a huge percentage price move going to immediately fizzle and move back down to the previous normal trading area. However, not all breakouts immediately go up. But an inordinately large percentage do eventually move to much higher ground after the initial breakout. For those investors that have been following the stock picks over the past few years, AVII is one of our long-term holds. That “hold” recommendation was based on the promising future potential of this company’s products. But when will that potential become evident?

Seven trading days ago, an announcement about receiving patents created a breakout in AVII. A stock that trades approximately 100,000 to 300,000 shares per day moved up over 100% on over 40 million shares traded. This was a dramatic change of ownership in the stock. The Bearish Harami the following day indicated that there would be some pullback action. Friday’s chart, as can be seen below, formed a Bullish Engulfing signal right at the base of the bullish candle that formed the breakout. The last six days of trading have seen an average of 5 million shares traded each day. The Bullish Engulfing signal reveals that the profit-taking selling may have stopped.

AVII Candlestick Breakout

AVII

The breakout tells us something. There is now a new dynamic in this stock. As with most breakouts, the stock trend has an extremely high probability of moving higher, the first target testing the breakout candle high at approximately $4.20. However, over the longer-term, meaning six weeks and greater, the upside potential could be higher. This is not a specific stock recommendation but it provides some educational background on breakout situations. AVII fits into that category.

Struggling Stocks – How Do You React?

On Wall Street, the old saying that “no news is good news” does not seem to hold true with struggling stocks. During the first week of November, 2006, the stock market struggled amid subdued trading as traders waited for indicators on the overall health of the US economy. Although oil prices fell and Boeing Co. was a stock market mover with its huge military contract victory, there was very little to talk about as stocks struggled.

Although the stock market news of the Democratic victory in the mid-term elections did spur a sell-off, stocks struggled as experts and analysts attempted to predict the changes in store as the Republicans lost power. This shift in the balance of power touched off concern about industries from health care and pharmaceuticals to energy and defense. Experts opined that while the news of falling oil prices was a positive, the markets seemed to be taking a rest in the absence of an announcement or event that could provide a boast. Finding a successful trade when the stocks are struggling is the mark of truly knowing how to invest in stocks.

With the general end of the “earning season” for most companies, investors are looking for signs in the economy that indicate a general slowdown in the rate of inflation. The possibility of additional interest rate hikes continues to loom over the stock market and dampen the enthusiasm of positive news in the market. In these times, investors spend more time looking for hot stock market picks when, as a whole, stocks are struggling.

In times such as these when stocks struggle, traders require a strong stock trading plan. First, an investor needs a successful stock trading system such as Japanese Candlesticks. This provides the trader the ability to successfully analyze the markets. After understanding the movements in the market, the investor can implement trades expecting to make money. When stocks struggle and the market lacks volatility, the trader can look for companies to buy straddle options or buy strangle options. Such moves provide limited risk but unlimited profit potential. Other strategies include: selling covered calls, and buying or selling puts. Since the market is somewhat bearish during a period such as this, the strategies involved tend to have lower risk reward ratios. Although the market is struggling to find profit, that doesn’t mean that the successful trader must struggle. The key is for the investor to shift his, or her, thinking to a more conservative approach and look for opportunities that while offering lower returns, also offer lower risk.

Stock investing systems offer the trader a valuable way to perform technical analysis on companies and their stock to find trading patterns and be able to identify investment opportunities. In spite of the fact that stocks may be struggling, following a trading plan helps the investor to find the companies that are moving and implement trades. A trader cannot simply develop a plan and follow it. This plan should be living and changing as the market evolves. Struggling stocks should only cause an investor to adapt the trading plan, not to quit making money.