Archives for September 2019

Coal Futures

Among the energy commodities that prosper with the economic recovery are coal futures. Forty-one percent of the world is electricity and generated by coal and coal heats furnaces in the iron and steel industry. Although China has its own coal reserves India and Brazil with their growing economies do not and will need to import to support their industrial growth. Coal futures are traded on the New York Mercantile Exchange (NYMEX) as well as the Australian Securities Exchange (ASX). China’s Dalian exchange is planning on adding coke futures this year and planning to add coal futures at a later date. In commodities trading traders study both fundamental and technical analysis of a commodity in order to predict futures prices. With coal futures the fundamental commodity analysis has to do with the speed of economic recovery in the population centers and industrial regions of the world. The technical analysis has to do with anticipating the actions of other traders and uses time honored tools such as Candlestick chart analysis. For those interested in trading futures in coal or other commoditiesCommodity and Futures Training will provide the basics as well as more advanced insight into commodities markets.

An example of trading coal futures is central Appalachian coal futures. Open outcry trading takes place Monday to Friday from 9 am to 2:30 pm on the trading floor. However, online commodity trading takes place Sunday through Friday via CME Globex and CME ClearPort. Prices are quoted in dollars and cents on contracts of 1,550 tons. Minimum price fluctuations are one cent a ton. Central Appalachian coal trading terminates in the month before delivery and contracts are available for the current year and next four years. As with most commodity trading only producers and buyers who are hedging the market will stay in a contract until the settlement date. The vast majority of traders who buy or sell futures contracts will exit the trade prior to the end of trading. The four year span of available contracts provides commodities traders with a window of opportunity for anticipating price changes and profiting in the coal futures market.

Futures in coal are also available on the NYMEX for Powder River Basin (Wyoming) coal and other exchanges trade other sources. Central Appalachian coal and Power River coal will not necessarily be shipped to Brazil, for example. However, the price of coal in Brazil, India, China, Europe and the USA are interlinked. As with any free market a price variation providing profit opportunity is typically exploited. Thus coal prices around the world will “correct” as demand and supply dictate price in any of a number of markets. Using technical analysis tools such as Candlestick pattern formations trading strategies such as Candlestick trading tactics it is possible to anticipate swings in the price of coal in its various forms and profit in buying and selling futures. In addition it is possible to trade options in futures as well. Buying callsbuying putsselling calls, and selling puts on futures is also a means of profiting when trading futures in coal.


Market Direction

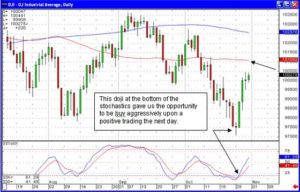
How do you know when to buy when there is not a current candlestick buy signal? This is one of the dilemmas most investors run into. They see a price moving positive. They want to buy. However, the positive move was not instigated by a candlestick buy signal. The positive trading day was merely a positive trading day. That should cause more diligence if getting into that position. There will be positive moves that start without a candlestick reversal signal. However, if those moves were consistent or substantial, hundreds of years of observations by the Japanese Rice traders would have produced a signal that was to be watched with that type of formation. That does not necessarily mean the price won’t move higher. The probabilities are much greater in uptrend is in progress when it starts with a candlestick buy signal.
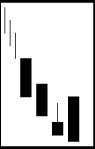
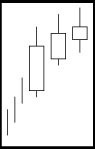
Coal Futures, Ford Example
 
Ford

Note in the Ford Motor Company chart how there was a bullish day but not a bullish signal. Would this have been an important part of the trend analysis? Not if that was the only formation for making a buy decision. Three days prior to the indicated bullish day was a three day kicker derivative signal. That was the cause to be buying. The bullish day was confirming the strong Kicker signal. The visual aspects of candlestick analysis would’ve also shown how the stochastics had bottomed at the Kicker signal and was in an upward direction when the upward bullish day caused a close above the T-line.

Coal Futures, BAC Example

BAC

BAC is another example of how the derivative Kicker signal instigated a new trend. It could be seen bouncing off an obvious trend liine. The purpose of these illustrations is to show there are times that candlestick signals work immediately. There are other times when the signals are formed but it takes a few days for the confirmation of the signals. The purpose of profitable investing is to identify when it is time to be buying. Sometimes that is immediate. Sometimes it requires additional confirmation. However, the benefit candlestick signals provide is the visual accumulation of indicators that represent a buying area.

If you are beginning to understand how candlestick signals work effectively but would like a jumpstart in the learning process, take advantage of the two day training program on July 24 and 25th. When you are presented with the logical aspects of candlestick analysis in an orderly fashion, you will gain insights into investing that you have never had the opportunity to experience. The Japanese Rice traders have merely provided a common sense visual depiction of when the buyers are in control and when the sellers are in control. If you learn this process correctly, you then control your own destiny as far as the rates of return you would like to achieve. This information is applicable to all investing techniques. Forex trading, option trading, stocks, bonds, or commodities can all be traded successfully once you understand the psychology behind each signal in pattern.

Many investors do not learn how to invest correctly when they start investing. These incorrect thought processes remain with most investors throughout their life. Fortunately, the simplicity of candlestick analysis can completely alter an investor’s perceptions and put them in the category of seasoned investors. This is not rocket science. The Japanese Rice traders identified what would make them profitable. Learn how to use this information correctly and you will consistently produce profits in any market. Click here for more training seminar information.

Chat session tonight 8 PM ET

Good Investing,

The Candlestick Forum Team


Current Website Specials

July 2010 – Training Webinars 

Candlestick Technical Analysis Webinar – July 24 & 25

 Options Training Webinar –  August 21& 22  

Click here for details

Website special reflects current newsletter. If you are reading an archived newsletter you will be directed to the Current Website Special.

Stock Market Predictions – Do Candlestick Signals Work?

It is often asked whether the candlestick signals are effective in long-term stock market predictions. Unfortunately, the answer to that is yes and no. Yes, in the sense that if the definition of long-term is two, three, or six months out in the future, the signals can be used on a monthly chart as effectively as they can on a one-minute chart. Keep in mind that the candlestick signals are the visual depiction of investor sentiment. Candlestick analysis is the evaluation of what the current and near future projected sentiment will be in a trend.

Stock market predictions of one year out into the future is not logical and any technical or fundamental analysis in this day of age. The reason is that with the information available on the Internet and TV on an instant access basis, investment decisions and psychology can change dramatically based on new information becoming available. To try to make stock market predictions for what will happen over the next 12 months is not a relevant exercise.

What looks to be a feasible projection today can easily be influenced by world events and/or the introduction of new competitive elements into a specific market. The purpose of candlesticks is not to project what will happen in a year from now, but to take advantage of what the investor sentiment is doing today. Today’s stock market projections can change dramatically at any point in time. The candlestick signals provide the opportunity to evaluate what investors are anticipating for the near-future. That short-term reversal signal may also alert the fundamental investor on new dynamics coming into the value of that company.

This makes candlestick signals an excellent timing factor for those that are investing in long-term fundamentals.


Market Direction

Another strong morning Star signal formed early this week in the Dow. The fact that the stochastics were on the oversold area in the morning Star signal was forming at approximately the same area as we are a double morning Star signal formed back in early August may just a very logical area to start buying.

Stock Market Prediction, Dow

The Dow

That is why it was recommended to buy aggressively and in the pre-market comments the day after the doji formed. The current conditions of the stochastics indicate at the 50 day moving average 200 day should be the first target.

Stock Market Prediction, NASDAQ

NASDAQ

At the same time, the NASDAQ also formed a doji and although the buying was not at the same magnitude as the Dow the next day, Wednesday confirmed the buying when the NASDAQ closed above the 200 day moving average. Additionally it closed above the last recent high of early October with the stochastics starting back up. It has been healthy to see the selling early in the morning followed by buying in the afternoon the past few days. It would not be unusual to see the NASDAQ consolidate back to the moving average early next week before it continued its uptrend.

A more general analysis was illustrating that the market was not selling off in general. This would have been evaluated in the fact that the NASDAQ was trading sideways while the Dow was in a three-week decline. The assumption would be that money was shifting from sector to sector, not coming out of the market.

Stock Dividends – Easy Money In The Stock Market?

What is the best part of investing in the stock market? If you said, “making money”, you’re right! What kind of money is the best to make? If you said, “easy money”, you’re right again. The only thing better than making money in the stock market is making EASY money in the stock market! Everyone wants to know how to do this and the answer is simple; the easiest way to make money investing in stock is through stock dividends.

Stock dividends occur when a company decides to distribute a part of its profits to the shareholders. Notice I said “a part of its profits”; let’s face it, companies are not benevolent souls that want to lavish gifts on others! Companies are, however, created to make profits for their owners. The remaining money is generally used to reduce debt or make acquisitions that will help the company grow. Wise money management is what makes these companies attractive to investors, helps them to grow and encourages them to pay stock dividends.

Companies are not forced to pay dividends. If times are bad and the company is faced with struggling stocks, it can skip paying a stock dividend. For many companies, this is viewed as a last resort because the negative publicity that is generated to forego a stock dividend is usually more harmful than actually paying the stock dividend would be. The company’s board of directors announces the stock dividend on a per share basis; if the company announces a $0.25 per share dividend, the 1,000 shares you own would generate a $250 payout, which represents the return on investment.

When discussing stock dividends, there are several important dates to remember:

  • The Declaration Date – The Declaration Date is when the board of directors announces the amount of the stock dividend and when checks will be received. The board also announces the Ex-Dividend Date at this time.
  • Record Date – This is the date when the company finalizes the list of shareholders that will receive the stock dividend. This date works in conjunction with the Ex-Dividend Date.
  • Ex-Dividend Date – This date usually occurs 2 to 4 days prior to the Record Date and it is the actual cutoff date for stock dividend recipients. On this date, the stock market reflects a lower price since the dividend is no longer available.
  • Payment Date – This is the day that the checks are in the mail for the stock dividends. This date is usually about two weeks after the Record Date.

There are actually two types of stock dividends. These stock dividends are either fixed or variable. Fixed dividends are only paid to the holders of preferred stocks while the variable dividends are paid to those who have common shares in their stock portfolio.

Stock dividends are the easiest way to make money in the stock market since all you are doing is collecting a profit from something you already own. Companies that consistently pay dividends are the foundation for investors who believe in value investing and hold a conservative portfolio. Don’t be afraid to make some easy money, select companies that pay out stock dividends!

Doji Candlestick

A Doji represents the equilibrium between supply and demand in the markets. This signal is distinct in that prices open and close at or near the same level, indicating indecision of investors. If prices finish very close to the same level, then either a very small real body, or no real body is visible, and you therefore have a Doji candlestick. When learning to read candlestick chart patterns, the Doji if often the first discussed and deemed the most important. While it is not wise to use this candle alone, when online trading, the Doji marks the beginning of a minor or intermediate trend reversal, and is therefore very important to recognize.

The appearance of a Doji after a long uptrend is a warning to investors that the trend is either close to peaking, or has already peaked in the open markets. On the other hand, after a long downtrend the exact opposite is true and prices have been forced down. There are four types of Doji candlesticks that investors must learn before day trading stock online using Japanese candlesticks. These four types include the common Doji, the long-legged, the dragonfly, and the gravestone. The basic Doji signal was already discussed however the three additional types of Doji signals are explained below.

  1. Long-legged Doji – this Japanese candlestick signal has a long upper and lower shadow that is almost equal in length, however the trader should observe the candle’s close in relation to the midpoint. A close below the midpoint of the candle indicates weakness. This signal indicates that prices traded well above and below the session’s opening level, but the end result shows little change from the open.
  2. Dragonfly Doji – this signal forms when the open, high, and close are equal, and the low creates a long lower shadow. This signal indicates that sellers drove the prices lower during the session, however by the end of the session the buyers pushed the prices back to the opening level and the session high. This signal looks like a “T” with a long lower shadow and no upper shadow.
  3. Gravestone Doji – This Doji candlestick looks like the opposite of the dragonfly thus forming an upside down “T.” It has a long upper shadow and no lower shadow, and it forms when the open, low and close are equal. The high is what creates the long upper shadow. This candlestick trading signal indicates that the buyers drove prices higher during the session, and by the end of the session, the prices came back up to the opening level and the session low as a result of the sellers.

Japanese candlestick stock trading is an easier and more precise way to make profits in the stock market, in comparison to your basic line and bar charts. Continue to learn about other Japanese candlestick signals, in addition to the Doji candlestick, in order to be truly successful in the stock market.


Market Direction

What creates a reversal in a market? Investor perceptions! On any given day a reversal can occur, not based upon a change the fundamentals, but a change of investor sentiment. Crude oil pulled back from the $145 level to the $130 level. Will that have any significant change of company fundamentals? Probably not but the fact that the perception is that with crude oil prices heading lower, things could get better for equities. The fundamentals did not change in the past few days, investor perception changed.

Doji Candlestick, CL
 
CL

So what becomes the primary scan criterion if there appears to be a reversal in the markets? Literally hundreds of stocks showed reversal signals in the past two days. How does an investor scan for the best possible potential price moves? Candlestick analysis makes that a fairly easy process. Our Candlestick Forum training CDs constantly illustrate which reversal setups have the highest potential price moves. Knowing which direction the market is moving is the first facet for finding the high profit movers. Candlestick investor’s have the benefit of knowing whether a price move has credibility or not. Witnessing candlestick signals at the reversal area lends more credence to the new trend. The Dow formed a bullish engulfing signal after a spinning top. A close above the T-line revealed the Bulls did not have any apprehension at that level.

Doji Candlestick, DOW
 
DOW

The steps for finding the highest potential trades in the new market direction are relatively simple. A scan for the strongest reversal signals in the list of sectors can be done just as easily as an individual stocks scan. Next, identifying the strongest reversal signals such as a candlestick signal followed by a gap up or a Kicker signal or the development of a price pattern move would create the best probabilities of be an in a strong stock move.
Once the sector or sectors that are showing the strongest reversal signals are identified, identifying the individual stocks in those sectors that have created the strongest reversal signals become the list to work off of. This is merely simple logic. Where are the identifiable strong signals? They will usually be in the strongest sectors.

Doji Candlestick, CMA
 
CMA

Many investors have a problem taking profits. Candlestick analysis greatly relieves the fears related to coming out of a position. Good profits were made in the oil sector and the mining sector over the past four weeks. Why were the oil stocks acting strong? Because crude oil prices were steadily rising. Why was the market in general going down? Because crude oil prices were steadily rising. When was it time to take profits in oil stocks? When crude oil prices started breaking. This provided a double reason for taking profits. First of all, when crude oil prices start dropping, the first a knee-jerk reaction would be to sell oil stocks. That works for the short term most of the time. However, there is the additional factor. For those investors that have made good profits in oil stocks when the market was going down, they now have a pool of funds to pull from for the purchase of other sectors that may now benefit from a new market rally. Will oil stocks go higher? More than likely, but for the short-term, the candlestick signals reveal the probabilities are extremely high that it is time to be out of that sector.

Doji Candlestick, HK4

HK

Candlestick signals indicate what is actually occurring in prices. We may think we can analyze what is going on in a specific market fairly well but that is not important. What we think as an individual has nothing to do with what is going to occur in the market or a stock price. Let the market tell you what the market is doing. If you learn how to use candlestick signals effectively, you will completely alter your analytical processes.

Good investing,

The Candlestick Forum Team


Training Specials

2-Day Seminar Package with $1000 in bonus products. View now

Save $250 for early registration for Sept 20 & 21 2-Day Online Training Clinic
View now
Quick-start Trading Package for beginners – 25% Off 
View now
Website special reflects current newsletter. If you are reading an archived newsletter you will be directed to Current Website Special.

Candlestick Patterns Provide the Best Technical Analysis Tools

If you want the Best Technical Analysis Tools then you need to learn the simplicity of Japanese Candlesticks!!

The Candlestick Forum strives to provide the best technical analysis tools available over the internet. Stephen W. Bigalow, author of “High Profit Candlestick Patterns”,  explains the history and profitable trading techniques for the best technical analysis tools — Japanese Candlesticks –for centuries of  proven profitable results.

Even investors new to trading, quickly identify price movements with a high degree of accuracy. due to the simplicity of candlesticks. Trading the stock market requires a great degree of discipline.  Ask any trader what is the biggest obstacle they had to overcome. Repeatedly, the answer is letting go of a bad trade. Even the best technical analysis tools can not help you fight the urge to hold onto loosing trades. Candlestick Signals remove the emotional trading that cause good trades to go bad.

The best technical analysis tools provide quick and easy methods for identifying price reversals, strong trends, weakening trends, and chart patterns ready to put money in your pocket. The 12 Major Candlestick Signals  provide  the best technical analysis tools you will ever need! Be sure to follow our Free Resources area for all the trading explanations of:

Major Candlestick Signals, These 12 Major Signals provide more profitable trades than most investors will ever need. However, it does not mean the remaining patterns should not be considered.

The Candlestick Continuation Patterns, Identify periods of ‘rest’ in a trading entity. The Japanese insight is, ‘there are times to buy, times to sell, and times to rest.” Learning these continuation  patterns will help investors know to place their money elsewhere.

Finally,  the Candlestick Reversal Signals, are highly effective patterns for identifying price reversals. An important element to any portfolio is the ability to identify when it is time to take profits, or close poor performing trades.

This week we add the “Concealing Baby Swallow” for identifying reversal of a downtrend.

Concealing Baby Swallow

CONCEALING BABY SWALLOW

Description

The first two days of the signal, two Black Marubozus, demonstrate the continuation of the downtrend. The third day, the Reverse Hammer illustrates that the downtrend is losing steam. Notice that it gapped down on the open, then traded up into the previous days trading range. This demonstrated buying strength. The last day opens higher and closes below the previous days close. It completely engulfs the whole trading range of the prior day. Although the trading ended at the trends low point, the magnitude of the downtrend had deteriorated significantly. Expect buying to show itself at these levels. This is a very rare signal.

Criteria

  1. Two large Black Marubozus make up the beginning of this pattern.
  2. The third day is a Reverse Hammer formation. It gaps down from the previous day’s close.
  3. The final day completely engulfs the third day, including the shadow.

Pattern Psychology

The bears have been in control for awhile. At the end of a downtrend, two Black Marubozu days appear. The third day gaps down at its low, then trades up into the trading range of the previous day. This buying is then negated by the sellers stepping back in. However, the bears have taken notice of the buying that occurred. The final day opens higher, again causing much concern for  the sellers. As it sells off for the rest of the day, the concerned shorts have time to cover their positions. The new closing low is not of the same magnitude of the previous down days of the trend. The buyers do not run into very much selling resistance from here.

Penny Stock Trading

Penny stock trading is the trading of commons stocks that are sold for less than one to five dollars for each share. Penny stocks are also known as micro cap (or nano) stocks which normally trade for under five dollars per share.  Penny stock trading takes place on the Over the Counter Bulletin Board (OTCBB) or the Pink Sheets, and therefore penny stocks are also referred to as over the counter stocks. These smaller stocks are typically offered by smaller struggling companies or newer companies. They haven’t proved that they are stable enough to move to the larger stock exchanges such as the New York Stock Exchange. Penny stocks are determined by their share price, per the SEC, and not their market capitalization or listing service.

Penny stock trading can riskier than trading regular stocks and should therefore be treated as seriously as trading regular stocks found on the NYSE. When penny stock investing, it is important to note that there are four disadvantages to investing in this type of stock. First, there is a lack of background of the companies traded in these small amounts. These companies have little business history or could potentially have a very negative business history. Before you begin to trade penny stocks, you must research each company to determine their potential. If the company is not headed is a good direction, then you won’t make any money by buying shares in the company.
Second, there is limited information regarding the company’s financial status when penny stock trading. It is hard to research each company because the OTCBB and Pink Sheets do not have the same strict reporting requirements as the major stock exchanges. Without this valuable information, it is very difficult for investors to invest wisely, especially if they don’t take the time to research. Third, most penny stocks are illiquid. This is due to the fact that there is no interest in the future potential of the stocks which leads to lower share prices. Lastly, penny stock trading has tax consequences for day traders. For investors who are day trading penny stocks, it pays to work with a tax specialist to ensure awareness of the tax consequences and benefits involved.

Investors new to penny stock trading will find it beneficial to practice online paper trading before trading with real money. Paper trading is a great way to find out whether or not a particular system is right for you without finding out with real money! It is definitely possible to make a nice living investing in penny stocks of small or future businesses, but you must be sure that you find reliable resources and tools for building your list of penny stocks to watch. Once you understand what to look for in a small company, you can begin to trade with real money instead of paper trading. Just be sure not to fall for hot penny stock scams where manipulative investors pump and dump stocks! Rely on your sources and judgment and invest in companies that you believe are a sound investment.


Market Direction

The mid-to-late summer trading activity is usually relatively boring in the stock market. The lack of volume obviously shows that most traders are outside doing other things. This usually makes the efforts to produce profits more difficult. Fewer traders equal less movements. However, utilizing candlestick analysis still allows an investor to participate in the trades that are creating opportunities. The scanning techniques are relatively simple. Using the simple steps found in the Candlestick Forum’s training CD, “Scanning for High Profit Trades” will consistently produce a supply of potentially strong trades. The only difference in the summertime is that the number of potential trades maybe much smaller. But that should not matter. Most investors require only one or two trades each day. It does not matter that those one or two trades come from a supply of three potentially good trades or 30 potentially good trades.

The same criteria, for finding strong trade setups, occur in slow-moving markets as they do in faster moving markets. The different expectations should be obvious. The magnitude of price moves is going to be much smaller as a general rule. Price trends may move in a very choppy slow upward or downward trend. The analysis of the market and individual stock prices have to take into consideration that there will be a different dynamic when less people are around the trade. Fortunately, candlestick analysis always incorporates the Japanese Rice traders’ advice, “let the market tell you what the market is going to do”.

When trading gets slow, the candlestick investor still maintains advantage of being able to use the information built into price patterns. Price patterns are created by the same investor sentiment time after time, not necessarily influenced by what the markets are doing in general. The Jay hook patterns, the cradle patterns, the Fry pan bottom pattern will all work equally well during any market conditions. As with individual candlestick signals, there may be fewer patterns identified. Once again, it may only require one or two strong price patterns during a sluggish market to satisfy most investors.

Penny Stocks Dow

DOW

Establishing positions in chart patterns that are setting up great two advantages. If the price does do what it’s supposed to, in spite of general market conditions, good profit to be made. If prices don’t do what they are expected to do, such as a break out to the upside, the price will usually maintain some strength even if the market it is moving severely in the other direction. At least the positions will not normally create large losses.

Penny Stocks WCG

WCG

Penny Stocks, AUXL

AUXL

Candlestick analysis is the accumulation of common sense investment practices throughout the centuries. It not only identifies the big-profit trade potential’s, it incorporates a system of common sense trading practices that provide an easy to establish discipline. The analysis itself identifies investors’ strength and weaknesses. The visual aspects make target projections much easier. Simple entry and exit strategies improve the probabilities of being in and out of a trade at the appropriate times. Simple stop loss strategies can be applied. Candlestick analysis covers the whole spectrum of investing successfully. Many investors find that the training available on the Candlestick Forum does not involve only finding the most successful trades, but it also illustrates all the other aspects involved for successful investing. This is not a difficult learning process. For those investors that have taken the time to accumulate the knowledge built into the candlestick signals, any investing they do in the future becomes better thought out.
Chat session tonight at 8 p.m. ET for members only. Next Thursday the chat session is open to everybody. These are usually good opportunities to invite your friends, relatives, and children to a learning process that may become valuable for them in their future.

Good investing,

The Candlestick Forum Team


Website Special

Major Moving Averages Plus Bonus Video and PDF

Learn to recognize the stock charts with powerful profits.
Combine the precision of Candlestick Patterns
with Major Moving Averages!

Website special reflects current newsletter. If you are reading an archived newsletter you will be directed to Current Website Special.

Stock Traders

Types of Stock Traders
When discussing the different types of traders who trade stock, it is first important to understand what a stock trader is as opposed to a stock investor. Stock traders typically attempt to profit through short term stock trading that lasts anywhere from several seconds to several weeks. Equity is traded on the stock market through the use of technical analysis with the goal to profit from short-term price volatility. There are different types of stock traders that are later discussed in this article, but basically a trader is a person who buys and sells stocks in order to make a profit. Conversely, a stock investor purchases stocks to hold onto for a longer period of time, such as several months to years. Stock investors practice fundamental analysis and they participate as shareholders with part ownership to companies.

The major styles of trading discussed in this article include day trading (including scalping and momentum trading), technical trading, fundamental trading, and swing trading.

Day traders – day traders will typically buy and hold stock between a few seconds to a few hours. The goal is to get in and then get out by selling out of any particular stock for a profit as fast as you can. These types of stock traders do not hold stock overnight in order to prevent from losing out of their gains made that day.

Scalpers – This day trader makes tons of trades each day and their stock trading is restricted to quick and repeated buying and selling of a large volume of stock during a very short period of time. The goal is to earn a small per share profit on each transaction at a minimum risk by exploiting the bid-ask spread.

Momentum Traders – these traders look for stocks that move significantly in one specific direction on high volume, and they attempt to jump on the bandwagon to ride the momentum to their desired profit. These traders trade stocks that are in a moving pattern during the day. The goal is to buy stock at the bottom and sell it at the top.

Technical Traders – These stock traders constantly read stock charts and graphs. They watch the lines on these charts or graphs for signs of divergence or convergence used to indicate buy or sell signals.

Fundamental Traders – These traders trade stock based on fundamental analysis. Fundamental analysis look at things such as earnings reports, stock splits, mergers and acquisitions. They practice long-term investing and hold onto stock for several months to several years.

Swing Traders – Swing trading stocks is similar to day trading stocks, but swing traders hold their stocks longer. They also attempt to predict future price movements over the short-term but they hold stocks for more than one day, if necessary. Swing traders assume greater risk than day traders because they take a risk by holding onto stock overnight. Day traders, on the other hand, liquidate their stock at the end of each day.

There are many types of stock traders and many different methods available for traders to use. For those new to investing in stocks, be sure to research not only the types of trading that you can do, but also the different methods that you can utilize.


Market Direction

This past week of trading was a perfect illustration of how prices move, not on the basis of fundamentals, but on the perception of fundamentals. It is often asked whether any trading method could anticipate the markets price action of last week. When outside influences, such as government intervention, starts playing into the market, there is no trading method that can anticipate unforeseen actions. However, candlestick charts allow an investor to clearly and quickly analyze what investor sentiment has developed based upon unforeseen actions. This may sound like trying to catch the horse after it is out of the barn. But the big benefit of candlestick analysis is that the candlestick investor at least has a good idea which direction the horse is going.

The results of candlestick signals and patterns becomes a relatively predictable analysis. This is due to one simple factor! Investor sentiment reacts the same way over and over during price movements. There are different dynamics in investors minds when prices are going down. There are different thought processes in investors minds when prices are moving up. Sideways price movements also create common investor reactions. Candlestick analysis is merely the graphic depiction of what is occurring in investor sentiment. It does not take a rocket scientist to evaluate what a price trend “should” do based upon a reoccurring pattern.

An often asked question is what will we learn during a Candlestick Forum Online Training session. The information conveyed by both Rick and Steve has one solid fundamental element. It teaches the investor how to utilize the commonsense investment practices built into candlestick signals. That education includes recognizing the signals and patterns that have a high probability result. Steve illustrates the major signals and patterns that have the capability of producing extensive profits. More importantly, he educates investors to understand the psychology that created the signals and why they work the way they do. This information is an extremely powerful combination. It provides a full understanding of why prices move the way they do, as the professions think. This creates the analytical ability that can be used in any market conditions for the rest of your life. Rick’s knowledge as an extremely strong dynamic for successful investing. Extensive research and practical use allows Rick to combine additional technical indicators to fine tune a successful trading strategy. The utilization of candlestick signals in conjunction with other indicators dramatically improves the probabilities of being in the right trade/position at the right time. Come join us on October 4 and 5, 2008. This today training seminar puts everything in a logical order. Once you have learned the nuances behind successful trading with candlestick’s, you will be able to analyze any trading market that you would like to participate.

Member Chat Session tonight at 8 pm ET will be hosted by Rick.

Good investing,

The Candlestick Forum Team


Scanning Techniques for Higher Profits

Scanning Techniques to Higher Profits – 50% OFF!

Once taught only to Steve’s private clients; now available on CD.
Click here for more details.

Website special reflects current newsletter. If you are reading an archived newsletter you will be directed to Current Website Special.

Commodity trading software is less effective without candlestick signals

Commodity trading software is not  very effective if price trends cannot be analyzed. Whether using commodity trading software for executions, or for an analysis of commodity trends, without candlestick signals the software becomes much less effective. Keep in mind, candlestick signals were developed while trading the most basic of commodities. Rice! Japanese Rice traders analyzed and observed signals that would reoccur in price trends. Through the centuries, reversal signals and continuation patterns were discovered to work very effectively. These patterns incorporated the recognition of consistent and predictable investor thought processes. Most computer trading software does not allow the instant determination of a reversal in a price trend.

Learning how to use candlestick signals effectively will eliminate any use of commodity trading software. The analysis that can be provided by candlestick signals has one great benefit. The human mind can calculate what other outside influences might be affecting a commodity price. This is something that most commodity trading software cannot do. Being able to incorporate the knowledge that is provided by the candlestick signals while also interpreting what other outside influences may be doing to a price has huge benefits.

Having the ability to analyze whether a reversal is occurring is the primary function of technical analysis. Most commodity trading software does not have the inherent analytical processes to consistently produce profitable trading results. Utilizing candlestick signals puts the probabilities in the investor’s favor. This analysis can be applied to all commodity trades as well as stock trades. Do not depend on commodity trading software. Learning how to use candlestick signals successfully will permit any investor to successfully trade in any market in any condition. Learn the signals! They have already been proven for over four centuries of studies providing a strong statistical base.

Advance Block

ADVANCE BLOCK

Description

The Advance Block is somewhat indicative as the Three White  Soldiers but it is a bearish signal. Unlike the Three White Soldiers, having consistent long candles, the Advance Block shows signs of weakness. The bodies are diminishing as prices rise and the upper shadows becoming longer indicate that the bulls are getting more resistance from the bears. This pattern is going to occur in an up-trend or occurs during a bounce up in a downtrend. It is visually obvious that the rise is losing its power.

Criteria

  1. Each white candle occurs with higher closes.
  2. The opens occur in the previous day’s body.
  3. The bodies are getting smaller and/or the upper shadows are getting longer.

Pattern Psychology

After an up trend or a bounce up during a long downtrend, the Advance Block will show itself with an initial strong white candle day. However, unlike the Three White Soldiers, each proceeding day becomes less strong. If the bulls try to take the prices up, the bears step in and take them back down. After three days of waning strength, the bears should confirm the reversal with further deterioration.

Training Tutorial

Candlestickforum Flash Cards  These unique Flash Cards will allow you to be “trading like the Pro’s” in no time.

Elliott Wave

The Elliott Wave Theory
The Elliott Wave Theory was named after an accountant named Ralph Nelson Elliott and he concluded that the movement of the stock market can be predicted through observing and identifying repetitive patterns of waves. This theory bases these market movements on crown behavior, now referred to as the psychology of investing and trading. He determined that crowd’s behavior can be predicted through analyzing wave patterns.

His theory is based on the rhythms found in nature. What this means is that it is suggested that the market moves in the direction of the main trend and that trends are reflected in a five series of waves called impulse waves. Additionally, there exists a series of three corrective waves that move against the trend. (See trend trading). The difference between the Elliott Wave Theory and other similar theories is that his theory suggests that there is not absolute time requirement for these cycles to complete however both the corrective and impulse waves can be seen in long-term and in short-term stock charts.

These waves can also be further broken down into more waves as it relates to Fibonacci numbers. Traders will use Fibonacci indicators as reference points when trading, to predict a retracement versus a reversal. Fibonacci indicators provide an excellent visual map and are extremely accurate when analyzing chart pattern reversals.
There is a very high degree of subjectivity when looking at Elliott’s theory and as a result it is very difficult to find agreement among stock traders. The main disparagement deals with the waves and the fact that it is difficult to tell when a wave begins and when it actually ends. There are no real clear definitions however, the stronger the impulse wave is the stronger the corrections will be. Of course, the weaker the impulse wave is the weaker the correction wave will be as well.

Confirmation when using the Elliott’s theory deals with oscillators and divergence. The Elliott Wave oscillator can be used to choose highs and higher lows in an uptrend and also lower highs and lower lows in a downtrend when helping to confirm proper entry and exit points. Additionally, this theory used divergence between the oscillator and the price for confirmation.

There are so many different technical indicators to use when stock trading that it can be overwhelming. Just be sure that you explore and have an understanding of the basics of the most popular and widely used methods, and then focus on a couple of technical analysis methods that you can use together. Don’t try and use them all or you are causing yourself undue stress. Just become and expert on two to three and use them in your every day trading.


Market Direction

Candlestick signals and formations are extremely powerful for detecting when investor sentiment has changed. The reversal signals clearly illustrate that a  change of investor sentiment is occurring. Conversely, the opposite is true. Candlestick analysis allows for the evaluation of a trend as to whether that trend is continuing in its current direction. This may be a very simplistic statement. However, it is a very beneficial tool for investors. Many investors allow their emotions to let  them to be whipsawed during a trend. If you understand what is required to change a trends direction, you become much more comfortable during the countermoves of a trend. This morning’s trading was a clear example.

With stochastics in the oversold condition, the Dow and the NASDAQ formed “almost” reversal signals on Friday. The Dow formed a Hammer type signal but did not quite reach the requirements of a pure Hammer signal. The tail was not quite two times the body. The NASDAQ formed a potential Meeting Line signal. However, the close of Friday did not quite close exactly on the close of Thursday. These formations, although relatively close to being potential reversal signals, were not quite reversal signals. These become very important factors when deciding to cover short positions or not. The fact that they were not pure candlestick reversal signals instigated one more requirement. Todays trading needed to show strong bullish confirmation. The markets started out positive this morning but did not move to the degree that would indicate the Bulls had taken over.

Elliot Wave, DOW

DOW

Elliot Wave, NASDAQ

NASDAQ

The downtrend had to be considered still in progress until there was an indication of a strong reversal of investor sentiment. After the Spinning Top formed on Friday, the NASDAQ had the potential of reversing. It gapped higher on the open but immediately started selling off. Had the buying continued after the open, that may have warranted covering short positions. The decision for closing out short positions or selling the short funds did not become an issue as the continued selling proceeded during the day. The lack of a candlestick reversal signal allows for comfortable participation in the market, being heavily oriented toward the short side. As often professed in these newsletters, let the market tell you what the market is doing. Currently, there has not been any indication that the current market sentiment has changed.

Elliot Wave, FAZ

FAZ Short Fund

Candlestick Forum Online Boot Camp – last call – The boot camp training will start tomorrow at 4:30 PM ET. The next four weeks will consist of one hour training sessions on Tuesday and Wednesday afternoons. These concentrated training sessions will deal with one specific topic each day. Each topic will be oriented toward the weaknesses most investors encounter in their investment endeavors. The information provided is information that most investors have never been exposed to. They are aspects of investing that all investors are aware of, they just have not been studied in detail. If you want to take the subjectivity out of your investment thought processes, sign up today for a very detailed, step-by-step investment process that allows each investor to gain control of their own investment abilities.

How do you take the emotions of investing? By understanding each aspect of the investment process in full detail. We all have our weaknesses. Some people have a hard time getting into a position at the right time. Some people have a hard time cutting their losses. Some people have a hard time taking profits. Simple money management techniques eliminate many of the emotional problems. Candlestick analysis is a common sense investment process that allows each investor to control their own investment acumen. Do not miss this opportunity to learn how to trade effectively for the rest of your life.

Chat session tonight at 8 PM ET members only.

Good investing,

The Candlestick Forum Team


This Week’s Special

Fast Track to Trading

The 12 Major Signals and 5-Star Trading package Combined

Learning to make your own investment decisions is easier than you think!

Click here for details

Website special reflects current newsletter. If you are reading an archived newsletter you will be directed to Current Website Special

How I Discovered Japanese Candlesticks

Have you ever wondered why you hear stories of other people making fortunes in the stock market or trading in the Japanese Yen or whatever, and you never seem to make more than a moderate return each year at the very best? I wondered that for many years myself. So what is the best stock market investing advice?

I always asked myself the question, “What are these people doing that they can make fortunes in the market and I can’t even hit my butt with either hand? I always heard that you can’t time the markets. And the most common investment advice was to find a well-managed company and hold it for long term growth. But if that was the case, then how do some people make fortunes in the markets while the vast majority of investors make moderate to poor returns? Why do Warren Buffet and George Soros have fantastic reputations for producing extraordinary returns? If the markets can’t be timed, why do they always seem to be able to pick the tops and bottoms better than the average money manager?

Twenty-five years ago I started searching for methods that would not only outperform the markets but also pull out huge profits. If one learns from their mistakes, I was becoming one of the smartest investors ever, at the cost of not making any money! I learned every technical investment method that I could get my hands on. Elliot Wave theory, moving averages, pattern recognition, momentum, stochastics, Bollinger Bands, timing oscillators, Fibonacci retracements, divergences. You name it, I learned it, trying to find a consistent method to produce profits.

Buy low and sell high! Can’t get any simpler than that, yet I would hear great things about a company, invest in it and watch it go straight down. When I couldn’t stand the pain any more, I would sell and take my losses. Inevitably, I would be selling out at the bottom. Of course that would mean I had usually bought at the top.
So what was my problem? I thought I was reasonably intelligent, as we all think we are, and I loved to invest. However, I was a constant contributor to somebody else’s stock market profits. This went on for years. I kept hunting for that proven, tested trading system that would make me rich. I looked at every new “wonderful” investment program that was being touted, that promised “amazing results” with the divulgence of “never before exposed market secrets” and if you were lucky, these secrets were not even known by the Wall Street experts. Boy oh boy.
Being the wizard that I thought I was, the first thought that would come into my mind would be, “If this amazing secret was so spectacular, then why are you letting me buy it from you for a mere pittance of the profits that you could make for yourself by using it?” Clever reasoning I thought, but then I’d pay the money anyway.

Then My Investment Career Made A Complete Turnaround!

I discovered the Japanese Candlestick method. It was being hyped by an Investment Hyping firm. So I looked at it with the same skepticism that I did with all “wonderful” new investment programs. Except through all the hype, two unique aspects could be observed. With very little investigation, it was obvious that this trading methodology was not “new secrets” from Japan being suddenly exposed to the world. The signals had always been around. Nobody from the Western hemisphere ever took the time to investigate them, to see what made them so successful.

Also, the signals did not involve difficult formulas or extensive calculating processes to master the system. All that was required was to observe predetermined signals coordinated with some simple confirming indicators. Simple enough. IF the signals worked like they proclaimed they did, then past charts would have an inordinate amount of patterns that confirmed a change of direction when all the stars aligned.

As I did my normal research, it started to become evident that the signals could be seen an inordinately high percentage of the time at the turns in a price trend. I began to pay more attention to current signals.

I noticed that companies could be getting negative comments from analysts or the talking heads on the financial news stations commenting on how bad things were in that particular industry. Yet a bullish signal forming in those stocks would be followed by a continuing upward price movement after the buy signal appeared, no matter how many negative opinions were aired on the financial stations. This was not an unusual occurrence. It happened time after time.

After years of chasing the hot stories or the great recommendations from brokerage firms and not make any profits, the candlestick signals actually had me looking for stocks that were appearing to bottom out. What a unique concept! Buying at the bottom. Conversely, when a stock or an industry was being given great accolades in the media and a Candlestick sell signal appeared, it became very obvious that the sell signal was the correct indicator versus all the euphoric speculations on where the stock or the industry might be heading.

I was now looking for “buy” signals at the bottom and “sell” signals at the top. A complete turnaround from my early years of investing. But the profits were now consistently flowing into, not out of my trading accounts.
The signals demonstrated extremely high profit results year after year. Whether in stocks or commodities or any other investment vehicle, the results were inordinately impressive. Witnessing the different positions of the confirming indicators produced more refinement for eliminating the less productive signal formations. My “correct” trade ratio kept expanding. Profits kept compounding dramatically.

Learning the psychology behind accurate stock enter signals will truly alter your investment aptitude. You will start looking for “buy” signals in oversold stocks. You will start anticipating when to take profits in overbought stock positions. Remember, you are not being shown “secrets” of the investment world. You will be learning a trading program concept that will educate you on how the common investor thinks, then turn that thinking into huge profits. And you will learn how to do it without having to experience all the learning bumps that I did.

Coming around full circle, thinking what I would be thinking if I was reading all of this, is the same question that I would pose to all the other magnificently sounding investment programs that are on the market, “If this trading program is so great, why are you exposing it to everybody else?”

The One Major Drawback to Japanese Candlesticks

Through the years it became apparent to me that the Candlestick trading signals were truly profitable trading indicators. So accurate that this system should be catching on like wildfire. However, the more I became convinced that the Candlestick methodology outperformed all other technical methods, the more I was surprised that very few people knew about its benefits. Very few. It was hard to find anybody who could intelligently converse about the signals. I can count on one hand the number of people that I could talk Candlestick trading with over the past ten years. And most of them had published books on the subject. The problem was that there was nobody to analyze my analysis, to confirm or reject what I saw in a signal formation. Essentially nobody knew how the Candlesticks worked and how positively effective they were.

It became apparent that this lack of knowledge would be detrimental in trying to establish a hedge fund using the Japanese Candlestick trading method. Convincing investors to invest in a fund that produces extraordinary returns, using Japanese Candlesticks, not a sophisticated sounding trading method, would be an uphill battle if trying to market to an uninformed public.

The truth of the matter is that teaching thousands of investors to utilize Candlestick investing will never affect any investments that the Candlestick Forum would be participating in. Each investor has their own specific areas of investment interest. Large cap stocks, bonds, grains, currencies, meats, options, and dozens of other investment vehicles will be the object of their investments. Even thousands of new Candlestick investors out in the investment arena would be a drop in the bucket compared to the many millions of investors in the world.

Take advantage of this candlestick investing knowledge. It will not take weeks or months to verify whether the signals work. They will prove themselves instantly. If you always keep in mind that the signals are the result of a change in investor sentiment, your road to extracting great amounts of profits from the markets will occur very quickly.

Good investing,

Stephen W. Bigalow