Technical analysis is identifying indicators that show reoccurring results. Candlestick signals are the ultimate Technical analysis indicators. The signals have been identified over centuries of observations. The utilization of the Candlestick signals, in conjunction with other technical analysis indicators, produces a strong visual format for investors.
The purpose of investing is to maximize profits. The most powerful element of the Candlestick signals is revealing reversals in price trends. Understanding the investor psychology that creates the signals, provides a powerful insight for investors. That insight not only helps the investor to recognize price reversals, it also gives the investor the knowledge of what moves prices in general. This is a very potent investment tool. That knowledge makes technical analysis a highly profitable format for consistent extraction of profits of the markets. Candlestick charts make these profit probabilities much easier to visualize.
The study of Candlestick analysis not only identifies price trend reversals, but some simple technical analysis applications help identify powerful trend reversals. One of the most compelling trade set-ups is the use of a Candlestick reversal signal followed by a gap in price. Gaps, or in Japanese terminology “Windows”, provide very relevant investment information. The Candlestick signals represent a reversal of investor sentiment from the previous trend. A gap following that signal illustrates dramatic strength in the new sentiment.
Good profits can be made knowing where a reversal is occurring. Big profits can be made knowing which reversals have the biggest potential. This is the ultimate usage of Technical analysis. Most Technical analysis methods will “suggest” where a reversal might occur. The Candlestick signals illustrate exactly when and where a trend reversal occurs. Identifying a Doji in an oversold condition followed by a gap-up, or recognizing a Kicker signal forming, allows a Candlestick investor to participate in the early stages of a very strong trend reversal.
Option Trading – Having the ability to recognize the beginning of powerful price moves not only makes for high profit stock trades, it becomes a strong technical analysis format for option trading strategies. Being able to recognize a high probability high profit move in a stock price makes the analysis of an option trade much easier.
A gap-up after a Candlestick signal incorporates three major factors involved in stock option technical analysis. Direction, time, and magnitude are much easier to assimilate into an option trade evaluation when a gap occurs.
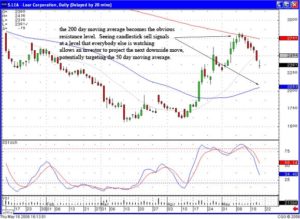
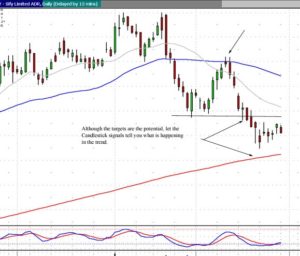
The Whirlpool Corp. chart clearly illustrates a beneficial use of Candlestick analysis.
July 18th shows a Kicker signal. A Kicker signal is formed when the price gaps up to where it is opening at or above the previous day’s open. From there, the price continues to move in opposite direction of the previous day’s price direction. The signal indicates a dramatic change of investor sentiment. Not only did that sentiment change, it did so with great force. Understanding the implications of the Kicker signal not only provides for a strong stock trade, it also produces excellent option trades.
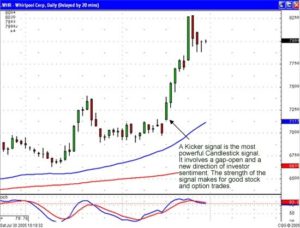
Kicker Signal Whirlpool
When the direction of a price is identified, and the potential of a strong move occurring during a certain time period can be projected, a multitude of options strategies can be implemented. In this case, the force-potential of the move produced a specific option strategy due to the amount of time until the next option expiration. Had the expiration time been much shorter, a strategy such as buying the July 75 calls and selling the July 80 calls would have been a much more profitable trade program. (Option trading strategies will be discussed in more detail in the ‘Members Only’ chat session on Monday night, August 1.)
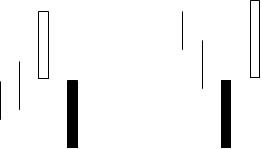
KICKER SIGNAL
( Keri Ashi )
Description
The Kicker Signal is the most powerful signal of all. It works equally well in both directions. Its relevance is magnified when occurring in the overbought or oversold area. It is formed by two candles. The first candle opens and moves in the direction of the current trend. The second candle opens at the same open of the previous day, a gap-open, and heads in the opposite direction of the previous day’s candle. The bodies of the candles are opposite colors. This formation is indicative of a dramatic change in investor sentiment. The Candlesticks visually depict the magnitude of the change.
Criteria
- The first day’s open and the second day’s open are the same. The price movement is in opposite directions from the opening price.
- The trend has no relevance in a Kicker situation.
- The signal is usually formed by surprise news before or after market hours.
- The price never retraces into the previous day’s trading range.
Signal Enhancements
- The longer the candles, the more dramatic the price reversal.
- The opening from yesterday’s close to yesterday’s open already is a gap. However, gapping away from the previous day’s open further enhances the reversal.
Pattern Psychology
The Kicker Signal demonstrates a dramatic change in the investor sentiment. Something has occurred to violently change the direction of the price. Usually a surprise news item is the cause of this type of move. The signal illustrates such a change in the current direction that the new direction will persist with strength for a good while.
There is one caveat to this signal. If the next day prices gap back the other way, liquidate the trade immediately. This does not happen very often, but when it does, get out immediately.