Archives for October 2019

Cash Flow Ratios – Measuring The Flow

In many cases, cash flow ratios signify a more accurate measurement of a stock’s value than the price to earnings ratio, P/E. A company’s ability to generate cash flow is one of the most important indicators of its health. Although much is said and written about P/E, it is not able to give you an accurate representation of a company and its efforts to generate cash flow. Because cash flow ratios examine the flow of money into a company, it can help to identify struggling companies and in turn, struggling stocks.

Price to earnings is perceived as being a very important ratio. When a company’s P/E is very high or low, it usually makes a splash on the financial pages. Understand one thing; the price to earnings ratio is a valuable metric and can help a successful investor with his or her stock technical analysis, but it is only one technical analysis tool and should be considered as such. While the same can be said for each of the cash flow ratios, these give insight into the money coming in and going out of a company. A company can demonstrate earnings, but if more money is pouring out of a company than pouring in, there will be fiscal problems in the future.

Since we have identified the importance of cash flow ratios, how do we calculate them? The two cash flow ratios that we will examine are price to cash flow ratio and free cash flow ratio. Each of these technical analysis tools looks at the flow of money in a different perspective, but both are indicators of whether a companies stock is over or under-valued.

Price to Cash Flow Ratio

The price to cash flow ratio is determined by dividing the stock’s price by cash flow per share. The reason many prefer this measurement is because cash flow is used instead of net income (found when computing earnings per share). Cash flow is calculated by taking the company’s net income and adding back the depreciation and amortization charges. The cash flow is then divided by the number of shares and the result should be a positive number. A negative number indicates that the company is burning cash and buying shares of such companies could result in many investing mistakes.

Free Cash Flow Ratio

Free cash flow ratio is a refinement of cash flow that goes a step further and adds one-time expenses capital expenses, dividend payments, and other non-occurring charges back to cash flow. The result is how much cash the company generated in the trailing twelve months. It is possible to divide the free cash flow by the current price per share and the result describes the value the market places on the company’s ability to generate cash. Such analysis allows the wise investor to make a more accurate evaluation of a company and successfully accomplish value stock investing.

Conclusion

Like the P/E ratio, both of these Cash Flow ratios suggest where the market values a company. Lower numbers relative to its industry and sector, suggests the market has undervalued the stock. Higher numbers than its industry and sector may mean the market has overvalued the stock. Thankfully for the mathematically challenged, you don’t have to do all of these calculations. Many sites on the Web include these numbers for your review. Like all ratios, they don’t tell the whole story. Be sure you look at other metrics to verify relative value. However, these Cash Flow ratios can give you significant clues to how the market values a stock.
Investing Stock Market Advice Using the Evening Star Candlestick Signal

So you want investing stock market advice and naturally you begin with a ‘Google’ search. But, this returns 56,700,000 pages for your review. Where do you begin? Do you really want to plow through all those pages and be bombarded with “buy this” or “register here for investing stock market advice”? Internet sites are a business, and we are no exception, but what happened to all the great ‘free’ material the internet is supposed to provide? The Candlestick forum continues it’s commitment to provide free stock market advice. We hope you are following our  ‘Candlestick Images and Explanations’. Each week we add another candlestick signal where we provide a graphic illustration of candlestick chart signals with descriptions for recognizing the candlestick signal, the trading criteria with signal enhancements and the pattern psychology behind the signal. We back up our promise to provide free stock market advice. Every Thursday evening Stephen Bigalow presents a live stock chat session over the internet. Absolutely FREE, no registration needed, come join us and you will find the investing stock market advice you have been looking for. Now for the free advice we promised.

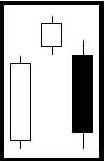
EVENING STAR
( Sankawa Yoi No Myojyo )

Evening Star

Description

The Evening Star pattern is a top reversal signal. It is exactly the opposite of the Morning Star signal. Like the planet Venice , the evening star, it foretells that darkness is about to set or that prices are going to go lower. It is formed after an obvious uptrend. It is made by a long white body occurring at the end of an uptrend., usually when the confidence has finally built up. The following day gaps up, yet the trading range remains small for the day. Again, this is the star of the formation. The third day is a black candle day and represents the fact that the bears have now seized control. That candle should consist of a closing that is at least halfway down the white candle of two days prior. The optimal Evening Star signal would have a gap before and after the star day.

Criteria

  1. The uptrend has been apparent.
  2. The body of the first candle is white, continuing the current trend. The second candle is an indecision formation.
  3. The third day shows evidence that the bears have stepped in. That candle should close at least halfway down the white candle.

Signal Enhancements

  1. The longer the white candle and the black candle, the more forceful the reversal.
  2. The more indecision that the star day illustrates, the better probabilities that a reversal will occur.
  3. A gap between the first day and the second day adds to the probability that a reversal is occurring.
  4. A gap before and after the star day is even more desirable. The magnitude, that the third day comes down into the white candle of the first day, indicates the strength of the reversal.

Pattern Psychology

A strong uptrend has been in effect. The buyers can’t imagine anything going wrong, they are piling in. However, it has now reached the prices where sellers start taking profits or think the price is fairly valued. The next day all the buying is being met with the selling, causing for a small trading range. The bulls get concerned and the bears start taking over. The third day is a large sell off day. If there is big volume during these days, it shows that the ownership has dramatically changed hands. The change of direction is immediately seen in the color of the bodies.

Training Tutorial

The Morning Star & Evening Star Signals  This 56 minute video provides a clear understanding for trading and maximizing your profits.

Candlestick Forum Flash Cards   These unique Flash Cards will allow you to be “trading like the Pro’s” in no time.
 
We hope you found this article helpful and encourage you to sign-up for our free newsletter. (sign-up box at the lower left side of your screen) We do not share our newsletter database with anyone, ever! We do not flood you with daily advertisements. Our newsletter provides timely market observations provided completely free of charge or obligation

Return to Candlestick Explanation of the Major Signals

Bad Commodity Trading

Bad commodity trading habits lead to bad commodity trading results. Beginning traders will often start with simulation trading and they will do great. When they switch to real time commodity trading the same folks who posted record profits in the simulation world will crash and burn. There are a number of reasons for on onset of bad commodity trading and these reasons are not just limited to beginners. Trading psychology has a lot to do with good habits turning into bad commodity trading habits. The old enemies of commodity trader, greed and fear, are not a problem when trading is not “for real” but raise their ugly heads at the thought of making or losing real money. To help avoid bad habits that lead to bad commodity trading it is useful to take Commodity and Futures Training. It is also very wise to learn, practice, and use the time honored technical analysis tools that made rice traders rich in ancient Japan. Candlestick basics originated over three hundred years ago and this very insightful, very visual system of following the commodity market can lead to very positive results. Using Candlestick charting techniques and Candlestick trading tactics can help the trader stay away from the bad habits that creep into the best commodity trading strategy.

Simulation or “paper” trading is basic to learning commodities trading, options tradingstock trading and the like. Trading software will have historical data that will allow the trader to work in “real life” trading situations. Using the time and psychological space afforded by these practice sessions the savvy trader will develop a sound trading strategy that can carry over to live commodity trading. Experienced traders will typically trade the same in simulated settings as they do in live trading. The trap that will lead inexperienced traders into bad commodity trading decisions is the impulse to “wing it” once in a live situation. Here is where the use of a tried and true set of technical indicators is necessary. Here is where learning the indicators and using them is critical. Use of Candlestick pattern formations to predict the commodities price movement has worked for over three centuries.

When the inexperienced trader enters into the real world of commodities trading is the time to apply what he or she has learned about the use of Candlestick analysis and not to forsake it. An excellent rule for a beginning trader to follow is that if you don’t understand the trade, don’t get into it. Commodity trading is not gambling. Because trading history repeats itself the use of Candlestick patterns gives the trader a very reasonable expectation of making a profit on a trade. What is required is the discipline to apply what is known at the right time. Using a well thought out trading strategy will lead to profits. Using the right tools to make a profit reinforces the use of the strategy. When the trader loses money on a trade when he or she did not expect to it is time to reevaluate trading strategies, not to wing in on the next trade. Practicing good trading habits leads to good commodity trading and letting fear and greed get in the way leads to bad commodity trading. Good trading goes with good management of investment risk. Setting limits and keeping track of both success and failure will lead to good long term results.


Market Direction

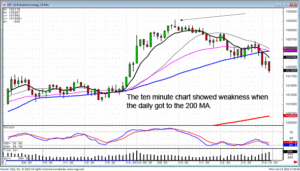
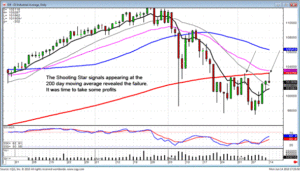
“Watch what it does when it gets to the next moving average!” This is the statement most often expressed when analyzing the charts on Monday and Thursday night training sessions. What is the significance of this statement? Prior to you learning candlestick signals, you might have had to wait a few days to see whether a resistance level was going to act as a resistance level or not. Most investors that do not have candlestick signal knowledge. That means they have to wait two or three days to see what is happening at a support or resistance level. Candlestick signals provide that same information instantly. As witnessed in todays trading, the Dow went up and touched the 200 day moving average, the suspected target, and then started fading back. This becomes a good of where and when to take profits.

Bad Commodity Trading, Dow

DOW

If a price move hits a potential target and does not seem to show enthusiasm about pushing through, take some profits, especially on charts that appear to be also showing a lack of enthusiasm. If the smart traders can see profit-taking going on at a resistance level, they will be taking some profits also. The worst-case scenario would be to buy back into positions where their charts showed strength and the indexes revealed they were coming back up through the resistance level. Once again, the advantage is still in the hands of the candlestick investor because they can identify what prices were actually doing at the resistance levels. This would both be applicable on the daily chart as well as seeing what was going on on the five minute chart or the 10 minute chart.

Bad Commodity Trading, Dow 10 minutes

Dow 10  min chart

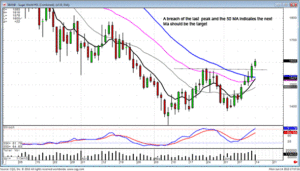
Candlestick formations reveal whether prices will resist or breakthrough a resistance level. If prices break through, there is a much different anticipation. As illustrated in our recommendation to buy July sugar today, the fact that the rounding bottom patterns broke out through the beginning of the pattern as well as the 50 day moving average at powerful implications. There was going to be more upside. What becomes the next potential target? The 200 day moving average! Will it get there in one move? Probably not, however knowing the price is probably in an uptrend, it now becomes much easier to anticipate what type of pattern setups might occur. There may be a J. hook pattern forming some time before the price gets to the 200 day moving average.

Bad Commodity Trading, Sugar

July Sugar

Candlestick signals provide an immense amount of common sense information. If you want to gain an advantage when you are investing, to trade without the knowledge of what the candlestick signals reveal is putting somebody else ahead of you. The candlestick investor is provided with a much easier trend analysis process when they understand what each signal represents and how to use them successfully with confirming indicators. The more information you can put into your analysis, the higher the probability you’ll be in a successful trade.

Chat session tonight 8 PM ET

Good Investing,
The Candlestick Forum Team


Current Website Specials

July 2010

2-Day- Training Webinars

Candlestick Technical Analysis Webinar – July 10 & 11

 Options Training Webinar – July 31st & August 1st

Ultimate Candlestick Training Package – ON SALE!

Click here for details

Website special reflects current newsletter. If you are reading an archived newsletter you will be directed to Current Website Special.


Technical Analysis and Japanese Candlesticks

Utilizing technical analysis is an important component of wise investing in various securities and can be done to any kind of security, including mutual funds, stocks, bonds, etc. When using technical analysis tools on a specific security, you are looking for price patterns, price fluctuations, and trends. Your ultimate objective is to figure out how you stand as an investor. In other words, should you sell or buy?

So, how is stock market technical analysis accomplished? There are several different methods. Some investors use technical indicators as part of their technical analysis process and others do their technical analysis by studying charts of a security’s past activity. The best investment advice regarding technical analysis is to use several different methods – comparing one against the other in a system of checks and balances.

There are several assumptions made when using the best technical analysis tools. A first assumption is that the past is a good indicator of the present. However, when dealing with the stock market, coming to this conclusion during technical analysis does not always lead you to profitable results. The other assumption is that all securities have a tendency to form stock chart patterns in their fluctuations. This is fine, and is often the case, but the market is often unstable because of stock volatility.

How then do you make use of the most important technical analysis tools? Why try it if they are not completely accurate? Well, even though they are not 100% accurate, you still stand a reasonable chance of analyzing correctly, depending on how thoroughly you were in your analysis using the methods you have chosen.

Therefore, fundamental and technical analysis methods offer a way to make educated choices when making new investments in securities and determining how to handle your current investments. So you can at least have confidence in knowing you did your absolute best, even though it isn’t a sure thing.

So who will do the technical analysis? Well, you can either hire people to perform the technical analysis or you can do it yourself. If you work with a company that helps manage your long term investing accounts, it’s a safe bet that they employ human resources to help analyze the market and gather data. Then they pass this information to their clients in an attempt to guide them in their investment options.

If you choose to do it yourself, using technical analysis with candlesticks, it could take a while to get the hang of it. Science and math are used to do the analysis, but many consider it an art. Although you can use formulas to give you a set of numbers, it is an “art” for that person to determine what the numbers actually mean.

Free Stock Picks Candlestick Signals Provide a Constant Supply

Free stock picks every day with candlestick signals.

Many investors search the Internet every day for free stock picks. This is a very unproductive practice. Finding free stock picks is like kissing your sister. It helps the situation right now but it is not going to get you anywhere in the long run. The best source of free stock picks  is being able to do your own candlestick signals scans. Once an investor learns and understands the  ramifications of the 12 major candlestick signals, they will have more free stock picks then can be utilized by most investors.

Searching for free stock picks does not provide a viable trading program. One source of free stock picks may have a completely different reason for entering positions than another source for free stock picks. If these positions do not perform as expected, there will be no game plan for when to enter the trades or  when to exit the trades. The candlestick signals have a well-defined set of parameters for when to get into a trade and to exit a trade. It is not only important to identify stock positions that have a probability of producing profits, but there needs to be an analysis for when to get out of a trade. Candlestick signals can be used as the building block for any investment program. If using free stock picks as a source for a viable trade, then applying candlestick signals to those price charts provides a huge advantage. The signals can illustrate the times to be entering and exiting those stock positions.

More importantly, an investor’s trading program should have a set of parameters that can be utilized continuously. The candlestick signals have provided very strong evidence through the centuries that they indicate where investor sentiment is reversing the trend. The 12 major signals will occur frequently enough to make them worthwhile indicators that can be utilized during any time frame. Whether intraday trading, using the one-minute, five-minute, and fifteen-minute chart combination, or investing longer-term using the daily/weekly/monthly chart combinations, the major signals will occur consistently at the trend reversals. Once signal scans are programmed into your charting software, viable reversal signals can be found every single day. The process for scanning 9900 trading entities each afternoon and finding the best trade potentials for the next day will take less than 15 minutes. On good days, 20, 30, or possibly 40 trade excellent possibilities will appear. On bad days, at least two or three excellent trade possibilities will occur. This now becomes your best source of free stock picks for finding the best stock picks. Your own source of picks  provides the format for analyzing why they should work and what would dictate coming back out of those trades.

Act now – The Candlestick Forum 12 major signals price special will be ending in the next few days. The 12 major signals are the core for understanding candlestick analysis. Learn these 12 major signals and you will have control of your own investment future for the rest of your life. Click here for details on the 12 major signals special Once you understand how to use the 12 major signals correctly, producing large profits in your account becomes a much easier process.

Portfolio Manager

Investment portfolio management is the process in which an investment portfolio is acquired and maintained. Items for a portfolio manager and client to consider when investing include the term of the investment, stock market trends, and underlying forces within market trends. There are three types of terms of investment including short-term, medium term, and long term goals. Short term investing will provide quick returns, with medium term investing providing steady returns, and of course long term investing which aims to provide long range returns. The portfolio manager must ensure that their client receives a good return on investment which is achieved through the building of a strong portfolio.

What exactly does a Portfolio Manager do?

One of the main tasks they complete regularly is to meet with their analysts to discuss market developments and the trends pertaining to current events. They constantly check the status of the financial markets and again must stay on stop of current events. They also make the ultimate decision on what securities to buy or sell and some of them even conduct interviews with the financial media.  It is also their responsibility to ensure their clients build and maintain portfolio diversification, to keep them from “keeping all of their eggs in one basket.”

What is the typical background for a Portfolio Manager?

Some backgrounds may include engineering, computer science, physics, or biology, and many also possess an MBA degree.  They must be strong in accounting, finance, and economics and many are previously research analysts beforehand. One thing is for sure, and that is that they must be very strong in money management and they must be very hard-working analytical individuals.

What are the different types of Portfolio Manager Positions?

There are three things that determine this. They include the investing style, the size of the fund, and the type of investment vehicle.  The investing style could include small or large cap specialties (i.e. small cap stocks), domestic or international fund investing, hedge fund techniques, or growth or value style of management.  The size of the fund also determines the type of portfolio manager because he or she could determine the asset allocation for a small independent fund or a large asset management institution. The type of investment vehicle can vary greatly from mutual fund investing, hedge fund investing, commodity investing, trust and pension funds, and high net-worth investment pools.

In addition to or instead of a live portfolio manager, an investor may also decide to manage his or her portfolio using portfolio management software. Some of the features offered by a tool of this fashion include real time prices, accounting methods, management of investment records, and the ability to track multiple portfolios. This type of software has many additional features and may be an investing strategy that works for you. Its purpose is to simplify the life of the successful trader and investor. The point in the end is for the investor to be able to see the records of what he has invested and how much money he made.

The job of a portfolio manager is not one that is easy, but is one that is very rewarding for those individuals who like a challenge in their every day job.  It also pays off very nice financially.

Don’t Get Enron’d – Candlesticks Can Protect Your Retirement, Traders World Magazine

Millions of Americans work for good, stable companies. So we think! Yet consider the twenty thousand plus employees who worked for Enron. In September 2001, the atmosphere in the Enron offices was not any different than what it had been for the previous five years, robust and vibrant. People were proud to work there. The management policies made the daily business environment a place people looked forward to every day.
Everything was great, no problems whatsoever.

The majority of the Wall Street analysts were recommending the stock. Top management was painting a rosy picture for the company’s future. New projects were being introduced. Money was flowing. The future looked great. Enron employees, like millions of other corporate employees around the world, were immersed in the day-to-day activities of the corporation. How could they have ever have known there was any trouble?

This could be the same description for thousands of corporations across the nation, across the world. So how does the individual employee protect himself or herself from the unthinkable? What precautions can be taken that will alert you to something not being right in your own company? Something that was not detected by the “diligent” Wall Street analysts, the scrutiny of professional accounting firms, the safeguards of your company’s management.

The odds of another Enron debacle could be extremely minute. But can you afford to lose your retirement money, can you afford to be hit by the same ramifications that thousand of ex-Enron employees are facing today? There was a simple tell-tale indicator that could have saved people’s retirement accounts. Japanese Candlestick charts.
If you are not familiar with Japanese Candlestick analysis, it will be worth your while to learn how to use the charts. It is simple, easy, and provides the Best Investment Advice . The visual illustration of what is happening in a company’s stock is clearly apparent on Candlestick charts. This simple yet accurate depiction of what is the cumulative sentiment of the investment community reveals valuable information. For the employee, it cuts to the chase as to whether investors are buying or selling the stock.

Japanese Candlestick signals are the result of hundreds of years of successful rice trading. Successful is really an understatement. The Honshu family refined the technique. Observing the highly accurate reversal signals not only made them wealthy, it made them legendary wealthy. Their influence is the basis of today’s Japanese investment philosophy, stemming from the observations derived in Candlestick analysis.

The basic function of investing is to make money. However, few investors develop a trading program that puts the probabilities in their favor. If searching for the “Golden Goose” of investment programs, the criteria would be simple; well researched, proven track record, and easy-to-identify reversal points.

All three of these elements are incorporated into Candlestick signals. Hundreds of years of rice trading resulted in the identification of high probability, profitable trades. Make one assumption. The signals would not be around today if it were not for one convincing result. PROFITS! Candlestick signals exist today because of hundred of years of actual profitable trades. Not computer back testing. Not questionable results. Profits produced from utilizing the signals are the only reason we are witnessing these signals today.

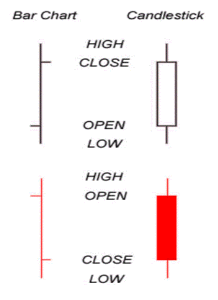
Reversal points were identified by rice traders using very simple charting techniques. You can take advantage of these clear, profitable signals. Japanese rice traders used the same information found on a standard bar chart. The difference is that they put more weight on the open and closing prices as well as the high and the low of a time period.

As illustrated in Figure 1, an open that is lower than the closing price creates a white candle. An open that is higher than the close creates a black candle. The positioning of these candles, with analysis of the colors of the candle, provides valuable information.

Candlestick Profits - Bar Chart Comparision

Bar Chart vs. Candlestick Chart

Learning how to use the signals correctly is now easy and can provide tremendous investment profits. Until recently, mastering the Candlestick technique had its drawbacks. First, there were very few places to go to learn how to use the signals effectively. That resulted in a lot of misinterpretation of the signals. This created a questioning of the effectiveness of the candlestick signal technique. However, websites such as www.candlestickforum.com provide investors with a learning forum as well as the exposure to different degrees of candlestick analysis. Trying to master approximately 40 signals has been the major deterrent for the methodology becoming overwhelming popular during the past couple of decades in the U.S. Fortunately, eight to ten of the signals will be responsible for 90% of the potential profits. This makes the learning process immensely easier.

Trying to decipher what is corporate Rah-Rah and what are true facts becomes difficult when one is right in the middle of the forest. Also, the amount of loyalty demonstrated to the company usually has an underlying impact in one’s career progress. However, maintaining one’s retirement security is a high priority. It is easier to accumulate your own company’s stock in your retirement account than trying to analyze alternatives. The company has been good to you. The stock price has been growing well. Owning the stock demonstrates your loyalty and dedication to the company. However, like all investment vehicles, your company stock can oscillate just like any other stock. There will be times when it is ahead of itself in price. There will be times that management makes mistakes in which direction to take the company’s growth. There will be times that the market in general is not favorable for being in any stocks.

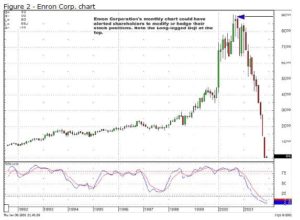
Japanese Candlesticks can act as a monitor for when an investor/employee should be accumulating stock or moving to other investments. Note in Figure 2, Enron’s monthly chart, that a long-legged Doji signified that the current uptrend was over. The corresponding stochastics indicated that the stock price was overbought and starting to curl down. This would have been an indicator for employees to lighten up on their stock position in their retirement accounts and temporarily diversify to other investments. Would the Candlestick charts have projected the magnitude of the stock price pullback? Of course not. But it would have alerted investors and employees to reduce their positions until the stock became oversold and a buy signal appeared.

Enron Chart
Enron

The rosy picture of Enron’s future did not correspond with what the rest of the investment community envisioned.
The situation with Enron has awakened the investment community to the pitfalls of Wall Street analysis, professional accounting, and management stop-gap procedures not always alerting investors of problems. It magnifies the need to be diversified. At worst, it alerts employees that some due diligence is required in their own company’s stock. Working there day in and day out doesn’t always ensure that the employees know everything that is going on. Having Candlestick knowledge is a tool that all investors should have in their arsenal.

Becoming familiar with Candlestick signals provides other powerful investment ramifications. The roaring bull market of the late 1990’s brought many inexperienced investors into the market. The huge growth of many 401k programs opened the eyes of people who had not invested previously. The “technology boom” created the illusion that everything was going up and always would. Investing in the stock market was a place to make easy money.

The late 1990 period was the first time in the history of the Dow that double digit growth occurred more that two years in a row. Unfortunately, the “technology” crash of 2001 more than took back the gains produced in the prior four years. New dynamics entered the market. The “Buy and Hold” investment strategy may have been severely compromised. The resulting changes permanently altered how investors should look at the markets. Those changes could produce huge profits for the Candlestick analyst.

During the mid-70’s to the early 80’s, the “Buy and Hold” philosophy was preached under the guise that the market was undervalued and would eventually move prices towards their true value. This was a period during which the U.S. economy was struggling. Interest rates went sky high. The Japanese auto manufacturers were producing much better product than the U.S. manufacturers. The U.S. manufacturing facilities were old. Modern plants in Europe and Asia were more efficient. New American industrial plants needed to be built to compete; yet the cost of money prohibited any new construction.

Slowly, technology started making U.S. manufacturers and service industries competitive again. The mid 80’s to the mid 90’s had an American economy that was again competitive in the world markets. Stock prices grew steadily. Technology was slowly being implemented into the production of American products. Quality increased, manufacturing costs were being controlled. Inflation was abated. The Dow moved from 1000 to 9000. The buy and hold strategy was a reasonable strategy.

Then in the mid 90’s, a duo dynamic developed. First, the availability of investor information became instantly available through the internet. The American public did not have to depend upon brokerage firms any more for their investment information. They could access the information and interpret it for themselves.

The “intelligent” analysis from stock brokers and investment analysts was not required. The common man not only did not need investment advice as it was doled out in the past, they could place their own transactions without exorbitant commissions through discount brokers. The once popular adage, “when the public is buying, it is time to sell” dissipated. It became evident that the average investor was capable of making intelligent choices. During some severe one-day market crashes, it was the institutions bailing out at the bottom and the general public buying the bargains.

“Buy and Hold” may not be effective for the next market environment. Technology, despite its current blemished reputation, makes Candlestick analysis a must for the next few years. Consider what we have witnessed during the past five years. The markets roared, led by technology stocks. Although they got ahead of themselves and came plummeting back down, an important message was delivered.

Up until five years ago, manufacturing pursued technology to develop new and innovative advances. When manufacturing needed to become more competitive, it went to research departments and companies to develop a better way to do things. However, a dynamic change occurred in the mid 90’s. Technology, with constantly improved computer tools, started to leap-frog on itself. Technological improvements for manufacturing, medicine, software, and the service industries started to advance in geometrical proportions. Improvements were being made on improvements before they could get it to production.

Having knowledge about Candlestick signals now becomes more vital to investor’s performance. Sector stock trends may not have the long growth cycles any more. It will become important to observe where and when funds are flowing to particular industries. This is the valuable aspect that Candlestick signals present to the investment community.

Because technology stock prices are greatly reduced from their recent lofty heights does not mean that the results of the technology that each company produced is diminished. The speed to which new technology processes can change the face of an industry has not been abated. Technology is now pulling industry along versus industry having to push for better technology. It will be important to follow when each company has great growth potential and when new technology being introduced to a competitor can stop that growth rate. Fortunately, Candlestick analysis easily identifies when the buyers and sellers are coming into a stock price. Instead of one or two years or more of a leader of an industry being able to maintain their leadership position, technology may compress leadership positions into a six month to a one-year time frame.

Investment cycles may become relatively short. The buy and hold method could provide low returns in the future. Holding a stock that goes up 25% in six months, then back down to even over the next six months does not add any value to an investor’s portfolio. The best investment program in this technology-stimulated market may be to take profits after three, six, or nine months.

Candlestick charts are a great way to enhance returns for the fundamental research investors. Being the best research analyst in the world does not do any good if it requires sitting in a stock months or years before the rest of the market takes notice of what your analysis discovered.

The Candlestick signals provide fundamental research analysts with two valuable functions. First, they develop a platform for the most effective timing to enter a position. Fundamental research can prepare an investor to be ready for good things to come in a particular company. Candlestick charts provide the mechanism for maximizing returns, entering and exiting positions at the exact times. Returns on managed money can be greatly enhanced utilizing Candlestick signals.

Second, established positions can be better protected by monitoring the Candlestick charts. Once a company has been researched and a position has been put in place, a strong candlestick “sell” signal can warn investors that a severe change may have occurred in the fundamentals of a company. It would allow for a quick review of the company’s operations to see if a change of status had occurred. As in the Enron situation, all the good news from the company was not verified by the accumulative action of investment community thinking. The charts showed selling. Something did not match.

Candlestick signals have been around for hundreds of years. They were introduced into the U.S. investment community twenty–five years ago. New teaching methods are making candlestick signals very easy to learn and use. Whether to use them as a high profit investment program or to use them for monitoring your existing portfolio, every investor should utilize the powerful aspects incorporated in the signals. Being able to see what stocks are doing versus relying upon what “the professional sources” are telling you, could keep you from ending up with a worthless retirement plan some day.

Bull Call Spread – Bullish Options Trading Strategy

A “bull call spread” is the term for one of several stock option trading strategies. The bull call spread occurs when a modest increase in the price of the asset is expected. It is achieved by purchasing call options at a specific strike price while also selling the same number of calls of the same asset and expiration date but at a higher strike. The maximum profit in this strategy is the difference between the strike prices of the long and short options, less the net cost of options. Most of the time, a bull call spread is a vertical spread.

A bull call spread is a simple technique within the best option trading system. The bottom line of a bull call spread is that the investor is able to buy a stock at a lower price and in turn, sell at a higher price, thereby making a profit. In such a case, the stocks belong to the same company, but have different strike prices.  This allows the wise investor to realize a profit by leveraging the varied strike prices against actual price of the stock.

For this example of a bull call spread, assume that a stock is trading at $28 and an investor has purchased one call option with a strike price of $30 and sold one call option with a strike price of $35. If the price of the stock jumps up to $45, the investor must provide 100 shares to the buyer of the short call at $35. This is where the purchased call option allows the trader to buy the shares at $30 and sell them for $35, rather than buying the shares at the market price of $45 and selling them for a loss. A bull call spread is used by successful traders to create a profit when a loss seems inevitable.

There are several factors to consider when utilizing a bull call spread.  It is imperative to follow a well-designed stock trading plan and avoid the emotions of greed and fear. While this is a profitable technique, the bull call spread involves strike and call prices, as well as the typical monitoring of stock prices to be familiar with their movements. The easiest way to create a bull spread is to use a call option at, or near, the current market price. When buying the lower priced call and selling a higher priced one, a bull call spread has been created.

As with any technique in successful trading, the investor is obligated to do his, or her, part. It is necessary to perform stock technical analysis in order to understand the stability of the stock being purchased. It is also important to have a successful stock trading system such as candlestick chart analysis. While such a technique is a low-risk maneuver, even a beginner investing in options can be well equipped to negotiate a bull call spread. 
Sometimes the difference between great traders and average traders are their instincts as well as their understanding stock market basics. A modest gain is always better than the most thrilling loss.


Return to main Options Trading Category

Buy Strangle – Breakout Options Trading Strategy

In times when there is low stock volatility and a large, unpredictable breakout move is expected, a successful trader might consider making a strangle buy. A strangle buy is implemented by purchasing a call option and a put option on the same asset with the same strike price and expiration date. Because the stock is poised for a breakout but the direction isn’t known, buying a strangle can be an excellent stock market strategy.

Buy Strangle affords the investor a limited investment risk, while offering an unlimited profit potential on a major move up or down. In such a strategy, the potential loss is limited to the premiums paid for the call and the put, as well as commissions. It is very similar to a Buy Straddle, except that the investor is purchasing options that are out of the money, which makes the potential loss smaller because the options are less expensive to purchase. A major move in either direction allows the investor to sell the opposite option and ride the one making the money, thus resulting in highly successful trading.

When technical analysis with Candlesticks indicates that a stock is trading in a triangle pattern, it is a prime target for a Buy Strangle. Frequently, with these types of stock chart patterns, an explosive move occurs near the tip of the triangle but the direction of the move is not readily known. Since the call and the put cover both directions of movement, a reward is quickly realized in this maneuver. Once the direction is known, the other option is liquidated and the investor can ride the trend. At this point, it is important not to ride the trend too long since time decay works against the trade in this position.

When Buying a Strangle, the put and the call options that are purchased are out-of-the-money. After identifying a triangle trading pattern with a tightening trading range, a position is initiated near the tip of the triangle. Because stock volatility is low, the options will be cheaper before a breakout occurs. Since this technique requires buying both a put and a call, buying before the spike is even more important. Strangle Buying has excellent risk reward ratios since the actual investment risk is limited and the reward is potentially unlimited.

As with all stock option trading strategies, there is risk, though limited, in a Strangle Buy. The actual purchase will be more costly since both a put and a call are being purchased on the same option. If the option fails to break out before the expiration date of the call and put, the trader will lose money on the purchases. Decay is also a factor working against a Buy Strangle, but it is eliminated by initiating a position before the breakout and quickly selling the option on the wrong side.

A Buy Strangle is an excellent tool to use in a stable market when technical analysis tools indicate that a stock is ready to break out of a triangle trading pattern. In such a case, the trading range is very tight and the stock is likely to make an explosive move. A Buy Strangles is one of several investment options that creates the potential for significant gains with limited risk of investment.


Return to main Options Trading Category

Commodity Charts – Reading The Signs

Do you watch late-night TV? If you do it is likely that you have seen the ads. A man or woman is dressed in mystical-looking clothes and talking about things like “unlocking your future” or “revealing the secrets of the universe” to you. All you have to do is call the number on your TV screen and pay $4.99 per minute and they will tell you what you need to know. Although it lacks the mysticism, commodity trading can be the same. Thanks to the use of commodity charts, you can reveal some of the secrets of futures trading and you don’t even have to wear the silly robes to do it!

Why Do You Need Commodity Charts?

Commodity charts are a valuable way of monitoring changes in commodities trading. They really represent a quick summary of all your research. By looking at a commodity chart you can see what has occurred over the period of time you are reviewing. Much of understanding trading and investing means that you see what has happened and how those past events can affect what is going to happen in the future. Commodity charts give you that snapshot in time and form a basis for evaluating future movements.

Reasons For Using Commodity Charts

There are three basic reasons to use commodity trading charts. These reasons include analyzing the past, understanding the present and predicting the future. Each one is an important part of commodity investing and can help you do a better job of it.

Commodity Charts For Analyzing The Past

This probably seems like the most obvious use of commodity charts. Each day you record the movements of your commodities: the high and low prices, the opening and closing prices and whether the commodity ended up or down. If you are using Japanese Candlesticks, this is all part of what is called the “real body” of the symbol. Each day that you record this information gives you more information about what has happened with a particular commodity. Commodity charts can help you analyze the past because you can look at a large selection of days and see the trends as they happened, allowing you to draw conclusions about the past.

Commodity Charts For Understanding The Present

What happened yesterday and what is happening today on your commodity chart? The current activity has the most effect on your commodity investing today. If you buy or sell today, these are the prices you will get, not last month’s price or next month’s price. In addition, today’s activity is built on the shoulders of the past so today’s commodity chart always includes more information than yesterday’s. Trading commodities is today’s event.

Commodity Charts For Predicting The Future

If trading commodities is today’s event, why do we even need to a commodity chart for the future? Commodity trading is for today but futures trading is for tomorrow. That’s why we need commodity charts for predicting the future. Futures trading is a speculation about the direction a commodity will take at a later date. Futures contracts are profitable when a trader correctly predicts the movement of a  commodity. This is where a system like Candlesticks is so valuable. Candlestick chart analysis allows a trader to view current and past activity and use that information along with the formations that they create to predict what  will happen with a commodity. If you  know what is going to happen, you can make plans to profit from the upcoming event. Candlestick charting gives you that ability.

Conclusion

Commodity charts are relevant for the past,  present and future. An investor that makes  good use of these charts can “reveal the secrets of the universe” find profits  in the commodities markets.