Archives for October 2019

Sell Straddle – Neutral Options Trading Strategy

When the market has just made a dramatic move and it is expected to consolidate, a possible stock option trading strategy to implement is to sell a straddle. This technique involves selling a call option and a put option on the same asset with the same price and expiration date. The result is a known, albeit limited gain and the danger is unlimited risk. Selling a straddle requires extreme caution and constant monitoring of the position, and the investor must be confident of his, or her, assumptions on the direction of the stock. A Sell Straddle is definitely not recommended for all investors; the risk reward ratio is not favorable to anyone but the most vigilant trader.

In a Sell Straddle, the risk is truly unlimited. The gain is composed of the premium that is received for selling the call option and the put option, minus any commissions. In most cases, when selling a straddle, the put and call that are sold on options that are over priced and at-the-money or close to it. This is done in response to a dramatic move that has occurred, when the expectation is that the market will consolidate and absorb its gains before moving again. Since the market is extremely volatile, the cost of the options is very high. When the market does consolidate, stock volatility will decrease and lower the price of the options, increasing the profits when the investor buys back the options at a lower price to close the position. With a Sell Straddle, decay also works in favor of the investor. While this is a somewhat complex transaction, a Sell Straddle is an excellent stock market strategy for an experienced trader.

A Sell Straddle requires that the investor monitor the position for unfavorable movement and, if necessary, buy back one of the options if there is any indication that the market will resume its trend or reverse direction. If there is an indication that the market will trend up, the trader should buy back the call; if the market appears to be trending down, the trader should buy back the put.

As with any transaction, it is important that the trader do technical analysis with Candlesticks. This trading system will help the investor to understand the movements in the market before attempting to enter a Sell Straddle. By using a stock trading system like Japanese Candlesticks, a trader can not only identify the mood of the market, but identify a stock poised for an implementation of a strategy like a Sell Straddle. The charting ability of Candlesticks is perfect for options research and the investor can be move with confidence using this system.

While a Sell Straddle isn’t recommended for all traders, it is one of the investment options that can create profits for a savvy investor. Using a tested stock trading plan, good fundamental and technical analysis skills, and a system such as Japanese Candlesticks, a trader will find this strategy to not only be a benefit to the bottom line, but also a skill to know, and implement, in the future.

Return to main Options Trading Category

Stock Investing For Dummies – Learn Quickly With Candlestick Signals

Everybody at one time or another feels like they need ‘Stock Investing for Dummies.’ Some investors go for years and years listening to advice from the next professional adviser that they hope will do better than the previous one. This is usually the process of stock investing for dummies, a constant search for somebody that can help an investor make money in their account.

If an investor wants to get out of the cycle of feeling that they need the ‘Golden Goose’ course that teaches stock investing for dummies, the process is very simple. Learn a trading method that works. Does it have to constantly work? No, but the idea is to find a trading method that puts the probabilities in the investor’s favor. Without remaining with a consistent trading program, when things aren’t working, a trading program should be able to be analyzed. When something’s broken, it can be fixed. Moving to another trading program when things aren’t working never allows an investor to understand what was wrong and what needed to be fixed. Candlestick charts analysis is the common-sense utilization of proven investment techniques. Learn how to invest properly using high-probability signals and your investment acumen will be improved for the remainder of your investment career.

Gap-up Stock Trading – The emphasis has been put on gap-up stock trading for the past few weeks during the Monday night and Thursday night chat sessions. The reason for educating investors on gap-up stock trading is simple. Gap-up stock trading, after the appearance of a bullish Candlestick signal, produces extremely high probability, high profit trades. Utilizing Candlestick analysis to interpret a gap-up is relatively simple. Investors want to get into a position with great enthusiasm.

Witnessing a Candlestick buy signal in oversold conditions illustrates a change of investor sentiment. Witnessing a gap-up in price, after the bullish signal, illustrates that not only has the investor sentiment changed, it has changed with great strength. Finding a trade that has shown a reversal and a new trend starting with great fervor is exactly what investor should be looking for.

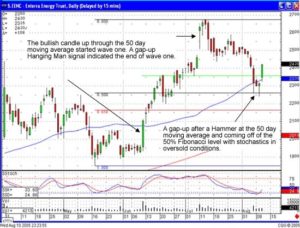
Applying all of the indicators that reveal a high probability reversal is the first step for a finding a high profit trade. Those indicators, followed by a gap-up, demonstrate an additional reason for committing investment funds. EENC is an example of a chart that has all of the indicators in alignment.

Gap-up Stock Trading Example
A quick evaluation can be made visually. The most important indicator is the formation of a potential Candlestick buy signal, a Hammer signal. A Hammer signal is formed with the stochastics in the oversold area, starting to curl up. That becomes the criteria for analyzing whether this chart pattern has a high profit scenario.

The 50 day moving average becomes an important factor. Visually, it can be analyzed that the bullish candle breakout of early June was the beginning of an uptrend. It breached the 50 day moving average. The uptrend continued with relatively good strength until the appearance of a gap-up at the top. A Hanging Man formation appeared, indicating that the top was close at hand. The pullback came right back to the 50 day moving average as the stochastics came into the oversold condition.

The pullback coincides with the 50% retracement of the Fibonacci numbers. A wave one move appeared from early June until early July. A potential wave two pulled back to the 50 day moving average. A strong buy signal has now occurred, possibly starting wave three. Wave three usually has the same magnitude move as wave one. $29 to $30 now becomes the next potential target.

Once the eye becomes trained to identify high profit trades, the analysis of this chart becomes almost instantaneous. The signal created during the last couple of days warrants investigating the chart pattern further. The remaining criteria can be evaluated in less than a minute. Learning the parameters that create high profit trade situations becomes relatively easy. Having the capability of identifying high profit signals eliminates the need for ?stock trading for dummies.?

Commodity Investing and Tax Benefits

With tax season just passed, you may still be hurting from the results. If you requested an extension and haven’t filed yet, this topic might be very helpful to you. Aside from the profit potential that you can realize from trading commodities, there are handsome tax benefits as well. The current tax laws separate investment gains and losses into two expansive groups: short-term capital gains and long-term capital gains. This feature is nice because when you are commodity investing, you are allowed to split your profits between the two categories.

To understand the tax benefits of commodity trading, there are a couple of things to learn. Grab the statements from your commodity account and a calculator, and start a spreadsheet; this is quick and fairly easy to grasp. Here are the things you need to do:

  1. Understand what short-term capital gains are. Profits from any commodity trade that is held for less than one year are considered short-term capital gains. Short-term capital gains are taxed at the investor’s normal tax rate; if you are in the 25% bracket, your short-term gains will be taxed at 25%.
  2. Understand what long-term capital gains are. Commodity trades that are held for more than one calendar year are long-term capital gains. Long-term capital gains are taxed at a flat rate of 15% unless you are in the ten percent or fifteen percent brackets and then long-term capital gains are taxed at 5%. For those people who are holding long-term futures contracts, this is obviously a very attractive situation.
  3. Add up your profits and losses. This is where you can use your calculator (or your computer if you have some spreadsheet skills). For each transaction you made while commodities trading, enter the amount of profit you made as a positive number and the amount of loss you had as a negative number. For example, imagine that you made three commodity trades; you earned $500 on the first, lost $300 on the second and made $1,000 on the third. To calculate your profits, add the numbers together. $500 – $300 + $1,000 = $1,200; $1,200 would be your profit for the year.
  4. Determine your long-term capital gains. For this calculation, take the total number and multiply it by sixty percent. For our example, $1,200 x 0.60 = $720; this is your long-term capital gains on your commodity investing. Now you need to multiply this number by the 15 percent tax rate; $720 x 0.15 = $108. This will be the long-term capital gains tax responsibility on your commodity long-term investing.
  5. Determine your short-term capital gains. For this calculation, take the total number and multiply it by forty percent. For our example, $1,200 x 0.40 = $480; this is your short-term capital gains for your commodity investment strategies. Now you need to multiply this number by the 25 percent tax rate (For this example we’ll assume this is your rate but we hope it is higher!); $480 x 0.25 = $120. This becomes your short-term capital gains tax responsibility on your commodity investments.
  6. Add the two together. Once you add the short and long-term tax numbers together, you have calculated your tax liability for your commodity trading. $108 + $120 = $228.
  7. Review your savings. In order to see your savings, multiply your total profit for the year by your tax rate and then subtract your actual tax responsibility from this number. (Remember that we assumed you were in the 25% bracket.) $1,200 x 0.25 = $300; this would have been your liability. $300 – $228 = $72. While on the surface this doesn’t seem like a lot but it is actually a 24% reduction in your tax burden for the money you made! 24% can make anyone?s investment philosophy look pretty smart!

Conclusion

Because of the method for computing capital gains, commodity investing can be very beneficial from a tax standpoint. Since futures contracts are taxed at a split rate, 60 percent of your earnings from commodity investments are taxed at the long-term capital gains rate and only 40 percent is taxed at the short-term capital gains rate. This is called the 60/40 tax treatment, and it will save you money in taxes. As always you should consult your tax advisor but you will likely be very pleased with your returns!

Commodity Trading Course Not Required with Candlestick Signals

commodity trading course is not needed when utilizing candlestick signals. What can be taught in a commodity trading course? An investor only needs to understand what makes commodity prices move up or down. Candlestick signals clearly demonstrate when prices are going higher, or going lower. A commodity trading course can not provide a platform for analyzing what prices are going to do. What makes commodity prices move? Supply and demand! A commodity trading course will not be able to produce the insights to trade successfully. Candlestick signals produce the format for detecting changes in investor sentiment.

Where do investors learn how to trade commodities? There is not a commodity trading course available in institutions of higher learning. An investor needs a platform for detecting when to buy and when to sell. The Japanese Rice traders developed the most basic and accurate method for producing high profits in commodity trading. They traded the most basic of commodities, Rice. The information that is conveyed in a candlestick signal is much more important than trying to analyze the fundamental conditions of a commodity price. The big money, ‘smart money,’ can be seen establishing their positions based upon what the candlestick signal formations reveal.

Utilize the simple information that is conveyed in a candlestick signal. Each signal has been analyzed for hundreds of years. Not only does that analysis include visual recognition of a reversal in a commodity price trend, the Japanese Rice traders were able to evaluate what the investor sentiment was doing to create the reversal signal. Learn to use the candlestick signals correctly and understand the information that each signal provides and you will have a huge investment advantage. This is not difficult analysis. Each candlestick signal illustrates what investors were thinking at important reversal points. When this knowledge can be seen in a graphic formation, the probabilities of being in the correct trade at the correct time increases dramatically.

This week’s featured Candlestick Pattern –

Breakaway Bearish and Bullish

The Breakaway Pattern

Description

If  a trend has been evident, the breakaway pattern, whether bullish or bearish initially indicates the acceleration of that trend. The pattern starts with a long candle representing the current trend. The next candle gaps away from the long candle with the color of that candle the same as the long candle. The third day can be either color. It will not show a change in the trend. The fourth day continues the trend, having the same color as the trend. The fifth day reverses the trend. It opens slightly opposite of the way the trend has been running. From there, it continues in the same direction to where it closes in the gap area.
 
Criteria

  1. The first day is a long-body day  has the color of the existing trend.
  2. The second day gaps away from the previous close. It has the same color as the first day candle.
  3. Day three and four have closes that continue the trend.
  4. The last day is an opposite color day that closes in the gap area between day one and day two.

Pattern Psychology

After a trend, usually in an overbought or oversold area,  a  long candle forms. The next day they gap the price further. That day has the same color as the trend. For the next two days, the bulls and/or bears keep the trend going in the same direction, but with less conviction. The final day, the move goes opposite the existing trend with enough force to close in the gap area between day one and day two. This day completely erases the move of the previous three days.

Market Trend Analysis with Candlestick Signals

Analyzing the market trend is the first step for deciding the portfolio allocation. Candlestick signals make that analysis relatively simple. The same analysis involved in individual stocks can be applied to the market indexes in general. This is not a difficult process. Investor sentiment is illustrated in market index charts the same as they are in individual charts. Which direction is the overall trend? Applying the analysis with candlestick signals to both the Dow and the NASDAQ provide a tremendous insight during a market trend analysis.

In any analyze, the candlestick signals are indicating at important technical levels produces a huge advantage for the candlestick investor. At technical levels such as trend lines or moving averages, having the ability to see exactly what investor sentiment is doing at those levels produces low risk entry and exit strategies. A major reversal signal forming right on a resistance level or a support level creates the opportunity to get into a trade at the optimal price level.

Entering a trade just as investor sentiment is reversing creates low risk stop loss procedures. If a candlestick buy signal is occurring at a major support level, a trend line, a recent previous low, or a major moving average, the stop loss analysis becomes relatively simple. Once the position is established based upon a candlestick signal at a major support level, the stop loss can be established at the point that negates the buy signal. Because the position can be established very early in the reversal cycle, the loss potential becomes very small. This establishes the investment strategy of being able to cut losses short. Review the training tutorial on Trend Analysis; the very same procedures Stephen Bigalow uses each day for analyzing the market trend.

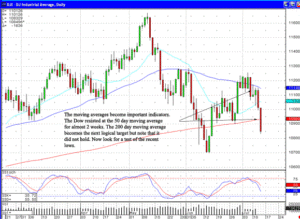
Market direction – The moving averages have become an important factor in the price direction of the Dow. As illustrated last week, the trading at the 50 day moving average revealed great indecision. A bullish day followed by a bearish day, followed by a bullish day, followed by a bearish day. The large bearish candle last week in the Dow finally revealed which way the investor sentiment had turned.

Notice after three days of weakness, the 20 day moving average acted as a temporary support. For the aggressive trader, analyzing what type of signal was occurring on the one minute and five minute charts just as prices reached the 20 day moving average would have allowed for some short covering or some very quick long trades. However, the major moving averages, the 50 day moving average and the 200 day moving average still should be the important levels for trend analysis.

Market Trend Analysis, DOW

DOW

The 50 day moving average acted as the obvious resistance level for most of the prior two weeks of trading. The failure of that level meant the 200 day moving average would be the next likely support level. The important word in that statement is “likely.” As can be witnessed in Thursday’s trading, the 200 day moving average did not appear to act as any support. Stochastics still being in a downward direction make a lower target likely. The recent lows in June become the next likely target. Or the 500 day moving average might now come into play. Whenever an obvious technical level is breached, the level that everybody else was likely to be watching, then start looking for what would be the next likely target.

If both indexes are showing no obvious potential reversal signals, then the current trend is likely to continue until something changes overall investor sentiment. Although the NASDAQ chart is indicating that the stochastics are getting toward the oversold area, nothing yet has revealed that the investor sentiment is changing. This is not a difficult process for analyzing market trends. The Japanese Rice traders say to let the market tell you what the market is doing.

Candlestick Profits – Still Untapped, Stocks & Commodities Magazine

Misunderstood. That can be the only explanation for Japanese Candlesticks, the most proven investment technique in history, to be so underutilized. This technique has been exposed to the U.S. investment community for approximately twenty-five years. Yet it is only recently that interest has picked up in this highly accurate investment technique. The investor who takes the minimal time and effort to master candlesticks will reap inordinate profits. This is not an empty promise. Basic analysis of Japanese Candlesticks produce a couple of irrefutable conclusions.

A candlestick signal formation has a major aspect that makes it more powerful than all other technical analysis. The signal is the result of a change in investor sentiment. This statement will be repeated for effect. The signal is the result of a change in investor sentiment. Not the anticipation of a possible change! The actual result is the change of trend direction. Having this tool in an investor’s arsenal can dramatically change an investor’s ability to maximize profits while reducing risk exposure. It allows the average man/woman on the street to invest with the same temperament as the professional trader.

Buy at the bottom, sell at the top. Pretty easy, right? Yet where does one grab the falling knife? When is high too high? Candlestick signals alleviate that problem. A candlestick buy signal, appearing after an extensive decline in a stock price (all trading entities can be effectively analyzed with candlesticks. The term “stock” will represent all trading entities) reveals compelling information. This information inherently benefits investors, making for comfortable trading decisions.

The basic function of investing is to make money. However, few investors develop a trading program that put the probabilities in their favor. If searching for the “Golden Goose” of investment programs, the criteria would be simple; well researched, proven track record, and easy-to-identify reversal points.

All three of these elements are incorporated into Candlestick signals. Hundreds of years of rice trading resulted in the identification of high probability profitable trades. Make one assumption. The signals would not be around today if it were not for one convincing result. PROFITS! Today’s Candlestick signals exist today because of hundreds of years of actual profitable trades. Not computer back testing. Not questionable results. Profits produced from utilizing the signals are the only reason we are witnessing these signals today. Reversal points were identified by rice traders using very simple charting techniques. You can take advantage of these clear profitable signals!

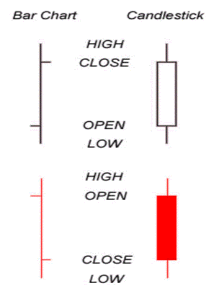
Japanese rice traders used the same information found on a standard bar chart. The difference is that they put more weight on the open and closing prices as well as the high and the low of a time period. As illustrated in Figure 1, an open that is lower than the closing price creates a white candle. An open that is higher than the close creates a black candle. The positioning of these candles, with analysis of the colors of the candle, provides valuable information.

Candlestick Profits - Bar Chart Comparision

Bar Chart vs. Candlestick Chart

Until recently, mastering the Candlestick technique had its drawbacks. First, there were very few places to go to learn how to use the signals effectively. That resulted in a lot of misinterpretation of the signals. This misinterpretation created a questioning of the effectiveness of the candlestick signal technique. However, websites such as www.candlestickforum.com provide investors with a learning forum as well as the exposure to different degrees of candlestick analysis. Learning how to use the signals correctly is now easy and can provide tremendous investment profits.

Utilizing the Candlestick technique produces two powerful investment considerations. First, the demise of most investors is that great bugaboo – Emotion. Exploiting fear and greed created by the masses is the biggest contribution to professional investor’s profits. Japanese Candlestick trading eliminates emotional investing. Due to the fact that the signal is the visual depiction of investor sentiment and graphically illustrates a change, the candlestick investor becomes knowledgeable about when the masses are creating a profitable opportunity. Most investors panic at the bottom. And they get over-exuberant at the tops. Knowing this and visually seeing it happen forces the Candlestick investor to buy when the buy signal is formed at the bottom. They sell when they see the sell signal at the top. Did you ever wonder when people were panic selling, with blood flowing in the streets, who was buying? Or when the news on a company was so wonderful, who was selling to everyone piling into a stock at the top?

Secondly, the Candlestick signals have an additional powerful aspect not found in other techniques. Not only did the Japanese rice traders identify high profit reversal signals, they added another overwhelming aspect to candlestick analysis. They proceeded to interpret what investors were thinking when forming a signal. This process alone institutes dynamics that put candlestick analysis light years ahead of any other trading technique. Remarkably, what should be considered a highly sophisticated program, is merely the accumulation of common sense observations. This makes understanding candlestick analysis very easy to learn. Yet it provides insights that revolutionize most investor’s decision-making processes.

The “technology stock” bull market and crash is still fresh in everybody’s mind. The exuberance was so great that most investors didn’t know when the top was hit. Having the indexes graphically depicted by candlesticks provided a platform for knowing when to take profits and/or shorting stock. Note in Figure 2, a Shooting Star formed at the top of the Nasdaq market. A candlestick investor, upon witnessing a Shooting Star, (a Shooting Star is a formation where the open and the close are at or very near to each other at the lower one-third of the daily trading range – it illustrates that the buyers and the sellers are indecisive) at the top of a major move, would have been immediately alerted that a top was imminent.

Note that a couple of weeks later, the Nasdaq tried to make a run for another new high. However, another weak candlestick signal, a Doji, occurred prior to the move making a new high, demonstrating that the buyers were running out of steam. This would have been an opportune time to liquidate all positions.

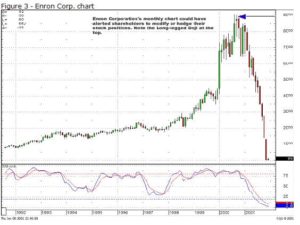
Using the signals, whether day-trading, swing trading, or long term investing, provides a method to identify when the buyers are making a presence and when the sellers are stepping in. Even the fundamental investor can effectively use candlestick signals to protect their positions. A sell signal appearing in a stock position can give the fundamental investor an alert that something might be changing. Revisiting the fundamentals of that company may be warranted. Using the candlestick method of thinking, shareholders of Enron Corporation could have greatly modified their positioning upon viewing the candlestick chart.

Candlestick Profits, Enron

Enron

Enron Corporation’s long term chart showed signs of a pullback. The magnitude could not be anticipated, but employee retirement plans could have been modified.

Making a basic assumption, that signals have a high degree of accuracy, puts the probabilities immensely in the Candlestick investor’s favor. Adding simple confirming parameters also enhances the degree of accuracy. There are approximately 40 signals. Fortunately only eight to ten are more than the average investor needs to learn to be highly successful at investing. The frequency and consistency of these “Major” signals will produce more trading opportunities than most investors require. Easy-to-use search programs can identify a dozen highly profitable trades each day. Any investor with ten minutes of subjective analysis can fine-tune those stocks to find which position or positions are the highest probable trades.

Using the Candlestick technique provides the format for developing inordinately profitable programs. The definition of inordinate will range with the amount of time each investor can contribute to investing each day. Achieving returns of 10% to 40% monthly is not out of the realm of comfortable investing. Having a high degree of confidence in a trading entity’s direction creates many opportunities to maximize profits. Short-term traders can go long or short. Long-term investors can exploit short-term pull-backs by writing options against their positions. Relying upon brokerage firms ho-hum recommendations becomes less vital. Investors can now control the results of their own investments.

The prime aspect that allows investors to amass wealth using candlestick formations reverts to one basic element. Probabilities. Visually recognizing a pattern having a high degree of probability of changing the direction of a trend, immensely increases the investors ability to amass huge profits. To not take advantage of the knowledge incorporated in the signals is to leave an immense amount of wealth on the table. Mastering Candlestick signals and the ramifications that are built into the signals is not difficult. Having the most researched investment technique in the world provides the structure for revolutionizing investor thinking. Knowing how the signals are formed by the masses providing fear and greed opportunities, allows the Candlestick investor to take advantage of a constant supply of high profit situations. Learn to be the buyer when everybody is panic selling. Take two weeks of your life to master a technique that will forever improve your investment abilities. The concepts incorporated by the signals are those that traders are currently using to accumulate huge profits for major brokerage firms. You can participate in those profits.

Stephen W. Bigalow is author of “Profitable Candlestick Investing, Pinpointing Market Turns to Maximize Profits” and principal of www.candlestickforum.com, the leading website on the Internet for providing information and educational material about Japanese Candlestick investing. Over fifteen years of extensive study and utilization of candlestick analysis has produced an array of easy-to-learn educational material about Candlesticks. As one of the leading Candlestick experts in the nation, Mr. Bigalow, through his consulting with major trading firms, has developed multiple successful trading programs for the day-trader to the long-term hold investor.

Successful Trading System

What constitutes a successful trading system? Certainly a successful trading system is one that results in profits in trading stocks, trading commodities, trading futures and trading options. A stock trading system at its most basic is a set of rules, an algorithm, for deciding when to buy stock, sell stock, or sell short. A successful trading system can be applied to stocks, options, commodities and futures. A basic stock trading system is based upon technical analysis of stock prices and provides buy or sell signals. There are lots of trading systems. A truly successful trading system such as Candlestick analysis stands the test of time. Japanese Candlestick basics have been around since the days of the Samurai in Japan. Although rice traders in ancient Japan were fully aware of the fundamentals that drove rice prices, such as a good harvest, a drought, war, etc., they also learned that price patterns repeated themselves. By identifying these patterns and learning what the pattern was likely to indicate, traders developed Candlestick signals such as the Doji Candlestick which is a strong indicator of market indecision and predicts the reversal both upward and downward market trends.

A successful trading system must be one that the trader can use effectively in stock tradingcommodity trading or trading derivatives. A distinct advantage of Candlestick charts is that they are easy to read. Candlestick stock charts display the same information as other, more difficult to read, charting methods. However, Candlestick signals distill the same essential information into each signal without displaying complicated, statistics that take valuable time to read. No matter how accurate a trading system is the system must be functional in the rapid paced world of day trading stocks, commodities, and derivatives.

A broader view of a successful trading system includes time management, management of investment risk, choice of trading hardware, choice of online trading software, and routine reviews of trading results. In a successful trading system picking stocks that are routinely profitable to trade may be just as important as skill in technical analysis of stocks. Exerting discipline in executing trades according to a pre-determined trading strategy is as important as setting up the strategy. Traders who maintain discipline and use an efficient tool such as Candlestick pattern formations to analyze the market will commonly have a successful trading system. By using Candlestick signals in day trading or in long term investing it is possible to profit from buying at the bottom of a price curve, from anticipation of market reversal, and from the market volatility that often follows sudden changes in stock fundamentals. And, although it is not the most glamorous aspect of successful stock trading, routine analysis of trading results leads to profitable modifications of trading systems and increased long term profits. No matter how skillful a trader is at fundamental and technical analysis he can always improve. By evaluating each Candlestick trade after the fact a trader can commonly improve his use of the system and his profits leading to an increasingly successful trading system.


Market Direction

Washington was able to resolve the debt crisis! So that is at least what Washington thinks. However, the clear graphic depiction can be seen with candlestick analysis of what the rest of the world thinks about this latest financial crisis. Using candlestick signals allows an investor to correctly evaluate what the financial community thanks of specific events. Also, the Japanese Rice traders have one basic assumption that allow candlestick investors to make a huge amount of money. Where do most investors sell? They panic sell at the bottom! Where do most investors buy? They usually buy exuberantly at the top. Today’s 600 point plus move to the downside in the Dow clearly indicates panic coming into the market. Knowing how to utilize that information through the graphics of candlestick signals helps an investor make huge profits in one day, 20%, 30%, 60%. Panic market pullbacks occur occasionally, knowing what to do when experiencing one is a very profitable endeavor.

Member Chat session tonight at 8 PM ET,

The Candlestick Forum Team


Website Special

Candlestick Forum Fun-Pack – 20% OFF!!

Website special reflects current newsletter. If you are reading an archived newsletter you will be directed to Current Website Special

Commodity Trading Online

Commodity trading online is a great way for investors to make money. There are four categories of commodities available for traders including energy, metals, agricultural and livestock and meat. Energy commodities include thing such as heating oil, natural gas and gasoline and crude oil. Metals can include gold, platinum, silver and copper and agricultural commodities can include things such as soybeans, cocoa, cotton, sugar, coffee, wheat, corn, and rice. Commodity trading can also include livestock and meat such as pork bellies, live cattle and feeder cattle and lean hogs.

When conducting commodity trading online there are certain characteristics to understand. Trading commodities can be very different from investing in stocks and bonds. This is because there are global and economic factors that come into play such as technology, disease, and natural disasters. Investors must use caution when buying commodities because trades can completed without visual inspection of the goods. Investment can quickly become risky because events take place that are impossible to predict. This can include things such as epidemics, man-made disasters, weather patterns and other factors. That is one reason why many investors make it a practice to only allocate about 10% of their portfolio to commodities.

When commodity trading online many investors practice hedging. Futures and forward contracts in addition to hedging are common practice and without them the volatility in the commodities market could potentially cause businesses to fail that would have otherwise managed to survive. There are businesses that need to be able to predict their expenses in order to budget. They do this through using the commodity exchanges in order to normalize their expenses. They use futures, forward contracts and hedging in order to do this.

In summary, there are numerous commodities available for investors to trade. These investors must ensure that they do their homework since there are so many factors that could derail their investments in the commodities markets. Investors must ensure that when commodity trading online they do not gamble, but instead speculate based on well informed decisions regarding market dynamics. They must learn to use investing strategies such as hedging and commodity futures and learn how to handle volatile or bearish markets.

Continue your education on the commodities market to see if the trading strategies and market are a good fit for you. There is a lot to learn however more and more investors are taking advantage of the benefits of trading commodities online.


Market Direction

The T-line is an extremely valuable tool. Candlestick signals illustrate when there has been a change of investor sentiment. However, as a trend continues in a specific direction, the sell signal requires more compelling confirmation. The longer a trend continues, the more established investor mindset becomes. A strong reversal signal is required to change investor sentiment.

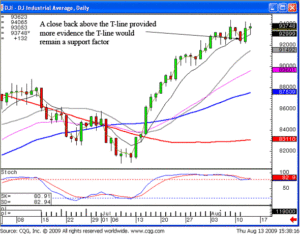
Both the Dow and the NASDAQ closed below the T-line on Tuesday. This should have instigated some profit taking. What is required to indicate the bears were now in control? Confirmation that the bears were still the dominant force. This would have been evident had the selling continued on Wednesday. However, the markets opened relatively flat and then started to trade positive. If the bears were in complete control, the bullish trading should not be witnessed. This should have slowed down the selling process. As time went on during Wednesday’s trading, it became apparent the buying was not a quick rebound from the day before. The indexes moving well above the tee line provided more evidence the line may still be acting as support.

The trading below the T-line on Tuesday provided an opportunity to close out positions that may be exhibiting bearish signals. The bullish trading on Wednesday allowed for reestablishing bullish positions, not necessarily the same ones that were just liquidated. This process allows an investor to take profits at the appropriate time in some charts and reestablish long positions in new charts that have a higher degree of upside probability. This process is a simple cultivation to keep investment funds in better probability situations.

Commodity Trading Online, DOW
DOW

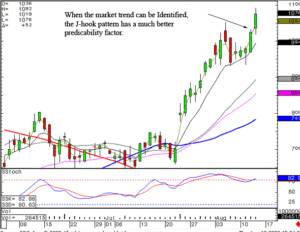
This process also helps investors overcome the fear/ego involved when taking profits. The fear of getting out of a position too early is greatly nullified when the funds are rotated into higher probability potential trades. As illustrated in our recommendation of FITB, this chart demonstrated a high probability trade as a Jay hook pattern was being established, bouncing up off the tee line. Our knowledge about a Jay hook pattern makes this a much higher probability situation versus a trade that has already moved up and now showing potential sell signals.

Commodity Trading Online, FITB

FITB
 
Good investing,

The Candlestick Forum Team


Candlestick Precision

This Week’s Special

Major Moving Averages + Bonus Video Special

Click here for details.

Website special reflects current newsletter. If you are reading an archived newsletter you will be directed to Current Website Special.

Your One-Stop Shop for Japanese Candlesticks

The Candlestick Forum strives to be the top stock market educational site for Japanese Candlestick Trading. We offer a large database of free resources to enhance your trading abilities. Be sure to check out all the categories with free information on technical stock analysis. New to the stock market? Begin your stock market investing education here!

The Free Resources area is designed to allow you to easily find all the Japanese Candlestick Patterns by Major SignalsSecondary Signals, and Continuation Patterns. Additionally, each category lists a link to the specific signal or pattern and provides the image and trading criteria in a printable format. Learn stock market investing quick and easy!


Our Home Page covers Candlestick Investing for Commodity Trading, Day Trading, Futures Trading, Long Term Investing, Swing Trading, and Option Trading.


Take a sneak peek in  Membership Benefits to see what goes on behind the paid section of our website.


Learning the stock market just got easier. Join Stephen W. Bigalow for weekly stock chat sessions. See the stock charts and learn stock market investing with Japanese Candlesticks. The stock market for beginners can be overwhelming. Investing in the stock market involves technical analysis of stock charts. More individual investors are turning to candlestick charts for day trading and long term market analysis.  Join Stephen Bigalow each week for  free market analysis through Stock Chat. Weekly sessions include audio/video presentations on candlestick technical trading and includes a 30 minute question and answer session. Recorded archives are available for review for individuals unable to join live due to time conflicts.


DAILY STOCK MARKET COMMENTS – Read Mr. Bigalow’s daily market comments. 


The Candlestick Commentary Newsletter is personally written by Stephen W. Bigalow, recognized by many in the trading community as the “professional’s professional”. Registration is easy! Simply fill in your email address in the space provided on the lower left-hand side of this page. Register today – You do not want to miss the invaluable market insight provided by Stephen Bigalow. (scroll down and enter email address in the ‘Subscribe’ field on lower left)

Free Stock Market Newsletters – topics include:

MARKET COMMENTS

The publication utilizes the capabilities of the Candlestick signals to quickly analyze all investment vehicles. Stephen W. Bigalow’s years of Candlestick analysis experience produces an easy to read, concise evaluation of market direction. Accurate evaluations are assessed to the Dow, the Nasdaq, S&P, bonds, metals, currencies, all market entities that allow an investor to project future price movements. Having this knowledge presented in a clear format allows the investor to formulate concise decisions.

CANDLESTICK SIGNAL DESCRIPTIONS

Learn how the signals identify the big price moves. Read about the psychology behind a price move attributed to the strength of a signal. Each newsletter will include interesting and profitable elements of a signal formation. You get valuable insights into why a price move occurred. This acts as an excellent preparation for identifying the next big profit situation.

CURRENT EVENTS

Follow how situations in the news media can affect your profits, profits created by media reports causing panic selling and exuberant buying provide excellent profit taking opportunities. Stay apprised of government and business decisions.


Be sure to check our Events & Training Page where we cover any upcoming seminars or free speaking engagements.


Enter the Discussion Forum and enjoy a community of traders, helping each other! This is FREE and one of our most popular formats where fellow traders share hot tips and trading techniques. Always Open!


Stephen Bigalow is frequently asked to write articles for major trading magazines. You can read past publications for free in the Publications & Articles Page.


Search our Ask The Experts  Page where fellow traders post frequently asked questions.


The Candlestick Forum’s Preferred Trading Platform

Free Resources, Ninja Trader LogoFree resources, Kinetick Logo

NinjaTrader is the preferred active trader platform for traders worldwide including our clients.  We are pleased to offer NinjaTrader to our clients for many reasons but one great reason is that you can get started with NinjaTrader for Free!  Why pay hundreds of dollars per month for products with less functionality when with NinjaTrader all you need is access to a real-time or historical data feed.

You can also connect NinjaTrader to Kinetick, our preferred market data service, for free End-of-Day data!  Download NinjaTrader Now


Privacy Statement: We will never give away or sell your email address to anyone for any reason. It is for the sole purpose of sending you this newsletter free of charge. You are not put on any other mailing lists and you can unsubscribe at any time using the link at the bottom of each email sent.

Investment Clubs

Investment clubs exist as a group of people who share an interest in the stock market and who pool their resources into one large investment. Many investors are on there own and may not have enough money to invest individually into the stock market, so they opt to join or create a club based on the principle that there is strength in numbers.

Investment clubs are a wonderful way to get to know the stock market, make friends, and over time receive a return on investment.  Unfortunately, it is very difficult to join an established club since many of them have been operating for years with the same members. These investment clubs are not likely to grow in membership if they have been operating successfully over time.  This leaves many investors with the only option of creating their own stock market investing club. If you are interested in creating your own club keep in mind that it can take a significant amount of your time and a lot of work to get it up and running.  Below I discuss some factors to take into consideration if you are interested in the undertaking required to create investment clubs.

First of all, you should be sure that participating in investment clubs is right for you personally. If you have never been a member of a club, you may not know the answer to this. Some things to take into consideration may include the fact that you may not always get your way.  Can you handle a democratic forum? Also, are you willing to be an amateur?  Just because you start a club doesn’t mean you will become an expert in playing the stock Market overnight. The purpose of investment clubs are to provide a safe learning environment and one that is an ideal atmosphere for beginner investing.  Lastly, are you being realistic?  If you think the only purpose for starting investment clubs is to make a large profit quickly, then you are sadly mistaken.  Not saying that overtime you won’t make a large profit, but there are no guarantees and the level of success depends on many factors.

Still interested in starting one of your own investment clubs? Great!  Below are a few tips to assist in the successful launch of your club.

  • Before investment clubs are formed you must be sure that you have investigated the status under federal, state, and local laws.  It will vary from state to state so you want to be sure that you are compliant.
  • Find compatible members to form your club. You want to have few enough that you don’t have too many schedules to balance and big enough that you allow enough capital to invest so that you actually make money investing in stock. You also want to be sure that your fellow investors share a similar investment philosophy.
  • When creating investment clubs, you also want to be sure that the position of replacements for members who have dropped out, or for newcomers to the club are clearly defined. For example, should the new member be expected to match the total investment of the member he or she is replacing?
  • Determine common goals for the group and decide how much money the club will invest on a monthly basis. This will be a part of determining your clubs investing strategy.
  • Open a bank or brokerage account after you have filled out a Limited Partnership form. (If that is what you choose). Many investors see this as the easiest way to start a business and create investment clubs.

Investment clubs work out great for investors for many reasons. They are a great place to learn how to invest and to learn how to avoid making investing mistakes. You can learn the investment basics and work with members of your group in determining and learning new investment strategies