Archives for November 2019

Picking Depressed Stocks

A falling tide lowers all ships, or in the case of the stock market, all stocks. But, do all stocks deserve to take a beating in a bad market? Picking depressed stocks in today volatile market can lead to stock trading and stock investing profits. Fundamental analysis and technical analysis both come into play when picking depressed stocks. Everyone wants to buy low and sell high but some stocks deserve to fall in price and will not recover. Picking stocks simply based upon a low price can be a recipe for failure. The point of picking depressed stocks to trade or invest in is that depressed stocks may well go up in price. The key to profits in picking depressed stocks is first to pick the right stocks and second to trade intelligently with tools such as Candlestick charting techniques.

Traders use technical analysis tools such as Candlestick charts in order to read market sentiment as guide to anticipating stock price changes. Those with a primary interest in buy and hold investing can also use Candlestick analysis in order to profitably anticipate which stocks will fall in price and which will rise. The longer the investment horizon of a trader or investor, typically, the more important is fundamental versus technical analysis. Nevertheless long term investing can start off with substantial profits simply buy accurately picking the bottom of a price curve with the help of Candlestick stock charts.

day trader can improve his luck in picking depressed stocks to trade by taking a look at the same fundamentals that long term investors follow. A stock with a strong margin of safety is likely to bounce back more quickly from a market driven fall in price. In addition such a stock is more likely to survive stock market crashes when fellow companies might go bankrupt or be the subjects of acquisitions. Intrinsic stock value is a stock forward looking earnings as compared to AAA bonds. So long as an economic downturn or other reason for a market collapse does not affect a stock intrinsic value it is a good bet to recover. Picking depressed stocks with both a margin of safety and continued intrinsic stock value gives a trader a potentially very profitable set of stocks to trade.

By carefully picking depressed stocks to trade the trader improves his likelihood of trading successfully. Once he has chosen stocks to trade, however, the real work starts. With market volatility such as we see today market trends can turn into market reversal in a heartbeat. Knowing the fundamentals of a stock may be useful but being able to use tools such as Candlestick pattern formations is critical to following and anticipating stock prices. Smart traders keep an eye on the fundamentals when picking depressed stocks in a chaotic market but they devote their most serious attention to how stock price movement plays out in Candlestick analysis charts and to the successful application of Candlestick trading tactics.


Market Direction

The graphics Incorporated into candlestick signals and patterns provide an immense amount of information that make for logical assessments in market direction. For example, this morning the powerful open probably moved a lot of investors out of their short positions. However, the assessment of the other indicators in conjunction with candlestick signals would have provided the insight to not cover short positions immediately. This information becomes a lot more clear when using the simple attributes of candlestick analysis.

 
Those simple attributes can also be applied to the Forex trading and commodity trading. Whether working off a 1 min. chart or a daily chart, being able to identify what is occurring in investor sentiment helps produce profitable trades. The day trader can take huge profits out of the markets using a 1 min. and a five-minute candlestick chart combination. The swing trader can trade very comfortably and profitably using a 10 min. chart, and hourly chart, and the daily chart.

Member Chat Session tonight at 8 PM ET.

Good Investing,

The Candlestick Forum Team


Website Special

Website special reflects current newsletter. If you are reading an archived newsletter you will be directed to Current Website Special
Selling Commodities

Companies selling commodities often engage in hedging in order to contain their investment risk. Gold mining companies will sell gold futures and agricultural cooperatives will sell corn futures or engage in live cattle commodity trading. By selling commodities as futures a company guarantees itself a certain level of profit no matter what the spot price of the commodity might be in a given length of time. Likewise processors of commodities will buy commodity futures in order to guarantee the commodity price for the next season or next year. Users of energy products such as aviation fuel will often hedge the risk of rising prices by selling futures. If the price of petroleum products goes up the company will offset its higher fuel costs with profits from trading. Likewise the company may simply buy futures in the commodity and take delivery at the contract expiration date. Commodity and futures training will give those beginning commodity futures trading a clear idea of how buying and selling commodities works.

An alternative to buying or selling commodities futures is commodity options trading. By buying putstraders will obtain the option but not the obligation to buy a commodity futures contract at a set price. The trader will pay a premium for the options contract. However, if the commodity price does not move as expected the trader is under no obligation to execute the trade and the only cost of the experience will be the premium. If, on the other hand, the commodity futures price moves as expected the trader can execute options contracts, selling commodities at the higher price while simultaneously buying at the new, lower price.

To profit from selling commodities futures the trader will do both fundamental and technical analysis on a commodity. This will involve following production reports, crop reports, weather reports, or economic reports, depending upon the commodity traded. It will also involve reading market price patterns. Fundamental analysis can be very rewarding if the trader discovers information before the rest of the market but, usually, the results of fundamental commodity analysis are known to all traders and are only useful as a guide to market limits. The daily price movements of commodities markets are best anticipated with tools such as Candlestick patterns.

By analyzing Candlestick pattern formations the trader will be able to make use of the fact that commodity markets repeat themselves and that reading the first half of a pattern correctly helps to profitably predict the second half.
Traders have been using Candlestick basics in buying and selling commodities for more than three centuries. The basics of this easy to read, visual, system evolved in rice trading in ancient Japan. However, Candlestick analysis is applicable to all commodities trading as well as stock trading and options trading. The Candlesticks system works because it lets the market tell the trader what the market will do. As in all trading there is risk. However, the trader who can more accurately anticipate commodity price movement will more likely profit in buying and selling commodity futures.


Market Direction

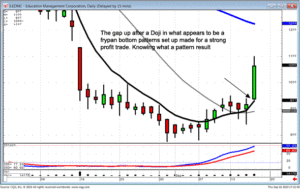
Why is it important to know the simple rules for candlestick signals and patterns? It prepares an investor to take advantage of high profit situations immediately! Because there are expectations after witnessing a signal or a pattern, an investors trading strategy for their next swing trade or day trade can be put in place with a high degree of profitable results. This is clearly illustrated in the EDMC chart. The visual recognition of a frypan bottom patterns set-up made for a very profitable trade. The simple rules for this pattern allowed for a very obvious profitable trade.
Where is a Frypan bottom patterns usually going to breakout? When the stochastics are close to the overbought condition! This is the result of investor sentiment slowly building up in a positive trend.

Yesterday, EDMC formed a Doji/spinning top right on the T-line. There was nothing unusual about this other than it was continuing the trajectory of a frypan bottom pattern. However, today’s open indicated a strong buying force. It gapped up. What is the simple analysis of the situation? A frypan bottom has been developing. A Doji formed on the tee line. The Doji was followed by a gap up on the open. What is expected for a frypan bottom breakout? Either a very big bullish candle or a gap up, or in this case a combination of both. This is not rocket science. This is merely taking advantage of what investor sentiment usually does time after time.

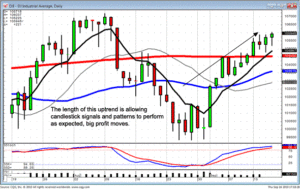
Patterns have an opportunity to form to completion when the market starts showing a consistent trend move. As seen in both the Dow and the NASDAQ, the uptrend has been consistent ever since September one. This has allowed investor sentiment to build up, making candlestick patterns work effectively. Today’s trading in the markets indicated profit-taking most of the day but the buying continued eventually going into the close. The indexes are trading at or near obvious resistance levels. What should be expected once they get to those levels? This is where knowing what candlestick signals represent provide an immense amount of information.

Selling Commodities, EDMC

EDMC

Selling Commodities, Dow

DOW

There has been good profits made in this last market move. Have all the recommendations made profits. Definitely not, but knowing how to apply candlestick analysis to your portfolio makes closing out the unprofitable trades quickly and anticipating where the next strong price moves may occur. For those of you that are fairly new to candlestick analysis, you will find there is a completely different perspective on how to make profits. The assumptions attached to candlestick analysis are not one of speculation, they are utilizing the information built into graphic chart formations that have demonstrated what the candlestick signals and patterns are representing.

If you have not had the opportunity to participate in the two day candlestick training course, please think about this seriously. When you see all the common sense aspects of candlestick analysis put into a logical order, you begin to have a completely different perspective on how to make profits in the markets. You will know when to be buying and you will know when to be selling. Steve Bigalow demonstrates the powerful implications that are revealed through the candlestick signals. He will teach you in a manner that allows you to immediately look for and take advantage of profitable trades.

Chat session tonight at 8 PM ET. Everybody is welcome.

Good Investing,

The Candlestick Forum Team


Current Website Special

Quick-Start Trading Package

E-Learning Online Training Schedule

Options Training Course 
October 16 & 17, 2010
Commodity Training
November 6 & 7, 2010
Boot Camp
November 20 & 21, 2010

Website special reflects current newsletter. If you are reading an archived newsletter you will be directed to the Current Website Special

Stock Market Terms – Saying It The Right Way

When preparing for an interview, a prospective employee will usually do some research on a company and its products. If the prospective employee has never worked in the particular field, he or she might try to learn some of the “buzzwords” related to the business. Knowing some of the terminology can help even the beginning trader successfully discuss investment philosophies as well. Below are some of the stock market terms that will help you when speaking with someone else in the business:

Basic terms

These stock market terms reflect common ideas and descriptions that are used every day. Such stock market terms portray types of people and general stock market basics.

  • Ask – This is the lowest price that a seller will accept when selling a stock.
  • Bear – This refers to an investor who believes the stock market or a particular stock is declining. This is the opposite of a Bull.
  • Bid – This is the highest price that a buyer is willing to pay for a stock.
  • Broker – A person that buys or sells stocks, bonds, commodities and such in exchange for a fee which is called a commission.
  • Bull – An investor who believes the whole market or one individual stock is going to increase in price. This is the opposite of a Bear.
  • Dow Jones Industrial Average – This is a compilation of the 30 most traded blue chip stocks. This list is the most widely used for analyzing stock market indexes.
  • NASDAQ – This is a stock exchange consisting primarily of technology companies.
  • Stock – This is the smallest measurable unit of ownership in a company. Shares fall into either the common or preferred categories; companies issue shares of stock in order to raise capital without borrowing money.

Investing terms

These words and phrases reflect stock market terms for various stock market strategies. These stock market terms are used to describe specific conditions or analysis.

  • Blue Chip – This term describes a company with a history of strong earning, traditionally increasing dividends and an outstanding balance sheet. Blue Chip stocks include Exxon-Mobile, Coca-Cola and Wal-Mart.
  • Book Value – This is the value of a company if assets and common stock equity are added together and all liabilities are subtracted. There is little correlation between the book value and the market value. Book value is used in such fundamental analysis measurements as Price to Book ratio.
  • Dividend – This is the portion of a company’s profit that is given back to the investors. Such payments are made on either an annual or quarterly basis.
  • Market Capitalization – A company’s market capitalization, also known as its market cap, is calculated by taking the number of outstanding shares of stock multiplied by the current price per share.
  • P/E Ratio – This widely used analysis tool of Price to Earnings ratio measures now you pay for each dollar of corporate earnings. For example, if you have $30 stocks that report a profit of $2 per share, your P/E ratio is 15; $30 per share divided by $2 earnings per share equals 15. In this ratio the lower the P/E ratio, the better.
  • Spread: This stock market term reflects the difference between the Ask and the Bid.
  • Yield – This is the percentage of a dividend paid against the stock price.  For example, if you receive a $3 dividend on a $30 per share stock, your yield is 10%.

Conclusion

It is much easier to discuss the stock market if you understand some of the basic stock market terms. There is a large variety of stock market terms and learning them will not only help in your conversations but also to better comprehend the tools available for technical analysis.


Major Signals Educational Package

Check Out the 30-day Membership today

Commodity Trading System

A commodity trading system can be constructed in an afternoon or it can take months. Depending upon how complex a commodity trading system is commodities traders will be able to keep track of the necessary figures on a notepad or may need to feed data in a computer program. The basis of a system for trading commodities is using available data from commodities markets to predict the markets’ next moves. Although you can buy a prepackaged trading system, the exercise of constructing a basic commodity trading system is a useful exercise for beginner or pro. A system based upon Candlestick charting will help beginning traders and experienced traders see the market more clearly. This sort of exercise coupled with a Commodity and Futures training course will get you off to a good start trading commodities.

The exercise of setting up a basic commodity trading system forces a number of basic and important decisions. How much will you invest in a commodity market? How long will your trades last from buy to sell or sell to buy? How much will you invest per trade? What will your stop loss be? Just which commodities will you trade? Commodity trading charts such as used to view Candlestick chart formations are basic to understanding the trends and reversals of the commodities market. Support and resistance zones become clear with Candlestick charting. As a new trader engages in Commodity and Futures training the simple exercise of setting up a basic commodity trading system will help you convert training principles to good trading habits.

Deciding how much you will trade will determine the size of your margin account which will be your minimal trading capital. Likewise deciding upon which market to trade will determine minimum lot sizes and necessary trading capital. Aluminum and copper both trade in 25 metric ton lots and soybeans trade in 5,000 bushel lots. As an example, daily trading limits on soybean trading on COMEX are $0.70 per bushel expandable to $1.05 and then $1.60 at market close with limit bids and offers. A daily limit of $1.05 on 5,000 bushels comes to $5,250. This gives an idea of the kind of calculations that need to go into a commodity trading system just for trading futures in soybeans. Whatever commodity you are trading you will need to consult the commodities exchange trading rules when setting up your trading system.

A commonly used charting tool to incorporate in a commodity trading system is a twenty day moving average. In moving average trading the trader can use market highs, lows, openings, or closings for the last twenty days. At the end of the trading day the appropriate number is added to the twenty day list and the oldest day is removed. The trader takes the sum of the twenty numbers and divides by twenty. This is the average of the last twenty days. This is noted on a chart along with the high, low, open and close for the day. This average over time is the twenty day moving average. The moving average presents a smoother curve of market prices. This helps in trend trading to see where the market is really heading.


Market Direction

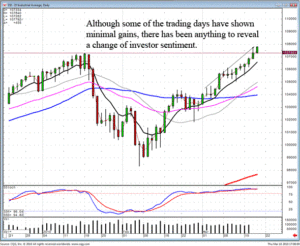
Let the market tell you what the market is doing! That is the mantra of candlestick analysis. The Japanese Rice traders professed this philosophy and made fortunes in the rice market. What is the stock market telling us today? It is still in a slow steady uptrend. How does this information help the candlestick investor? Most investors have a portfolio that would be coming up modestly during a slow uptrending market. The candlestick investor has a completely different perspective. A slow uptrending market reveals one important aspect. Investor sentiment is not changing. This is very informational for a candlestick investor. Having the scanning capabilities and the visual analysis capabilities to identify signals and patterns that produce inordinately strong profits, creates the opportunity to take advantage of those signals and patterns. As long as the market is not experiencing a dramatic change of investor sentiment, price patterns have a greater potential of fulfilling strong price moves.

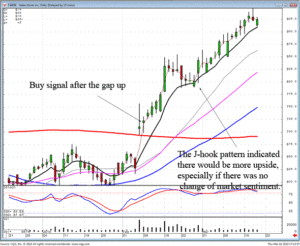
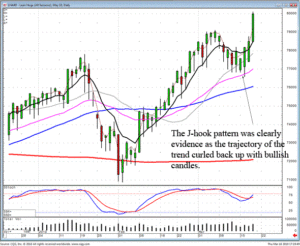
The profit results from a Fry pan bottom breakout or a confirming J-hook pattern is many times greater than the normal uptrending stock price. Candlestick patterns are created by the accumulative knowledge of everybody buying and selling during a particular time frame. Reoccurring thought processes can be visually witnessed as a price pattern develops. The creation of that pattern is usually based upon elements other than the general market movement. That is why patterns usually produce good profits in spite of the general direction of the market. The operative word is ‘usually’! The probabilities improve dramatically for the profitable results of a pattern if the general market has not had a severe change of investor sentiment. A bullish pattern obviously is going to work much better in a bullish environment. Although a pattern still has a good chance of working well even when the market may change direction severely, the overall probabilities start to diminish. A severe selloff in the market will be part of that accumulative knowledge of the buyers and sellers. This is why a very slow uptrending market can still be extremely profitable for a candlestick investor. The general market conditions do not become a factor for a pattern price move.

Commodity Trading System, DOW

DOW

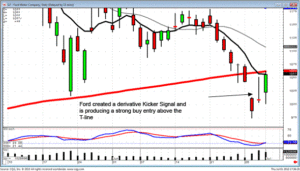
Commodity Trading System, F

F

Commodity Trading System, BEBE

BeBe

Commodity trades have an advantage over stocks. They do not have as many outside influences dictating the direction of their price move. The price of soybeans or copper are more oriented towards supply and demand factors than all the other elements that are affecting stock prices. This makes the price trend  of a commodity price  much easier to analyze. A commodity stock chart can be analyzed much more on a pure technical basis. A price pattern is much more effective when analyzing the potential pattern it may be forming. Our recent recommendation, shorting lean hogs, was reversed once the signals indicated a potential of a J-hook pattern.

Commodity Trading System, May Lean Hogs

May Lean Hogs

What does this knowledge to for a commodity trader? Because of the speed and leverage involved in commodity prices, a trader needs to be knowledgeable in anticipating what a price might do. As can be seen in the Lean Hog May contract, it became apparent the Bulls were continuing to participate after a short pullback. The potential of a strong downward move could be seen to be diminishing. This makes for a prepared decision-making process. Once it became apparent the Bulls were still participating, the quick execution for closing the short positions and establishing new long positions could be done on a mechanical basis. Emotions would not have anything to do with reversing the trade.

The Candlestick Forum has just made the Candlestick Forum Commodity Trading videos available. If you would like to sharpen your analytical skills, take advantage of the knowledge that has been incorporated into these training videos. Commodity trading requires much faster trade analysis and execution. The insights conveyed in these training CDs not only will greatly improve your commodity trading talents, but they will also hone your abilities to trade stocks much better. The information built into the analysis of commodity and currency price movements allows an investor’s mind to  anticipate the next move. This produces decision-making thought processes that result in faster and more confident trade positioning.

Chat session tonight at 8 PM ET – Everybody is welcome. Learn how to identify commodity and stock pattern breakout setups.

Good Investing,

The Candlestick Forum Team


This Week’s Special

Commodity & Futures Trading

Click here for details

Website special reflects current newsletter. If you are reading an archived newsletter you will be directed to the  Current Website Special.

Over the Counter Stocks

Over the counter stocks are contracts that are bilateral and consist of contracts in which two parties agree on how a particular trade or agreement is to be settled in the future. These types of stocks, also known as “unlisted” stocks are traded over the counter typically because the company is small and unable to meet the listing requirements of the other major stock exchanges. Over the counter stocks are very risky stocks as well because there is no controlling body or organization such as the SEC to oversee the securities industry.  Over the counter stocks also refer to stocks that trade through a dealer network instead of a centralized exchange and are traded by broker-dealers who negotiate directly win one another over computer networks and via the phone. Very few of these types of stocks are successful in moving from trading over the counter (OTC) or from the “pink sheets” to the NASDAQ or other major exchanges such as the American Stock Exchange or the New York Stock Exchange. It absolutely imperative to understand and be very cautious when trading over the counter stocks because the OTC Bulletin Board stocks are either penny stocks or they are stocks that hold bad credit records.

In the United States over the counter stocks are traded on the OTC Bulletin Board (OTCBB).  The OTCBB was founded in 1990 and it is a regulated quotation services that exhibits real-time quotes, last-sale prices, and volume information for various types of equity securities.  Bonds are also considered OTC securities because they don’t trade on a formal exchange.  Most of these financial instruments are traded by investment banks that make markets for specific issues. Investors who would like to practice bond investing must call that bank that makes the market in that bond and must ask for a quote.

When discussing over the counter stocks, the concept of penny stock investing must be discussed as well. Many investors like to buy penny stocks because they require a pretty low investment and have the potential to more than double your investment in one to two days.  Again, the only problem with investing in penny stocks is that these over the counter stocks are very risky because their price can drop drastically due to the potential low value of the companies that are listed on the OTCBB, otherwise known as the “pink sheets.”  It is tricky because many of the companies traded over the counter have limited financial history making it difficult to determine their actual value.  Also, many of the companies are very new or they are extremely close to going bankrupt. If you are interested in trading over the counters stocks, you want to look for those companies that are possibly just starting out but that are making an honest effort to move from the OTCBB to a major stock exchange such as the NYSE. There is room for making a good return on investment when trading this type of stock, but you must be aware of the high risk factor when doing so.

Investing in over the counters stocks can be a great way to make money. Just remember that even though you are trading pennies, there is still potential to lose big when trading over the counter stocks. 

Trading Fibonacci

Trading Fibonacci is used when trading stocks, commodities and other financial instruments. Fibonacci numbers are a sequence of numbers where each successive number is the sum of the two previous numbers. These numbers were discovered by an Italian mathematician and the numbers anticipate changes in trends as stock prices tend to be near lines that were created by technical analysis Fibonacci studies.

Retracement is a popular tool used when trading Fibonacci. Retracement is used to identify strategic places for transactions to be placed, or they are used for stop loss orders as well as target prices. Retracement is not only used in this theory but is also used in the Elliott Wave Theory as well. Basically, retracement refers to the likelihood that a stockfs price will retrace a major portion of an original move while finding support or resistance at the key levels before it continues in its original direction.

Fibonacci indicators are used when trading Fibonacci and they are used as reference points in order to predict a retracement versus a reversal. These indicators are also used by technical analysts in order to predict support and resistance levels as well as price targets. For instance, another tool is the Fibonacci arc. This arc is used in order to determine where to anticipate key support and resistance levels. A curved line is drawn and it is created by an invisible trend line between two points, as well as by three curves that intersect this trend line at key levels. The first two points are usually the high and the low in a specific time frame. This is a popular Fibonacci stock charting technique. Just like moving averages, the Fibonacci indicators work like price magnets to old highs or lows. For an even greater degree of accuracy they should be combined with the major Japanese candlestick patterns.

Many traders will use Fibonacci numbers in conjunction with Candlestick Patterns and other technical indicators. Candlestick signals are also great technical analysis tools that is used by many traders in order to find the optimum entry and exit points while trading. There are also many charts that provide confirmation when all of your technical indicator are in agreement. You can learn about this in our 30 minute training tutorial Fibonacci Trading Techniques.

Continue to learn about Fibonacci numbers and determine if it is a technical analysis tool that you would like to use in conjunction with candlesticks analysis, moving averages, or other tools.


Market Direction

The advantages built into candlestick analysis allows an investor to place trades when the probabilities are in their favor. The primary purpose of technical analysis is to take advantage of price movements that have been identified to have specific results. Candlestick signals and patterns are the optimal technical analysis indicators. They show exactly what is occurring in investor sentiment. This becomes a powerful format for ‘when’ to enter and exit trades. However, it also provides information that informs an investor when ‘not’ to be trading.

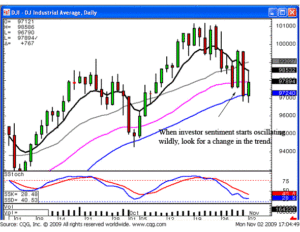
A Doji represents indecision between bulls and bears. At the extreme of a trend, either in the oversold or overbought conditions, a Doji illustrates when there might be a change of trend direction. The same indecision can be demonstrated by wild oscillations in the markets. As we have seen over the past few trading days, the market has demonstrated a lack of control by either of the Bulls or the Bears. Although the formations are much different, the prognosis is the same. Dramatic indecision usually represents a change of investor sentiment.

Trading Fibonaci, DOW

DOW

Will there always be reversals when indecision starts appearing in the markets? Not always, but the probabilities become dramatically favorable when adding confirming indicators. The Dow is currently showing support at the 50 day moving average, the stochastics are in the oversold condition, there appears to be a trend line through the lows since August. The advantage of using candlestick signals is that each formation represents the conditions of investor sentiment. This allows for valuable information to be immediately assessed. If that information coincides with technical levels, such as moving averages, trend lines, Fibonacci retracements, or any other technical indicator that is known to be watched by many investors, the candlestick investor can see immediately what investor attitudes are once those levels are hit.

Common sense stop loss placement, implemented by candlestick analysis, keeps an investors trading funds in tact. The past few days would have executed logical stop loss trading. This would have created every cash positions in a portfolio. When the market is not showing a directional bias, not producing an advantage for the candlestick investor, then what should they be doing? Sitting in cash! Candlestick analysis provides an effective visual analysis of what prices should be doing. That should be the primary factor for any investment program. When those advantages cannot be utilized, trading at that point becomes speculation. When there is no advantage being created by the tools provided in accurate chart analysis, the prudent strategy is to sit out of the market for a few days until the trend information can be identified.

If you can analyze and utilize trading techniques that provide a high probability results, profitable investing should be easy. However, there remains an element that has to be addressed. Your own mental psyche! This past Thursday, Adrian Toghraie gave an excellent presentation on how her training can focus on an individual’s investment flaws. Having a good trading program is the first step. Knowing how to implement with the correct frame of mind is the next step. If you missed her presentation, it can still be viewed in the archives. Also, her website provides excellent explanations on how investing hurdles can be overcome. Please check her website at
www.tradingontarget.com. Mention the Candlestick Forum presentation for her special prices.

embers Chat Session tonight at 8PM ET.

Good investing,

The Candlestick Forum Team


This Week’s Special

Candlestick Trading Boot Camp on Quick Download

Plus Bonus 30-Day Membership

Quick Start Trading Package

Click here for details.

Website special reflects current newsletter. If you are reading an archived newsletter you will be directed to the Current Website Special


Trading Stocks for Beginners

Trading Stock for Beginners – Quick Introduction to Stock Trading

In today’s article we will discuss information that each and every investor should learn before investing in stocks. This article, Trading Stocks for Beginners, will take a look at how stock is valued, how to create a trading plan, and the types of trading methods that each investor should learn about before deciding how to invest their money.

Trading Stock for Beginners: How are stocks valued?

To make money investing in stock you need to buy stock at one price, and sell it at a higher price. The price of stock is determined by the perceived value of the stock based on two criteria. First, the value can be determined by the supply and demand of the stock. The supply and demand of stock is dependent upon the amount that investors are willing to pay for a share of stock and in return the amount that investors are willing to sell a share of stock. Second, a stock’s value is also determined by the price to earnings ratio.

Trading Stocks for Beginners: How do I create a trading plan?

When creating a stock trading plan, there are many components that should be included. In today’s article we will discuss three points that should be addressed in each plan, however a true trading plan will require a lot more information. The first part of developing a trading plan is determining your needs and your goals. Are you investing for the short-term of are you looking to practice long term investing? After reading today’s article “Trading Stocks for Beginners,” you will most likely come to realize that you need to set-up a brokerage account. What stock trading methods will you utilize to invest you money? Lastly, what is your budget? Many investors find themselves in a tough position because they don’t take the time to determine a budget based on money that they have. These investors will often find themselves investing with borrowed money.

Trading Stocks for Beginners: Which trading method should I utilize?

One of the most important parts of developing your trading plan is to determine how you will turn a profit when investing in the stock market. You will need to determine if you would like to practice fundamental or technical analysis. Through fundamental analysis the investors will assess the value of the company to determine if they would like to become a shareholder. They evaluate the company’s financial health, past stock prices, the economy and other factors. When researching other articles in addition to this article, Trading Stocks for Beginners, you will come to understand that fundamental analysts look to invest in the long-term as opposed to most technical analysts. Investors who utilize technical analysis typically look to practice short-term trading. They analyze trends and patterns in stock prices and use the volatility of the stock market to their advantage. Technical analysts are typically comprised of day traders and swing traders who will only own stock for hours to days as opposed to fundamentalists who own stock for a period of months to years.

Trading Stocks for Beginners: Conclusion

There is a lot of knowledge and training required to successfully trade stocks. Like with any new venture, “the more you give, the more you get.” This does not mean the more money you give, the more money you get back, but rather the more practice, training, and education that you receive, the more likely you are to succeed. There is a lot of information in addition to this article titled “Trading Stock for beginners” that you will need to research, but hopefully this article gets you pointed in the right direction.


Market Direction

Seasonality has many different definitions when it comes to investing. There are times of the year that will show a higher probability of the markets moving up or down. There are specific times of the year when certain sectors will act better than other sectors. For example, buying many of the toy manufacturers during the summer is a viable seasonality trade. The prices of stocks in that sector are usually much higher in January.

Seasonality is the result of reoccurring investment thought processes. Just as there are times that markets move well, there are other times when markets don’t move very well. The middle of the summer is one of those times. This is the result of many investors/traders taking time away from the computer screens. Volume diminishes dramatically. Trend direction tends to become more lethargic. This does not necessarily mean volatility diminishes. As we have seen in the Dow over the past two weeks, there has been good volatility on a daily basis while the overall trend has remained flat.

Stock Trading for Beginners, DOW

DOW

Having the knowledge of when it is most beneficial to be participating in the markets allows an investor to better allocate assets. Assets, in this case, do not necessarily mean investment funds. It can be applied to mental time and energy. Doing the same thing day in and day out requires energy. The continued draining of mental energy can create burnout. Everybody needs to take a vacation to rejuvenate. There are investors that become so involved with investing; they have to be participating in market trades all the time. But that continued involvement can diminish one’s mental clarity. When is the best time to rest and rejuvenate? When everybody else is resting and rejuvenating! It has been demonstrated that the summer months do not have the same investment profit potential as the other parts of the year, utilize that time for better pursuits. Can money be made during the summer months? Of course! But the opportunities may be fewer and far between.

The benefit of candlestick analysis is that it can pinpoint those few opportunities during the summertime. Even for the diehard investor, using candlestick signals during the summer months allows them to be participating in the sectors that ‘are’ getting attention. As demonstrated over the past month, the obvious sectors continue to act well. Oil stocks continue to maintain a bullish trend. Mining stocks are also performing well. This allows for simple trading strategies during the summer months. That strategy may be as simple as selling stocks in the oil sectors when they move away from moving averages and buying them back when they show buy signals during the uptrend.

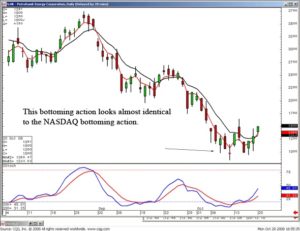
HK Bottoming Action

HK

Applying candlestick signals to sectors that perform in specific times of the year allows the candlestick investor to put the probabilities of being in the right sector at the right time that much greater to their advantage. Do all sectors move the same way year after year? Obviously not, but they probably move in a certain manner a high percentage of the time to create their observance by the seasonality watchers. Candlestick analysis becomes an excellent confirmation of whether a stock/sector is going to perform in the manner that it is expected to. This again produces a high probability situation that can be expected, then observed using candlestick signals.

There are many investment strategies for making profits with candlestick signals. Use the simple and most effective ones for specific market conditions. Investing should be as simple as possible. Why make it complicated? Learn how to use the candlestick signals effectively. You then become the master of your own investment program. You also do not become a slave to your research program. Investing should be a process for making money in a timely manner, not spending hours and hours each day to produce profitable results.

Chat session tonight at 8 p.m. ET — open to everybody. Click here to Connect.

Good investing,

The Candlestick Forum Team


***Final chance to Claim $1000 FREE BONUS ***

Because you are a preferred subscriber to The Candlestick Forum Newsletter you are eligible to take advantage of an Exclusive Limited Time Offer from Stephen Bigalow.
Stephen Bigalow has been called the “Professionals’ Professional” and through a special offer to you his 2-Day Training Seminar 5-CD Set plus Training Manual is available for $596. The very same training that sold for up to $1,900 per seat! 
You definitely don’t want to miss out on this limited offer – available to the first 53 respondents.
Claim your $241 Bonus for FREE Membership; full membership access for the next 3 months. Including free Members Only Monthly Training Videos; July Video is Trading Breakout Patterns (priced at $69.77) August Video is Trading the Fry Pan Bottom Pattern (priced at $55.77) and September Video is Gap Trading Package (priced at $139.54)
PLUS over $335 in Training Products ready for immediate download.
Double Bonus – FREE Video Scanning Techniques to Higher Profits (sells for $187), once reserved for Stephen’s personal clients, included in your Preferred Subscribers Special.
Don’t Delay: The Preferred Subscribers Special will be removed once the first 53 packages are gone. With over $1,000 in Bonus Products, I think you’ll agree this is the best $596 investment you may ever make! Buy Now

Website special reflects current newsletter. If you are reading an archived newsletter you will be directed to Current Website Special.

Online Stock Market Trading Using Japanese Candlesticks

Because of the progress that we have achieved on the internet, in addition to banking, dating, shopping and bill-paying, we can even participate in online stock market trading. Whenever they want to, traders now have the ability to look at their accounts online, and brokers have the ability to process orders with internet stock trading, instead of the telephone.

Before online stock market trading was an option, whenever we wanted to sell or buy stocks we would have to call up our broker to make a trade. Now we are able to log into our stock market online investing accounts and trade stocks, bonds, currencies, and options at will.

Many brokerage houses and brokers now offer online stock market trading as an option to the stock market community. Another advantage is that the commissions and fees are often a lot lower. While online stock market trading has it’s pros, as usual there are cons as well.

If you are a beginner investing in the stock market, the ability to speak to your broker can be very beneficial. Or if you haven’t developed a profitable stock trading strategy yet, online trading may be dangerous. If this is the case, make sure that you educate yourself as much as you can about whichever investment options you’re interested in before you begin online stock market trading.

It is important to consider that if you don’t have easy access to a computer with an internet connection, you won’t always have the ability to make a trade online. A back up stock trading plan should be in place to be able to call and speak to broker if this ever happens. This should be the case whether you are an advanced trader or a beginner investing online.

Successful traders consider it a good idea to choose an online brokerage house that has been in business for a while. Since the ability to trade online is somewhat new, you won’t be able to find a online brokerage house that has been in business for fifty years to help with investing. The next best thing is to find a company that has been in business that long and now offers online stock market trading as an option.

Online stock market trading is a wonderful thing, but it isn’t for everyone. Assess your habits carefully before you choose to do your trading online, and always make sure that you learn how to invest in your chosen investment field before diving in.

Commodities Contracts – The Basics

Remember that freshman Human Anatomy class you had to take in college? The professor pulled out “Mr. Bones” or whatever name the class skeleton had and the following drill was the same. The professor would proceed to quiz the class while teaching the underlying structure of the human body. The same exercise is valuable in commodities trading as well; looking at the “skeleton” of a commodities options contract is helpful for understanding its body.

Dissecting the Body of an Options Trading Contract

While these features do not represent all of the aspects of an options trading contract, they do create its structure:

  • Underlying Asset – In order to write an options trading contract, you certainly have to include the commodities that contract is buying. Corn futures, gold and silver are all examples of commodities that can be underlying assets.
  • Strike Price – The strike price, which is also known as the exercise price, is amount for which the commodities will be sold or bought if the commodity trading occurs as detailed in the contract. It is the difference between the current price and the strike price that gives either the buyer or seller their profit.
  • Exercise Style – The exercise style is important to the successful trader because of the impact it has on investment strategy. An American style contract means that the contract can be exercised at any time up to the expiration date. European style contracts can only be exercised on the expiration date. This information is included in the contract.
  • Expiration Date – For European contracts, this date is when the contract will be executed. For American contracts, this is the last day for futures trading on this contract.

Factors Affecting Commodities Contracts

There are a number of factors that can have an effect on commodities contracts. These factors can determine when a contract is implemented, when it is exercised and how much it costs. Futures contracts have variables such as:

    1. In The Money – If a commodities contract is already profitable when it is purchased, it is referred to as in the money. Sellers will sometimes use this investment strategy when they believe that a commodity price will fall, taking it out of the money.
    2. Out Of The Money – If a commodities contract is purchased while it is still losing money; it is referred to as out of the money. If a call option is purchased when the current price is below the strike price, it would fall into this category.
    3. At The Money – If the current price and the strike price are the same, the contract is at the money.Current Price Relative to the Strike Price. Depending on the investment philosophy involved, a trader might buy commodities that are “in the money”, “out of the money’, or “at the money.” These terms are comparative between the strike price and the current price.
  1. Premium Price. The premium is the amount that the investor will pay to purchase a particular futures commodity. This amount is affected by several factors but it is basically the cost of a commodities contract.
  2. Length of a Contract. The time from the purchase date of a contract until its expiration date can affect the cost of the premium. The longer the contract, the more likely that the terms of the contract will be met; this means that the premium would go up to reflect that probability.
  3. Complexity of the Contract. The type of contract written on futures options can affect the premium price. A simple market order that is out of the money will cost less than selling covered calls.

Conclusion

Commodities can be complex and their contracts can contain many things. Looking closely and examining the skeleton? of a commodities contract and understanding its investment basics can help pass the test of being a successful investor. And you don’t have to worry because we won’t even need Mr. Bones!

Futures Contracts – Profitable Investment Alternatives?

With the growing popularity of futures trading, more and more people are jumping into this interesting form of investing. People quickly find out that futures contracts are vastly different than agreements to purchase common stocks; with futures contracts, you are not actually buying a particular commodity, you are obtaining the right to purchase the underlying asset during a particular time period.

Pork Bellies?

Another difference between investing in the stock market and investing in futures contracts is the asset itself. Of course stocks are the assets involved in the stock market, while the commodity assets in futures contracts include:

  • Currencies – The currency market is one of the best known commodities, trading the likes of the British pound and the American dollar.
  • Interest Rate Futures – T-Bonds represent long-term interest rates and Eurodollars are for short-term interest rates.
  • Energy Futures – Natural gas, heating oil and crude oil futures are the most widely known in this sector.
  • Food Sector – Coffee, orange juice and sugar are well known commodities in this sector.
  • Metals – Gold, silver and copper are traditionally strong commodities.
  • Agricultural – Wheat, coffee, cotton, soybeans, pork bellies and corn futures are among those that are best known.

With so many futures contracts available, it can be difficult to decide which commodities interest you, especially if you are new to commodities trading. Sometimes it can be helpful when you start trading to begin with more popular commodities.

Below are five of the most popularly traded futures contracts:

  1. S&P 500 E-mini – This is extremely popular for those investing in the futures markets. The E-mini can be traded electronically 24 hours a day, five days a week. In addition, the E-mini has most of the same advantages of the regular S&P 500 commodity but the cost of investment is much less.
  2. E-mini NASDAQ 100 – The E-mini NASDAQ 100 follows the movement of the NASDAQ 100. Like the S&P 500 E-mini, this futures contract can be electronically traded and the contract and the amount of margin you have to set aside to trade the contract are smaller than a standard contract. Since most individuals don’t have large enough accounts to trade regular contracts for the NASDAQ 100, the E-mini works out great.
  3. Light Sweet Crude Oil – Probably the most famous commodity traded is oil futures. When you see the price of oil discussed on the evening news or in an investment newsletter, this is exactly what they are discussing.
  4. Gold – If oil isn’t the most famous futures contract, then gold surely is. A gold contract tracks the price variations of one ounce of gold. Gold became an important part of the US economy when the United States went to the Gold Standard in the 1970’s. Since then, the price of gold changes dramatically, almost always in the opposite direction of the US dollar. Gold investments are frequently used as hedge funds because of the relationship with the US dollar.
  5. E-mini Euro FX – The E-mini Euro FX contract tracks the movement of the exchange rate between the U.S. dollar and the Euro. The “E-mini” means that the contract and the amount of margin you have to set aside to trade these futures contracts are smaller than regular contracts. Most individuals don’t have large enough accounts to trade a regular contract for the Euro, so E-minis are excellent investment strategies.

Conclusion

Futures contracts provide interesting and potentially profitable investment alternatives to many investors. Understanding the investment basics of futures contracts and commodities such as these will help you to be a more successful trader when it comes to futures contracts.