Archives for November 2019

Commodity News Reports

To successfully trade commoditiestraders learn the basics of commodity trading with classes like Commodity and Futures Training. As part of a successful trading strategy for commodities, traders follow commodity news reports. There are many places to find commodity news reports. These include print media such as the Wall Street Journal, the online business news media such as Bloomberg, Yahoo Finance, Google News, and the like, and propriety news media affiliated with commodity dealers and commodity brokers. Much of what comprises news about commodities comes from following trading on the NYMEX or official reports such as the US Department of Agriculture Daily National Grain Market Summary. Commodity news reports ideally contain hard data first of all and reasoned analysis second. The hard data of commodity news reports can be used for fundamental analysis of the commodity in question. Opinions of commodities analysts may be useful in directing the trader where to focus his or her technical analysis of commodities markets.

The type of information in commodity news reports typically has to do with issues of commodity supply and demand. Useful analysis will be that which gives insight into supply and demand issues. For example, a drought in Europe and Asia is drastically reducing wheat production and driving up prices worldwide. The fact that the drought is continuing towards the fall tells us that the winter wheat crop to be planted this fall will also be affected. Thus, even if there is snow this winter in the Russian Steppes and good spring rains the wheat crop will still be poor next year. The next set of facts a trader will want to see is reports of how much wheat is planted in the Dakotas, Nebraska, Kansas, Manitoba, and so forth, this coming fall. Fundamental commodity analysis starts with commodity news reports.

The timing of fundamental information about commodities from commodity news reports is important. To the extent that a trader gets the news first he can trade the news. For example, news of strikes in gold mines in South Africa will affect gold futures. Those who catch the news first will typically be able to successfully trade a jump in the price of gold futures. Even those who don’t get in on the news early and can’t trade the initial price jump will need to know what made the market change in order to successfully read subsequent gold commodity price movement and commodity price reversals. Even though successful technical traders know that eventually all fundamental information is factored into commodity prices the more they understand what is driving the market the more successfully they can trade. Rice traders in ancient Japan knew about the factors that influenced the price of rice. It was the addition of Candlestick analysis and Candlestick trading tactics on top of a fundamental understanding of the market that led to profits.

It is important for a commodity trader to understand commodity news reports, both what is written and what is left out. To the extent that a commodity broker is trying to gain customers there may be a slant to their reports. The ability of a trader to do their own fundamental and technical analysis will be protection against bad trading advice. Traders who follow the news, learn how to recognize a Candlestick pattern and follow Candlestick pattern formations will typically prosper more so than others because of their critical thinking and diligent attention to detail.


Market Direction

The market is in a downtrend but it opens positive and starts trading positive, what do you do? Without the combination of candlestick signals and confirming indicators, many investors would immediately reversed their positions. They may cover their shorts and buy long positions. As seen in today’s trading, that was not the correct thing to do. As a candlestick investor, the trend analysis becomes much easier to evaluate. The simple confirming indicators applied to candlestick analysis will help investors from being whipsawed.

Both the Dow and the NASDAQ opened positive today and started trading positive. However, some very simple analytical tools would have kept the candlestick investor from moving too rapidly. Although prices were moving up, the overall trend analysis still had some indicators that needed to be breached to indicate a trend reversal had occurred. The Dow chart shows the stochastics had come up out of the oversold condition and were heading back down. The downward trajectory was an indication the downtrend had not completed yet. Also, the most compelling confirming indicators had not been breached. A true reversal of a trend requires a close above the tee line.
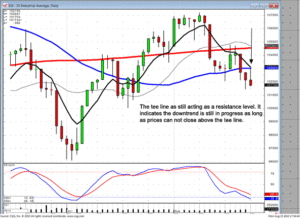
Commodity News Reports, Dow

DOW 

It is understanding how all the indicators work in conjunction with candlestick signals that keeps an investor from being constantly whipsawed. This is a very important aspect of investing. Having patience and allowing proven indicator confirmation to become established. The lack of confirmation will keep the profitability moving in the right direction.

Should there be any buying in this market? On an overall basis, the answer should be no. However, there are chart patterns that reveal strong bullish price trend potential in spite of what the overall market is doing. Our recommendation of MELA illustrates how to utilize the proper signals and patterns. Note how the Scoop pattern is set up with gap up Doji’s. Also, a double bottom is apparent. The gap up in price over the past two trading days clearly illustrates investors aggressively wanting to get into a stock position.
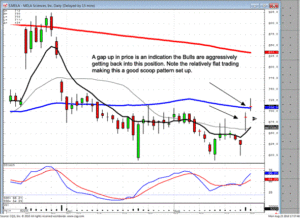
Commodity News Reports, MELA

MELA

These simple visual analytical techniques allows investors to be in the right positions at the correct times. This is not sophisticated analysis. This is merely taking advantage of the information built into candlestick signals. The Japanese Rice traders identified the power moves. Once you have learned how to use this visual analysis to your benefit, you put the probabilities of being in the right positions constantly in your favor.

Chat session tonight at 8 PM — members only

Good Investing,

The Candlestick Forum Team


Current Website Special

Ultimate Candlestick Training Package – ON SALE!!!
Swing Trading – Riding The Wave

A good surfer knows how it works. In order to get the best results, he or she has to know when to enter and exit a wave. Get into a wave too early or too late and you miss the ride. Miss the exit and you could wipe out. This same is true in the stock market where swing trading has the same traits. Considered a cross between day trading and trend following, swing trading suggests that investors hold a stock for a particular period of time, generally between a few days and several weeks, then trade the stock on the basis of its intra-week or intra-month movements.

Not unlike other forms of trading, successful swing trading is dependent on picking the right stocks. The best candidates are usually the large-cap stocks since they are among the most actively traded stocks and their shares will swing between broadly defined high and low extremes. The investor involved in swing trading will ride the wave in one direction for a few days or weeks and then switch to the opposite position when the stock reverses direction.

The Timing Of Swing Trading

Understanding the timing of swing trading requires an understanding of market conditions. Trading during bull or bear markets is different than trading during interim periods. Because of the longer periods of trending in bear and bull markets, the investment strategy of swing trading is different than in times of stock volatility. When the bears or bulls are running, swing trading occurs over weeks and not days since the trends are longer.

What this means is that the best condition for swing trading is when the markets are making very few gains or losses, but they are experiencing a great deal of movement. This allows investors to look at the stock prices and make more trades, since there is a great deal of entry and exit points.

Establishing The Trend

Since the key knowing where to enter or exit a trade depends on understanding the direction of the market, it is important to establish a baseline for your analysis. Most investors use the stock price history that exists in exponential moving averages (EMA). The EMA allows investors who are swing trading to see exactly what a stock is doing over a period that they define. EMA is also used in other investment philosophies such as the Sidus method as investors look for a non-emotional method to evaluate “buying normalcy and selling mania”. This means that for every investor that reacts emotionally to the market, those that are swing trading are looking at the trends and charts and relying in this information to determine the direction that will go. As we have seen all along the way, not reacting emotionally gives investors the freedom to invest wisely.

Investing wisely doesn’t mean that swing trading requires buying at the ultimate low and selling at the ultimate high. While this is the goal of how to invest in stocks, a wise trader with look to be close, but not on the absolute top or bottom of a trend. By not going for the ultimate peaks, swing trading ensures that the investor won’t be damaged by a drastic, unexpected change of direction.

Conclusion

Swing trading is a lot like surfing; catch a wave, ride it until you see it is changing then get out and catch another. The investment timing of swing trading allows investors to do the same thing in the stock market. Using the EMA as a baseline, you can spot directional changes and successfully invest. With swing trading, it’s time to catch a wave!

Predicting Stock Price

Successful day trading as well as successful long term investing depend upon predicting stock price. If predicting stock price sounds like predicting the future it is. Predicting stock price is also reading history! Rice traders in the Japan of the samurai learned that market prices, or more accurately, market price patterns repeat themselves. Market trends come and go and the patterns they contain can be used to predict stock price. Traders using Candlestick patterns as their guide are letting the market tell them what the market will do next. Predicting stock price through Candlestick analysis requires learning Candlestick charting techniques. Traders profit by executing trades when current stock prices fall into a Candlestick pattern. Whether the Candlestick signal predicts a market trend, a market reversal, or a coming market rally, the use of Candlestick trading tactics can turn predicting stock price into counting stock profits.

We all wish we had a crystal ball to tell us the future. The fact is that the future often repeats the past. In this regard it is wise to remember what the author George Santayana said, Those who cannot remember the past are condemned to repeat it. This is, unfortunately the case for many traders. Trying to predict stock price without the benefit of technical analysis tools like Candlestick pattern formations can be risky business. It amounts to forgetting, or ignoring, what the past has taught us. However, traders who use Candlestick chart analysis are essentially using historic price patterns in predicting stock price. It is because the stock market and other markets repeat themselves in predictable patterns that the trader can read the first part of a stock price pattern in order to anticipate the second. By executing well timed trades it is possible to profit from predicting stock price in this way.

Long term stock price prediction is best done with fundamental analysis. A long term investor will look for intrinsic stock value as manifested by expected forward looking earnings. In addition, a margin of safety such as a low debt to asset ratio can be an incentive to add a stock to an investment portfolio. Nevertheless, in buying stocks or selling stocks the investor will want to obtain the best current stock prices. This is accomplished with the use of both fundamental and technical analysis of stocks. While the fundamentals of a company will give us a view of the longer term future it is the day to day and, sometimes, minute to minute market consensus that sets the exact stock price. Using Candlestick signals the trader can commonly succeed in predicting stock price changes and more profitably buy and sell stock.

For the short term trader or long term investor interested in predicting stock price the use of Candlestick signals can be learned at an online Candlestick Forum Boot Camp. Online training webinars will help the beginning investor and trader learn both the basics and the details of successful buying and selling of stocks using Candlestick basics. Learn about Candlesticks and let the past help you predict the future in the stock market.


Market Direction

Candlestick analysis provides tools that not only projects price direction with a high degree of accuracy, but it can also predict a target price within a reasonable price range. Why is this an advantage? Obviously, it allows the investors to make a decision of whether that price move is worthwhile. There will be many chart patterns that are excellent, but the price may have very limited movement before running into a projected resistance level. Obviously, it is much better to find a price move that will move up 30% versus 3%.

This slow steady uptrend of the past few months have allowed many candlestick patterns to perform as expected. One of the expected features is a very strong price move. A Jay hook pattern allows for the evaluation of wave three with a high degree of accuracy. Wave three will usually be equivalent to wave one. Why is this important? If wave one was only a 6% move, then wave three will probably be a 6% move. However, if wave one was a 15% move, they can now be projected that investing into wave three has a high probability of producing a 15% return.

Taking that concept one step further, a price move coming out of a Jay hook pattern can be projected to have a specific price area target. This now becomes a perfect set up for placing an options call spread. Most investors, when they see a potential price move, want to buy the calls. This is often not the best strategy. Buying one set of calls and selling a higher set of calls produces a couple large advantages. First, it reduces the amount of money exposed to the call trade. If the market makes a sudden turn to the downside, the losses will be smaller. If the price does move to the expected target, the percent return will be dramatically higher than merely buying calls outright.
There is a disadvantage to buying a spread. If the price, for some reason, moves well beyond the projected target, the potential of making huge profits is eliminated. But the probabilities become dramatically better by setting up an options strategy that would take advantage of the high probability price move versus the unexpected large price move.

Investor sentiment can be analyzed graphically because of the reoccurring nature of the human psyche. Whether training stocks, options, or commodities, candlestick analysis provides a much more clear visual opportunity for making large profits. This is the result of candlestick signals and patterns performing the same way over and over for centuries.

Predicting Stock Price, Feed Cattle Example

Feeder Cattle March

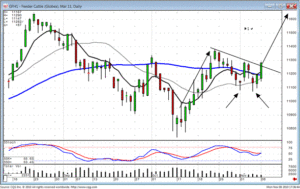
As illustrated in the March feeder cattle, the downtrending channel has been breached. The bottom of the pullback demonstrated indecisive trading, hammer signals. A breach of the 50 day moving average and the declining trend channel makes the prospect of a wave three pattern extremely high. Once an investor has learned which price patterns work effectively, they can now control their own investment results.

Chat session tonight at 8 PM ET for members.

Good Investing,
The Candlestick Forum Team


Current Website Special

Moving Averages Plus Bonus Video

Fall 2010 E-Learning Online Training Schedule

Boot Camp
November 20 & 21, 2010

Website special reflects current newsletter. If you are reading an archived newsletter you will be directed to the  Current Website Special.

Learn How the Stock Market Works

The center of the United States economy is Wall Street where every large company in the U.S. and around the rest of the world is traded on a stock exchange. This article explains to new investors who want to learn how the stock market works what the stock market is all about.

Buying Shares of Stock

When you decide that you want to own stock in a company you must buy shares of stock in that company. Companies that go public allow people to buy shares of their company and therefore these shareholders control the corporation. You cannot buy stock in privately held corporations. Luckily most of the large corporations are publicly held so we can buy from them. The other idea is to find a newer company that is growing very fast to invest in.

Brokers

Once you learn how the stock market works, and you are ready to invest, you need to find a stock broker. A broker is the only person who can make an order to buy or sell stocks. In addition to a stock broker, who researches investments, helps makes goals, and gives investing advice, you can also use a discount broker. A discount broker does not offer advice, does not do research, but instead only makes the transactions that you request. Discount brokers are designed for more advanced traders. Once you put in your order, the brokers discussed above, relay that order to the floor brokers. The floor brokers are responsible for selling and buying stock and they hold a seat on the actual exchange. Once they complete a transaction, the floor broker then reports his trades through computers and then reports back to his firm that he either bought or sold the particular stock.

Types of Orders

Three types of stock orders that a broker can place include the market order, the limit order and the stop order. Once you learn how the stock market works, you can then work with a broker to determine the stock orders that work for you. The market order is the most basic and it happens when a customer asks his or her broker to buy or sell a particular stock at the best price available. The limit order takes more research and requires that the broker trade only when the stock is at a certain stock price or better. The stop order is when the broker is told to sell shares if the stock drops too low, and the price must be specified to the broker so they know exactly when to pull out. This order can save a lot of money for the investor when trading stock.

There is a lot of additional information available for each new investor to learn how the stock market works. It is the information age and more information than you could ever imagine is at your fingertips. Continue to read about the stock market game, and make sure that you acquire the knowledge and education needed to trade successfully in the stock market.

Day Trader

What is a Day Trader?

A day trader is a type of trader who buys and sells financial instruments and then closes out of the market all within one trading day. A day trader may trade financial instruments such as stocks, options, currencies, futures, etc., and the trading strategy used by each individual trader will determine how many trades are made each day. This type of trading style is referred to as day trading. There are two types of traders who practice day trading including the retail trader and the institutional trader.

he retail trader either works alone or with a few other traders and typically trades using his or her own capital. These types of traders utilize the services of a stock broker however they are typically online brokers offering direct access to stock trading software platforms. This type of trader requires the use of fast order entry on the stock exchanges and many will opt to go with an online discount broker rather than a full-service broker.

The institutional day trader works for a financial institution and typically has a lot more resources as his or her disposal. Most of the time they have a team that supports them, a large amount of capital, very expensive and high-end trading software, and more leverage than the retail trader. This obviously gives them a small edge over the market especially considering that they have more funds available to them that allows them to trade more frequently on the markets. In the past before the advent of the internet, there were obviously more institutional traders than retail traders, however now popularity of the retail trader is growing more than ever. Anyone can now decide that they want to practice day trading stock online and for a living from the comfort of their own home.

Most day traders are knowledgeable and experienced in the market place, they have a trading strategy and they have adequate capital at their disposal. They understand their risk tolerance, and are very careful that they have the necessary capital to carry out effective intraday trading. There are many different trading strategies that are utilized when day trading stocks one of which is swing trading.

Swing trading is a trading style that aims to make gains in a stock within one to four days and not necessarily within the same trading day. Swing traders rely on short term stock movements and use technical analysis in order to trade stocks quickly. Technical analysis is the study or price trends and patterns. Technical analysts don’t care about the intrinsic value of stocks, like fundamental analysts because they believe that the value is depicted in the price movements. Fundamental analysis is often used by long term investors rather than for short term stock trading.

For those investors interested in becoming a day trader, continue to do research on the various strategies used by investors. There are many techniques available and the trick is to find an investing strategy that works for you. Join online forums, find a stock trading mentor, and practice as much as possible through online paper trading before attempting to trade with real money.


Market Direction

There are assumptions that can be made about market activity. These assumptions are based upon the reoccurring trading phenomenons that occur year after year. As mentioned in the last newsletter, this is the definition of seasonality. The benefit of knowing the different factors coming from seasonality is that it creates another element for being in the right positions at the right time. Do seasonality factors work consistently from one year to the next? Not always, but they occur often enough to have them as a recognized factor each year.

A simple assumption is that investor activity starts picking back up after the first of September. The kids are back in school. Everybody is back from vacation. The weather starts turning chilly. Investors are back at their desks ready to trade. There is a very simple method for recognizing whether the common price occurrences are occurring this year like they did in the past. Candlestick signals become a valuable tool for recognizing whether a seasonal pattern is about to occur again.

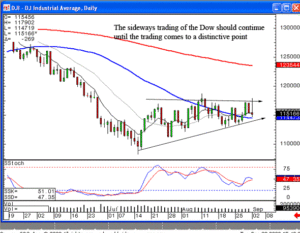
That philosophy can be put into the trend analysis of the markets in general. If the Labor Day weekend signals the end of the summer and many traders are coming back to their desks, they usually will have a more distinct investor bias. This is especially true if the market indexes have created some sort of pattern prior to everybody coming back to their desks. Unfortunately, the lack of direction can be further emphasized if the previous market conditions did not show any specific patterns up. The Dow has been trading sideways for the past two months. Today’s trading could have provided the message that new investor sentiment was coming into the market. That would have been illustrated by a strong bullish day, after last week’s attempt of a rally. However, the failure of the morning ‘buying’ merely signals that any new trading coming into the market was also cognizant of the previous flat trading.

Day Trader, Dow Example

DOW

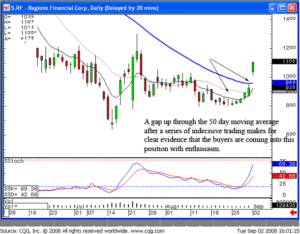
The continuation of a sideways mode is still very likely based upon the lack of direction today. Crude oil prices were trading Dow below the 200 day moving average. This should have been a great stimulus for the Bulls. When all factors continue to demonstrate the lack of enthusiasm for either bullish or bearish movement in the market, it has to be assumed that what ever ‘has been’ working or not working should still continue. The past few weeks has revealed strength coming into the financial stocks. Simple logic dictates that when many stocks in the same sector are moving well, that is usually an indication that the big money likes the sector as a whole. This may seem like a very simplistic statement but it becomes much more evident through the graphic illustrations of candlestick signals.

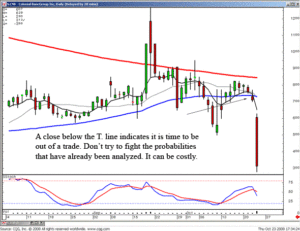
Day Trader, CNB Example

CNB

Day Trader, RF Example

RF

Usually the first day after the Labor Day weekend is the beginning of the more heavily traded part of the year. There will usually be a signal as to what investors are feeling coming back from their summer vacations. Today’s trading started out very bullish but faded in the afternoon. This is an indication that the pre-existing sideways mode of the market is still in process. This makes some of the trading techniques very difficult to be profitable. As illustrated earlier in the summer, specific sectors may be bought but then held during the slow grinding market. Earlier in the summer, it was the oils that produced the profits. Currently, the financial stocks are showing strength.

Investing should not be a difficult endeavor. Candlestick signals make bullish and bearish pressure very obvious. Most technical trading methods use indicators that confirm the results of a price move. Candlestick signals provide the evidence that a price move is in the process and about to change direction. This allows for much better entries than those techniques established more for the confirmation that a trend has reversed.

Seasonality Presentation

Thursday September 11, Best Choice software will be presenting the benefits of utilizing the information seasonality conveys. Seasonality, just like candlestick signals, provides information to put the probabilities in the investors favor. Combining seasonality information with candlestick signal confirmation produces a powerful trading platform. Having the knowledge of when specific Stock prices or sectors will usually act the strongest, and then being able to confirm it was candlestick signals, dramatically improves the probabilities of being in the right places at the right time. Mark your calendar! This is information that you can use year after year.

No chat session tonight.

Good investing,

The Candlestick Forum Team

Website special reflects current newsletter. If you are reading an archived newsletter you will be directed to the
Current Website Special.

Private Training Sessions for Small Groups

Scheduling for  August 9th- 12th  Sessions fill quickly – Resister early


Hold onto your hat because Stephen Bigalow’s private training sessions are mind-frying!  Two intense days of education beyond compare. Your ability to see the best trading opportunities will excel and he will alter your investment perceptions forever! All Session Graduates receive 12 months of free membership to the Candlestick Trading Forum.

Location of the private training will be located at the beautiful shores of Keuka Lake in the finger Lakes of upstate New York.

Session Outline

All the materials covered in our Candlestick Analysis Technician – Level 1
plus individualized training where YOU set the pace. No waiting for Q&A periods, ask-as-you-go  where YOU need it!

After the first day you will be able to:

  • Identify the best possible signals
  • Identify false signals and how to avoid them
  • Learn the psychology that developed the signals
  • Gain important insights into the sentiment of the investing community
  • Establish the correct parameters for the best possible profitable trades
  • Analyze the market indexes and correlate them to high profit trade strategies
  • Learn to enter positions to maximize profit probabilities
  • Use the discipline to eliminate emotion and common investing mistakes

At the end of this day you will surely work up a healthy appetite. Join Mr. Bigalow, as his guest, for some tasty cuisine! 

Day 2 – Morning Session

Candlestick Analysis Technician – Level 2 – Advanced Chartist
Advanced Pattern Recognition
Combining Candlesticks with other Technical Indicators
Candlestick Applications in other trading entities
After this session, you will be able to:

  • Learn the high profit trading patterns with the incorporation of Candlesticks
  • Trade commodities and futures with total confidence using Candlestick Analysis
  • Eliminate emotion from your investing, using the Candlestick portfolio cultivation program
  • Dissect investor psychology – learn how to identify high profit trade set-ups
  • Combine your existing trading system with very extensive stock trading search software

Day 2 – Afternoon Session – Bringing it all together

Mesh your Candlestick trading techniques into your specific trading system best suited to your lifestyle and portfolio size. This is where semi-private sessions provide the opportunity to work with Steve, and your intimate trading group, for devising a personalized game plan.

You may feel overwhelmed with all the information covered over this 2-Day workshop. You should not expect to become proficient in one weekend. The main goal is to train your thought process to recognize profitable trade opportunities. Over the next six months, you will improve your profitable trade ratio immensely as a  Member of the Candlestick Trading Forum. (Your workshop fee includes six months of free membership) Continue to work with the support of Steve and fellow Candlestick Analysis Technicians in our Members Only Live Trading Room.

Once you have learned the Candlestick investing concept, your investment perspectives will be dramatically altered. The two day concentration of learning the Japanese Candlestick method will advance your investment results by many months. Gone will be the “hoping” that the next trade will work. It will become an expectation that the majority of your trades will produce profits, a function of probabilities. You will go to sleep at night anticipating the signals will produce a profitable day for your portfolio the next day.

The culmination of information revealed to you over the weekend will be the basis for your being able to produce 5% to 10% monthly returns. These are returns that you will not ever receive if you rely upon the “normal” Wall Street advice. Keep in mind, the Japanese rice traders who developed the original Candlestick trading method made fortunes that dwarfed those of the lords of Japan. This is not an ordinary investment concept!


Steve sends you home with plenty of reference materials to reinforce your weekend session. 

Over $1,600 worth of training products included in the $4,900 training fee.

Steve’s 2-Day Training Seminar Downloadable Videos

Candlestick Analysis Technician CD Set
High Profit Candlestick Patterns

Your autographed copy of Steve’s book.

Candlestick Major Signals Mouse Pad  

The Major Signals Mouse Pad

Trading Rules to Successful Profits EBook  

Trading Rules to Successful Profits

PLUS

12 months membership to The Candlestick Forum
$907


These sessions fill quickly!

Contact our office as soon as possible to reserve your seat or call 1-866-251-4015

Registration fee includes; lunch and dinner with Stephen Bigalow. Air travel, transportation fees and Hotel not included. (Please check with us if you would like information for Hotel accommodations.)

Contact Us  to be included on our email notifications of upcoming sessions, or to schedule your own private group.


To speak to Mr. Bigalow personally about these private sessions, or for more information, call our toll-free number at 1-866-251-4015. We look forward to talking with you soon!

Balancing a Stock Portfolio

Balancing a stock portfolio is done to increase profits and reduce risk in stock investment. A stock portfolio is the collection of stocks that a person owns. In picking stocks for a portfolio an investors seeks diversification of his investments. Diversifying a stock portfolio helps reduce investment risk and increases opportunity to hit an investment home run. Balancing a stock portfolio typically requires that investors purchase stock in several different market sectors. Buying large cap stocks, mid cap stocks, and small cap stocks is also an investment strategy used in balancing a stock portfolio. The investor goes about picking stocks as always but he purposely does not buy stocks in the same industry. It is possible to use a portfolio management service but investors or traders balancing a stock portfolio should know how to do their own fundamental and technical analysis. Scouting out stocks in crisis and buying at the bottom of the price curve is a viable strategy. Using Candlestick analysis to anticipate market trends and market reversal is integral to managing and balancing a stock portfolio.

In balancing a stock portfolio the investor will decide first upon his investment goals. Long term investing will require a different approach from short term investing. Older investors typically pick stocks with less risk but also lower reward potential. Younger investors commonly invest in stocks with more growth potential but which often are more risky. One approach to diversifying a stock portfolio is to balance risk. One or two stocks in a portfolio may be risky growth stocks while others will be dividend stocks which offer low growth potential but long term security. Microsoft in its younger years was a growth stock. Today it offers security and a dividend but little opportunity for the exponential growth of two decades past.

Investing in stocks in several market sectors is a common approach to balancing a stock portfolio. By not putting all eggs in one basket, or market sector in this case, the investor will not be hurt by economic events the affect the whole sector. By purchasing stocks in more than one sector the investor increases his chances for picking a big winner. However, it is not the mere act of picking more than one stock that makes balancing a stock portfolio successful. Use of both fundamental analysis and technical analysis with Candlestick pattern formations allows the investor to search for stocks that have the potential for near term rapid growth as well as long term stability. In balancing a stock portfolio the investor can choose different strategies for each of his stock picks. He can invest in high tech in bio technology, banking to take advantage of a growing economy, or big oil companies if he believes that prices will rise. He should limit the number of stocks in his portfolio to the number that he can comfortably follow with Candlestick charting techniques in order not to buy a stock for which market sentiment promptly changes. Balancing a portfolio is never an excuse for not watching the performance of each and every stock that one owns.


Market Direction

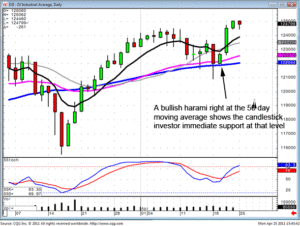
Support and resistance levels are very important factor in investing. They become more important when utilizing candlestick signals. Whereas most technical trading methods require additional confirmation at a support or resistance level, candlestick analysis has the benefit of being able to immediately identify what the investor sentiment is doing at those levels. As seen in the Dow chart, it appeared as if the 50 day moving average was going to act as support. That was more confirmed by witnessing a bullish Harami at that level. As a candlestick investor, that provided additional confirmation that the downtrend had stopped at the 50 day moving average. Upon seeing bullish trading the following day was an immediate sign that moving average was considered a support level.

The uptrend is continuing while demonstrating obvious profit-taking during the trend itself, as well as intraday profit-taking. This makes for a strong and steady uptrend. The continued profit-taking reduces the probabilities of exuberant buying followed by rapid selling. This allows individual stock prices to produce high profit patterns. Whether trading stocks or commodities, support and resistance levels are very important factor for profitable trading.
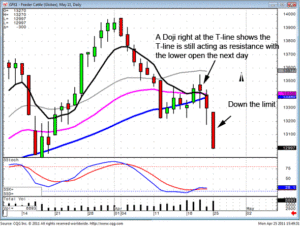
As can be seen in the May feeder cattle, a long legged Doji right at the T-line showed indecision. A lower open the following day showed the direction of the market was going to move in the direction of how they open it which would also indicate the 50 day moving average might not be acting as a support level anymore. A breach of the 50 day moving average resulted in a profitable trade for the short seller.

Balancing a Stock Portfolio, DOW

DOW

Balancing a Stock Portfolio, May Feeder Cattle

May Feeder Cattle

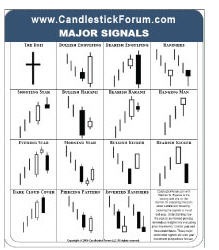
Each signal and pattern represents hundreds of years of observations. Do not ignore the probabilities of candlestick signals. They are created by nothing more than the force of investor sentiment. Learning how to utilize candlestick signals is not a difficult process. Understanding the 12 major signals, six long signals, and six short signals allows a candlestick investor to evaluate a price move with much greater accuracy and depth than all other technical analysis. This does not necessarily mean other technical trading methods do not have merit. Adding candlestick analysis to those trading methods will greatly enhance their accuracy.

Members training – members, Mark your calendars – May 7 – This will be a FREE three-hour training and review of the 12 major signals. For new members, this is an excellent method for reinforcing your learning process of the major signals. Hearing what occurred in investor sentiment to form the signal at the same time of witnessing what it did as regards of the trend greatly improve your understanding of where and why a trend is doing what it is doing. This becomes extremely valuable analytical information. This information allows investors to master their own investment decisions versus hoping for mediocre results from money managers.

Chat session tonight at 8 PM ET for members.

Good Investing,

The Candlestick Forum Team


Current Website Special 

Trading Breakout Patterns

Website special reflects current newsletter. If you are reading an archived newsletter you will be directed to Current Website Special

Winning Stocks – How To Pick A Winner

Don’t know anything about stocks, is that what you said? Well, you may be a beginner investing in the stock market, but you probably know a lot more about stocks and the companies behind them than you think. Do you own a computer? You probably know something about the company that makes it based on your experience. Drive a car? Buy your pizzas from a particular chain? Do you use soap? If not, we don’t want to know, but the point of this is clear; the things that you use as a consumer gives you a list of potential companies for investments. A significant part of picking a winning stock is knowing the company and its products where you will be investing.

Picking a winning stock is neither science, brain surgery nor voodoo; picking winning stocks is the result of having a solid stock investing system, sticking to it and using research to identify good investment opportunities. Picking winning stocks simply means that if consumers use and like something, its value will increase and the stock price will rise. The more well-received the product is, the more value it has in the stock market.

On the Alert

Once you realize that picking a winning stock isn’t so intimidating, you can start looking at companies differently. What do I use, what do my kids like, what about my friends? Not everything is a good investment just because everybody uses it, but let’s look at a couple of examples of investment options based on this theory.

Ever heard of Microsoft? This “little” company came out of nowhere to revolutionize the personal computer. Now 95% of PC’s have Microsoft software and the company’s stock is considered a large cap stock and a very good investment. What about Dell Computer? This company was started in a college dorm room and is now the largest manufacturer of personal computers.

Companies such as these didn’t reinvent the wheel; they just got very good at marketing it successfully. There are people that think Windows isn’t the best operating software on the market; there are others that don’t like Dell computers. The key with these companies is their end-user focus and their ability to build an overall brand image that is superior to that of their competitors. These winning stocks became stock sector leaders by correctly focusing their efforts on reaching the customers.

What’s the Secret for the Investor?

The good news is, there is no secret to finding and selecting winning stocks; the bad news is that you need to invest a little effort. Whether you locate a prospect through observation, watching the news, or using a stock screener, you’ve only taken the first step. After this you need to do some research: fundamental analysis of the company, technical analysis of its earnings, and candlestick chart analysis of its stocks. By doing this you should be able to eliminate the companies that appear desirable but don’t have the actual strength to be included in your portfolio.

Conclusion

Many times you will find that you do have a good eye for investments; you will be able to look at a company and have an idea if you will want to include them in your stock portfolio. It is important to remember there is no substitute for doing your homework. Technical and fundamental analysis are the ultimate keys to locating winning stocks. Companies that have winning stocks usually have excellent customer focus. So what products did you use today that you can convert into winning stocks?

Selecting a Commodity Broker

One of the most important decisions that an investor will make does not include purchasing an option or future; this decision is choosing a commodity broker. Understanding the dynamics involved in choosing a commodity broker is as much about understanding yourself as it is getting to know the commodity broker. Since commodity trading can be more involved than trading stocks, it is more important to select the right commodity broker than it is to select the right stock broker.

About Commodity Futures and Commodity Brokers

By definition, a commodity market is the location where sellers and buyers are about to conduct business in futures trading. A commodities trading contract is a legally binding agreement that defines an asset, the quantity of that asset to be delivered and the month when it will be delivered. A margin is invested to purchase the contract and the full balance of the contract is only required if the buyer takes delivery. If a commodity contract is purchased, the correct term is to “take delivery” and if a futures contract is sold, it is referred to as “making delivery.”

Commodity future contracts can be written for any type of commodity such as gold, lumber, livestock, currency, and many others. There are several different futures markets that handle specific types of commodities, such as the CME (Chicago Mercantile Exchange), NYBOT (New York Board of Trade), CBOT (Chicago Board of Trade) and others.

Futures exchanges are regulated by strict guidelines, both imposed by the government and internally, and they are require that trading is done “in the pit”, which means that transactions are handled by commodity brokers that are licensed and have paid to be in that position. These commodity brokers serve as the connection between buyers and sellers. Such an important link requires that you select someone that is not only an excellent commodity broker but someone that can identify your investment shortcomings and help to overcome those flaws.

Two Types of Commodity Brokers

There are two types, or levels, of commodity brokers and the level of service they provide is based on the needs of the investor: full service and discount. Each type of commodity broker has advantages and disadvantages that should be considered when making a decision.

Full Service Brokers

This type of commodity broker is usually recommended for new or inexperienced investors, or for those investors who invest in numerous markets. Full service commodity brokers usually provide more information, advice and help to their clients; they often work with investors to create personalized investment strategies. The fees charged by these commodity brokers are generally higher because of the extra level of service they provide. Full service brokers that specialize in trading commodities are also known as Introducing Brokers.

Discount Brokers

This type of commodity broker typically works better for more successful traders. Discount brokers can charge less for the services that they provide since they provide a smaller range of services.

How Do You Find the Right Commodity Broker?

Finding the best commodity broker for you is more a product of knowing your tendencies than anything else. Remember that your ultimate investment philosophy is to make money and your commodity broker’s job is to help you do that. Some of the traits that you should seek in your commodity broker are:

Experience

Chances are if your commodity broker doesn’t have much experience, the results you receive will be spotty at best. You don’t want your commodity broker to learn how to invest at your expense. Not only is experience in general important, but experience in the commodities where you want to trade.

Support

While a commodity broker may tell you about world-class support, what you get after you sign on is what’s important. If you are considering a particular commodity broker, call and ask for an explanation of the difference between bull call spread and a bear put spread; the level of response you get may be a good indication of the support you will receive after you open your commodity account.

Trial Period

Many commodity brokers will give you a free trial to “test drive” their service. Take advantage of this offer and see what happens. Remember that part of sampling something is trying to find out if it is good, no just trying to find out if it’s bad.

Conclusion

Choosing your commodity broker is one of the most important decisions you will make during your investing career. Successful trading can be the result or the victim of a commodity broker decision. Find a reputable broker that meets your needs and compensates for your shortcomings and you are on the road to investment success.

Bearish

What does it mean if the market is considered to be bearish? In today’s article we explore what a bear market is as opposed to a bull market, as well as what a bear raid and a bear tack are as it relates to the stock market.
A bear market is a market condition in which the prices of stock or other securities are falling. It is also marked by widespread pessimism that causes negative market and investor sentiment that does not change for a while. Stock investors will anticipate more losses in this market as selling of stocks and other securities continues and causes pessimism in the stock market to continue. Analysts consider an entry into a bear market when there is a downturn of 20% or more in multiple market indexes over at least two months.

Bear markets should not be confused with a correction. Corrections are short term trends that occur for less than two months. While the correction may appear bearish in nature, you have not entered a true bear market unless the conditions described above have been met. The market indexes that a bear market can occur in are indexes such as the S&P 500 and the DIJA.

When investing in the stock market it is important to understand what signifies a bullish market. A bull market is characterized by optimism and investor confidence. The expectation of market players is that the strong results will continue.

Where were the terms bear and bull derived from?

The use of the terms bull and bear market where derived from the way animals attack. A bear swipes its paws down whereas a bull thrusts its horns up into the air. These actions act as metaphors for the movement of the markets. These terms can refer not only to the stock market, but also to commodities, forex, bonds and other financial instruments and their markets.

A bear raid is the illegal practice of attempting to push the stock price lower by taking short positions and spreading unfavorable rumors about the target firms, which was a popular practice back in the early 1900’s. A bear tack is a decline in the price of a stock, market sector, market, or investor sentiment that assumes a fall will occur soon. It is a buzz word that refers to bearish movements in the short to medium term.

Continue to expand your knowledge and learn more stock market terminology. There is a lot to learn and the proper education in absolutely necessary to successfully invest in the stock market.


Market Direction

The forces of a trend are not dictated by one candlestick signal. It is an accumulation of information provided by the charts that make for  the accurate analysis of a price trend. Will there be sell signals in an uptrend? Definitely yes. Will there be buy signals in a downtrend? Definitely yes. The importance of analyzing a chart is to recognize the signals and its correlation to the surrounding indicators. Those indicators are made up of other candlestick signals as well as the locations of the moving averages and stochastics.

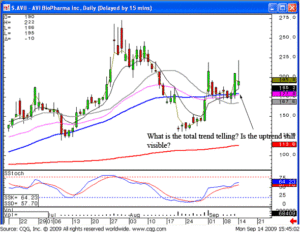
Will there be selling in an uptrend? Will a stock open lower the next day after a very bullish candlestick signal? The answer is yes and the frequency of these situations is relatively common. As illustrated in the AVII chart, after the price created a Jay hook/cradle type pattern on Friday, it opened much lower on Monday. Should this cause concern? Yes, but only to the point of keeping a closer eye on it during the trading day. Does the lower open mean the sellers are in control? That concern becomes diminished when observing the potential of a Jay hook pattern, the support that seem to sustain itself on the tee line and the stochastics appear to confirm a Jay hook pattern probability.

Bearish, AVII

AVII

Many investors lose a portion of their income to panic selling when the price appears to go against the current trend. Analyze the whole chart picture, not one specific trading day. The probabilities work greatly in your favor when you allow the chart pattern to work itself out. As witnessed in today’s trading, AVII opened lower, used the tee line as support, then experienced more bullish participation. Before bailing out of a position early in the day, ask yourself whether the chart pattern is in a bullish trend, a bearish trend, or in the reversal stages. Making that simple assessment will often keep you in a position, allowing the full trend to work itself out.
That same analysis process can be used when analyzing the markets in general. ‘Selling’ days in an uptrend do not necessarily indicate a change of trend direction. Indecisive candlestick formations forming in a pullback,after an uptrend, has much different connotation than decisive selling days in a pullback. The more you understand and become knowledgeable on what each individual and signal depicts, the more accurately you will be able to assess a price move.

Bearish, DOW

DOW

Bearish, NASDAQ

NASDAQ

This becomes extremely important for the more leveraged a trading program becomes. The option trader needs to have a very clear and concise understanding of price trend movements. Candlestick signals benefit in this area dramatically. Option trading requires very fast and accurate decision-making processes. Candlestick analysis makes trading options a much more viable and disciplined trading program. Entry and exit strategies will become much more fined tuned with the graphic portrayal of investor sentiment. Take advantage of the information provided by each individual signal. Applying that information to the current chart pattern allows an investor to make educated assessments of what the next price move should do.

Chat session tonight at 8 p.m. ET

Good investing,

The Candlestick Forum Team