Archives for November 2019

Commodity Volatility

Commodity volatility can be significantly more than volatility in interest rates, and foreign currency exchange rates. Measured commodity volatility as reported in standard deviations in price variability historically does not settle below 15 percent and often rises to more than fifty percent. As a rule supply and demand are the main factors in commodity volatility. Commodity suppliers and commodities buyers often stockpile in order to maintain price stability but when shortages occur either due to production failure or rising demand commodity prices can go up dramatically. It is commodity volatility that makes trading commodities profitable for traders. Using both fundamental and technical analysistraders can profit by accurately predicting commodity price changes. Commodity and futures training can help someone beginning commodity futures trading to understand the use of technical analysis tools such as Candlestick chart formations in trading commodities.

It is the volatility of commodities markets that leads producers and buyers to hedging to protect their investment risk. By hedging, an agricultural cooperative, for example, will sell corn futures in order to guarantee a stable price for part of their production. Oil refiners will buy oil futures to guarantee a set price a year or more hence. Hedging commodities is used throughout the commodities markets and supplies the majority of trading volume. Traders who speculate on commodity volatility can thank the major players in the commodities markets for the volume and liquidity that routinely make profitable commodity trading possible. The volatility of some commodities becomes a social issue when the prosperity of a third world country depends upon high prices for commodities such as coffee, bananas, and cocoa. Unfortunately commodity market history shows us that commodity volatility has always been with us and, probably, always will. Only with an effective hedging strategy can producers protect themselves from devastating market fluctuations. However, such strategies often require the kind of political and economic stability that emerging nations sadly lack.

For commodities traders it is the volatility of the commodities markets that makes trading commodities financially attractive. Going back centuries rice traders in the Japan of the Samurai developed a set of tools to take advantage of the ways in which the commodity prices, driven by commodity volatility, repeat themselves. The development of Candlestick chart analysis allowed traders to let the market tell them what the market would do. This is still true today as traders use Candlestick chart patterns to predict price movement and determine where to most profitably trade. Candlestick pattern formations are not only useful in making sense of commodity volatility futures trading but also in helping to make decisions in options trading of commodities futures. The combination of volatility with high volume and high liquidity allows traders to enter and exit trading positions at relatively low cost. A fluid market allows for more accurate technical analysis. However, the trader needs to pay attention to the market as commodity volatility can change a profitable day into a loss when the trader does not stay tuned to his or her trading signals.


Market Direction

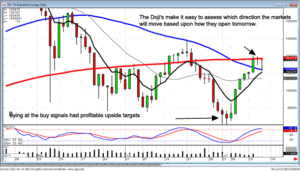
Targets! Candlestick analysis allows an investor to dramatically improve profits by analyzing where there is a potential target. More importantly, candlestick signals convey the correct information of what to do once a target is reached. Note in the Dow chart, the trend reversed based upon a simple analysis of candlestick reversal signals occurring in the oversold condition. What becomes a potential target from that level? It could be seen at the 50 day moving average had acted as resistance during mid-June. It could also be seen that the 200 day moving average at acted as resistance at the end of May and the beginning of June. Putting on long positions during the first week of July was done with the idea the Dow could move back to the 50 or the 200 day moving average. That analysis at least provided enough room to make some profits.
Commodity Volatility, Dow

DOW

Most investors have a hard time taking profits. They either get out too early, in fear of giving back their profits, or they get out too late because they were afraid that if they sold, the prices would continue higher without them. Candlestick analysis  eliminates those fears. As can be seen in the Dow chart, the 50 day moving average did not act as resistance. The 200 day moving average is showing resistance. What should be done from this level? Without the use of candlestick rules, that becomes a hit or miss decision by most investors. The candlestick investor has the advantage of knowing what each signal is representing. Wednesday’s trading showed a Doji right at the 200 day moving average. Weaker trading on Thursday would indicate profit-taking. The profit-taking occurred but the Bulls took the price right back up to the top of the trading range. Thursday’s trading bounced up off the 50 day moving average. This would be an indication the 50 may now be acting as support. The late afternoon buying formed a Dragonfly Doji/Hanging Man signal. Stochastics are in the overbought condition.

Does knowing this information help project where the market is going to move from here? No, but it does allow the investor to take action based upon what it does do from here. Weaker premarket futures tomorrow would make the Hanging Man signal, forming at the 200 day moving average, the predominant signal. That would indicate that after three days of trying to push through the 200 day moving average, the Bears were starting to take control again. On the other hand, if they open the market positive tomorrow, after Thursday’s profit-taking day, they would be opening positive after a Doji day. This indicates they will be moving the trend in the direction of how they open it after a Doji. This is not rocket science analysis. This is merely common sense interpretation of what is provided by the signals. The Japanese Rice traders did not make this analysis difficult. They made it very easy to understand and profitable.
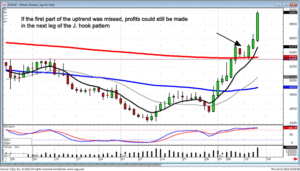
It is painful to miss a strong price move. Fortunately, being able to analyze what a price pattern should do allows for grabbing some of the profits during that price move. Note how the September wheat chart showed a very strong price move after a Bullish Engulfing signal. Most investors would whine and complain that they did not partake in that price move. However, knowing that a strong price move has the potential of forming a J-hook pattern allows an investor to still make profits.
Commodity Volatility, September Wheat

Wheat Sept

Note how the price move above the 200 a moving average, formed a Bearish Harami, followed by a Doji on the 200 day moving average. This was a setup for a potential J. hook pattern. Knowing that, an investor could take advantage of the next leg up. Profitable trading is not getting every big price move. Profitable trading involves knowing what to do at the appropriate times of a price trend.

Take the opportunity to learn candlestick analysis from A-Z. The methodical teaching method produced by Stephen Bigalow allows an investor to gain valuable insights into their own nature. This year, the Candlestick Forum private training session is being conducted on Keuka Lake in upstate New York. You will gain valuable knowledge on how to trade/invest successfully. At the same time, you will have the opportunity to enjoy the lake surroundings of one of the nicest lakes in the Northeast. Please take the time to investigate the information about this private training session. It may save you thousands upon thousands of dollars of needless market trading mistakes. You will gain a new perspective on how to take profits consistently out of the market.

Click here for private training session information.

Chat session tonight 8 PM ET

Good Investing,

The Candlestick Forum Team


Current Website Specials

Commodity Training

Profitable Candlestick Trading

Options Training Webinar 

Click here for details

Website special reflects current newsletter. If you are reading an archived newsletter you will be directed to the Current Website Special
RSS Articles – Continued

Stocks to Buy – Stocks to Buy When Long-Term Investing
Selling Shares – Selling Shares
Buy Shares – Buy Shares
Stock Trading Strategy – Stock Trading Strategy for Day Traders
Learn the Stock Market – Learn the Stock Market Basics
Trading for Dummies – Trading for Dummies in the Forex Market
How to Invest Stocks – How to Invest Stocks
Investing Basics – Investing Basics for Beginners
Blog Articles – May 2009
Investing for Beginners
Investing Tips
Investing 101
Stock Share
Charting Stock
Stock Markets
Buy Stock Online
Brokerage Firms
Trading After Hours

Currency Foreign Exchange – Currency Foreign Exchange
Basic Stock Information – Going Back to The Basics
Growth Stocks – Growth Stocks
Stock Investor – What is a Penny Stock Investor?
S&P 500 – S&P 500
Margin Trading – Margin Trading
Buy Stocks Online – Buy Stocks Online
Blog Articles – April 2009
Stocks and Shares
Stock Information
Stock Market Index
Bonds and Stocks
Trading Broker
Stock Advice
Stock Market for Beginners

Stock Shares – Basics of Stock Shares
Charting – Charting
Stock Market Trading – Stock Market Trading Tools
Fibonacci Trading – Fibonacci Trading
Short Sell – Short Sell
Trading Education – Trading Education
Shorting Stocks – Shorting Stocks
Futures and Options – Futures and Options
Trading Tools – Candlestick Charts
Blog Articles – March 2009
Trading Currencies
Short Selling
Day trading
Volume Trading
Spread Trading
Stock Trend
Market Timing
Price Stock
Investing Stock

Trading Analysis – Types of Technical Trading Analysis
Elliot Wave – The Elliot Wave Theory
Harami – Harami
Short Term Trading – Short Term Trading
Forex Strategies – Forex Strategies
Options Trader – Options Trader
Make Money Trading – Make Money Trading
Forex Trading Strategies – Forex Trading Strategies
Blog Articles – February 2009
Day Trade
Practice Trading
Options Strategies
Stock Market Prices
Stock Option Trading
Buying Shares
Forex Analysis
Forex Account

Commodity Market – Commodity Market
Buy Currency – Buy Currency in Pairs
Forex Online – Forex Online
Forex Candlestick – Forex Candlestick
Psychology of Investing – Psychology of Investing
Buy Stocks – Buy Stocks
Investment Management – Investment Management
Blog Articles – January 2009
Dividends
Shares
Stock Market
Trading Psychology
Online Forex
SSF
Futures Market
Online Forex Currency Trading

Futures – Futures Market
Options Investing – Introduction to Options Investing
Trading Online Stock – Trading Online Stock
Invest – Invest Online with Japanese Candlesticks
Online Trades – Online Trades in the Stock Market
Brokerage – What is a Brokerage Firm?
Stock Trades – Penny Stock Trades
Online Stock Investor – Fundamental vs. Technical Analysis
Blog Articles – December 2008
Swing Traders
Online Stock
Stock Price
Online Stock Trades
Trading Online
NASDAQ

Buying Stocks and Shares – Buying Stocks and Shares
Buying Stocks Online – Buying Stocks Online
Futures Education – Futures Education
Candlestick Charting Techniques – Candlestick Charting Techniques
Stock Trading Tips – Stock Trading Tips
Investment Knowledge – What is your Stock Investment Knowledge?
Blog Articles – November 2008
Stock Trading Terms
Alternative investments
Technical Analysis Charts
After Hours Trading
Stock Market Investment Basics
Moving Average
Buying Stocks on Margin
Short Selling Stocks
Trend Stock Trading

Trading Shares Online – Trading Shares Online
Hedging Strategy – How to Determine Your Hedging Strategy
Option Investing – Option Investing
Trading Futures Contracts – Trading Futures Contracts
Stock Price Volatility – Stock Price Volatility
Commodities Tips – Commodities Tips for New Investors
Commodities Trading Online – Introduction to Commodities Trading Online
Trading Commodities Online – Trading Commodities Online
Blog Articles – October 2008
Why Trade Currencies
Forex Introduction
Stock Trading Online for the Beginner Investor
Commodities Traders
Commodities Exchange
Paper Trading
Stock Trading Rules
Stop Orders
Candlestick Stock Charts

Stock Day Trading – Stock Day Trading Tips
Trend Trading – Trend Trading
Traders – Traders in Commodities
Technical Analysis of Stock – Technical Analysis of Stock
Stock Traders – Types of Stock Traders
Trading Strategies – Trading Strategies for Playing the Stock Market
Online Stock Broker – Online Stock Broker
Trading Stocks Online – Trading Stocks Online with Japanese Candlesticks
Candlestick Pattern – Candlestick Pattern Reversals
Blog Articles – September 2008
FX
Online Brokers
Online Day Trading
Stock Trading Education
Trade Stocks
Technical Indicators
Temporary Short-Selling Rules

Day Trader – What is a Day Trader?
Trading on the Stock Market – Momentum Trading on the Stocl Market
Stock Picks – Stock Picks for Penny Stocks
Stock Option – What is a Stock Option
Short Term Stock Trading – Short Term Stock Trading
Trading Shares – Trading Shares in the Stock Market
Learn Online Stock Trading – Learn Online Stock Trading
Stock Market Day Trading – Stock Market Day Trading Strategies
Penny Stock Trading – Penny Stock Trading
Blog Articles – August 2008
Learn Stock Trading
Stock Market Trading Strategies
Technical Stock Trading
Professional Stock Trading
Japanese Candlestick Charting
Trading Strategy
Stock Trading Charts
Stocks
Currency Market

Stock Trading Terminology – Quick Look at Stock Trading Terminology for Beginner Investors
Stock Trading Strategies – Stop Trading Strategies
Trading in the Stock Market – Trading in the Stock Market Using Technical Analysis
Day Trading Stocks – Day Trading Stocks
Doji Candlestick – Doji Candlestick
Trading Stocks for Beginners – Quick Introduction to Stock Trading
Investment Firms – Investment Firms Online
Blog Articles – July 2008
REIT Stocks
Best Stocks
Trading Stock On Line
Candlestick Patterns
Bullish

Buy Bonds – How Do I Buy Bonds
Stock Options Trading – Stocks vs. Stock Options
How To Invest Money – How To Invest Money in The Stock Market
Online Trade – Methods Used to Profit from an Online Trade
Hot Penny Stocks – Hot Penny Stocks
Learn How The Stock Market Works – Learn How The Stock Market Works
Blog Articles – June 2008
Investment Strategy
Stock Market Investment
Investment Online
Invest Money
Australian Stock Market
Corporate Bonds
American Mutual Funds
Investment Opportunity

Forex System – Forex System
Best Penny Stocks – Best Penny Stocks
Fibonacci Trading Techniques – Understanding Fibonacci Indicators in Technical Analysis
Forex System – Forex System
What Are Mutual Funds? – What Are Mutual Funds?
Forex Market Education – Forex Trading Education
Stock Market Education – Stock Market Education
Trend Analysis – Trend Analysis
Investing in Bonds – Investing in Bonds
Trade Mutual Funds Online – Learn the Basics to Trade Mutual Funds Online
Blog Articles – May 2008
Buy Gold
Market Analysis
Investment Software
Forex Trading Platform
Online Investing Education
Best Mutual Funds
Forex Online Training
Investment Manager
Forex Charts

Stock Market Basics – Stock Market Basics Revisited
Online Stock Market Trading – Online Stock Market Trading Using Japanese Candlesticks
Stock Trading Software – What Are The Advantages?
Technical Analysis – Technical Analysis and Japanese Candlesticks
Investment Timing – Improving Your Results With Candlestick Trading
Investment Options – Investment Options Can All Be Enhanced With Japanese Candlesticks
Learn How to Invest – Learn How To Invest Using Japanese Candlesticks
Stock Investing for Beginners – Made Easy With Candlestick Signals
Stock Market For Dummies – Made Easy With Candlestick Signals
Learn Forex – How to Learn Forex Trading
Setting Stop Loss Orders – Also Called ‘Stop Market Order’ or ‘Stop Orders’
Forex Currency – Forex Currency Trading
How to Pick Stocks – How to Pick Stocks When Penny Stock Investing
Over The Counter Stocks – Over The Counter Stocks
Top Mutual Funds – Finding The Top Mutual Funds
Learn Online Investing – Learning Online Investing
Mutual Funds –  Mutual Funds
Blog Articles – April 2008
Foreign Currency Exchange
Money Market Mutual Funds
Online Trading Course
Foreign Currency
No Loan Mutual Funds
List of Penny Stocks
Trade Forex
On Line Stock Trading
Forex Training

Investment Opportunities – Investment Opportunities in the Stock Market
Real Estate Investment Trusts – What are Real Investment Trusts
How To Buy Stocks – How to Buy Stocks
Online Investing – Online Investing Tips for the New Investor
Trading Stock – Trading Stock
Currencies Trading – Currencies Trading Introduction
Exchange Traded Funds – Exchange Traded Funds
Option Investing – Option Investing
Foreign Currencies – Foreign Currencies
Learn About Forex Currency Trading – Learn About Forex Currency Trading
Commodity Futures – Commodity Futures Overview
Investment Advisors – Get the Best Advice and Return on Your Investments
Investment Clubs – Interested in Joining or Creating Investment Clubs
Forex Exchange – Forex Exchange Market
Investment Analyst – What is an Investment Analyst
Retirement Investment – Retirement Investment
Portfolio Manager – What is a Portfolio Manager
Investing Money – Investing Money
Gold Stocks – Investing in Gold Stocks
FX Trading – FX Trading
China Stock Market – 2007 China Stock Market Recap
Commodity Price – Commodity Price Introduction
Forex Broker – Choosing a Forex Broker
Bond Investing – Bond Investing for New Investors
Online Trading – Introduction to Online Trading
Trade Currency – What Does it Mean to Trade Currency
Stock Investing – Stock Investing Information to Get You Started
NYSE – New York Stock Exchange
Commodity Manager – Watching Futures Like A Commodity Manager
Basic Stock Information – Going Back to The Basics
Stock Market News – Do You Take Advantage of This
Children and the Stock Market – When Should They Learn to Invest
The Stock Market – What Are My Choices?
Investing Mistakes – Investing Mistakes and How to Minimize Them
Portfolio Diversification – Portfolio Diversification and Risk Management
Stock Market Investments – Interested in Learning About Stock Market Investments?
Online Trading – An Introduction to Online Trading
Trade Currency – What Does it Mean?
Stock Investing – Stock Investing Information to Get You Started
NYSE – New York Stock Exchange
Stock Market Investing – A Quick Look at Stock Market Investing
High Dividend Stocks – Stocks That Produce a High Yield
Blog Articles – December 2007
Stock Market Charts
Online Discount Brokers
Forex Trading Strategy
Trading Futures
Investing in Gold
Investing in Mutual Funds
Online Option Trading
Forex Currency Trading

Day Trading Stock Online – A Quick Introduction
Stock Market Analysis – There Are Two Types
Stock Exchange – An Institution That Hosts a Market
Open Market – Learn to Invest
Shareholders – Owning Stock
Discount Broker – Choosing the Right One
Bear Markets – The Great Depression
Dividend Paying Stocks – Screening
Blog Articles – November 2007
London Stock Exchange
Trading Stock online
Retained Earnings
Joint Stock Company
Stocks and Bonds
Bonds in Their Basic Form
Stock Picking
Portfolio Management
Online Stock Trading Game
Asset Protection 

Better Investing – The Ogg Report
Cheap Stocks – What Makes it Cheap?
Gold Investing – A Standard for Monetary Exchange
Mutual Fund Investing – Need Help with Investing?
Investing For Dummies – 8 Helpful Tips
Online Stock Trading – Online Stock Trading
Stock Charts – Why Use Them?
Blog Articles – October 2007
Trading Stocks
Forex Traders
Investing Strategy
Penny Stock Investing
Dividend Stocks
Investing Advice
American Stock Exchange
London Stock Exchange

Back to Recent RSS Feeds
 

Day Trading Futures

Day trading futures is a great way to make money however you must ensure that you are thoroughly educated about day trading before you begin. There are advantages and disadvantages to day trading futures which are explained in this article. Read this article carefully and decide if day trading this market is for you.

There are advantages to day trading in the futures market. Since there are no positions held overnight, traders can sleep better. There are no open positions to worry about so there will not be any unexpected major losses to wake up to. This is worth noting because very often futures will open at very different prices than they closed at the day before.

Another advantage to day trading in this market is that you will learn a lot quicker. If you practice futures trading once a week, you are making fewer trades. So theoretically, the more trades you place, the more you learn, and the more experience you gain trading futures.

There are also disadvantages to trading futures daily. For instance, commissions can quickly add up per transaction fees. Traders have to be sure that they pay more out in commission than they are making. If this is the case, then they must take another look at their futures trading plan, as well as their trading strategies and make the necessary changes. Additionally, day traders must be extremely disciplined in their approach. They must not only create a trading plan, but they must stick to it. This means they must follow their entry and exit strategies and they must have their emotions in check. Greed and fear are emotions that many day traders come across at some point, if not every day in their trading career, so it is imperative that they know how to deal with these emotions. The most successful traders have a clear understanding of the psychology of trading and those concepts associated with it.

A lot of the time new futures traders enter the market unprepared and too casually. These traders either quickly lose their money to the markets, or they quickly realize that they need to further their trading education before they continue.

There is a lot more to day trading in the futures markets. Continue to read about futures and determine if the market suits you. There is a lot of information available online, as well as online courses that you can take to help.


Market Direction

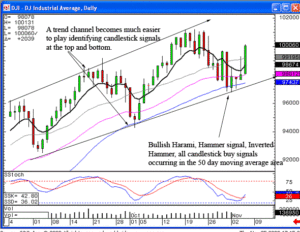
Candlestick signals have powerful implications. Having somebody else tell you this may not provide the ‘convincing’ many people require. Fortunately, the visual aspects of candlestick signals allows investors to quickly prove to themselves that the signals and patterns have compelling results. Try it yourself. Analyze whether there was signals at the reversals of a trend, both the top and the bottom on past chart activity. Visual analysis will not take very long. Did a bottom occur when the stochastics were in the oversold condition? Were there candlestick  buy signals at the bottom? The same analysis can be done at each peak.

Note how the Dow shows clear evidence of candlestick reversal signals at the tops and bottoms. In this case, the 50 day moving average and a trend channel add additional confirmation at the bottoms. Sell signals, when stochastics are in the overbought conditions, hitting the top of a trend channel, produce good visual evidence the uptrend is over in a downtrend will start.

Day Trading Futures, DOW

DOW

Notice the candlestick signals that have occurred in the past few trading days. A Bullish Harami at the end of a large bearish candle when stochastics were just geting into the oversold condition. This was the first piece of evidence that the  selling may have stopped. The Bullish Harami was followed by a Hammer signal. More evidence the bears could not push the market down through the 50 day moving average. Yesterday’s trade confirmed the Bulls had stepped in. However, by the end of the day, the Dow had given back most of its gains, producing an Inverted Hammer signal. This made today’s trading strategy very easy. Bullish confirmation of an Inverted Hammer signal is a positive open. Failure of an up trend would have been witnessing bearish sentiment on the open.
Upon seeing the premarket futures showing strength, confirming the Inverted Hammer signal, allowed for the immediate purchase of stock positions. Knowing what should occur after a candlestick signal permits an investor to act immediately, without hesitation. This is the advantage of understanding the psychology behind the formation of each signal and pattern.

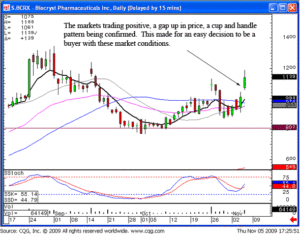
Day Trading Futures, BCRX

BCRX

Chat session tonight at 8 p.m. ET – We will discuss how to utilize the information built into inverted hammer signals, the confirmation and the stop loss aspects. Also, we will identify which stocks might have the best potential for the next trend move.

Good investing,

The Candlestick Forum Team


Holiday Specials

Click here for details

Website special reflects current newsletter. If you are reading an archived newsletter you will be directed to Current Website Special.

High Dividend Stocks

When you are ready to buy stock, you want to be sure to select high dividend stocks to add to your stock portfolio. High dividend stocks produce a high yield that should make the stock worth buying. The dividend yield for a stock is the return that you would get over the next 12-months. A 5% yield will typically get the attention of investors and is calculated by dividing the expected 12-months dividends by the share price. Dividends are dependent upon the cash flow of a company and not related to a company’s reported earnings. Investors prefer high paying dividend stocks due to their stability. The stability of the high dividend stocks result directly from the company’s stability which can only be indicated by a company’s dividend payment and stock price history. Only those companies with a continuous record of steadily increasing dividends over the past twenty years or more should be considered when investing in high dividend paying stocks.

The very best high dividend stocks are those stocks that increase their dividends while you hold them. Stock screening is the best way to find these stocks and it involves the use of special programs that are available to investors on numerous financial websites. Stock screeners search the market for stocks that meet specific criteria. When finding those stocks that increase their dividends while you hold them it causes the yield to increase and the yield increase typically drives the share price higher. Of course, on the other hand, a dividend drop is not good and is not an indicator of high dividend stocks.

There are many reasons why you should choose high dividend stocks to build a strong portfolio. For on thing, they are less volatile. Investors are more willing to hold dividend stocks through a bear market since the companies actually pay out cash and these stocks do not fall as quickly as non-dividends stocks do. Again, they are more stable as they also do not tend to rise as fast either during bull markets. High dividend stocks are also simply outperforming non-dividends stocks. Statistics show that dividend payers have had an increase in stock prices in contract to those not paying dividends, who have actually suffered a loss in stock prices. Lastly, high dividend stocks get favorable tax treatment because they are not taxed as your ordinary income. Investors receive more income than they would through a money market account or a COD.

If you are interested in investing in high dividends stocks, please note that it is not a get-rich-quick method and requires extensive stock research. Most are however, expected to grow earnings between ten and fourteen percent annually over the next five years. You can expect that over time, high dividend stocks share prices will move up at about the same rate. Couple that with a price appreciation of two to five percent dividend yield and you are looking at a great annual income! 

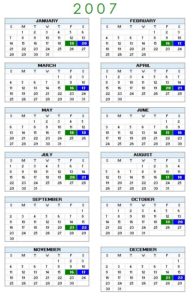
Options Expiration Calendar

Options Expiration Calendar 2007

Trade Day Indicator   Last Trading day for stock options

Expiration Date Indicator    Actual expiration date for stock options

Forex Trading Software

Forex trading software, also referred to as currency trading software helps the currency trader with forex analysis and the execution of trades. This software provides charts and other methods for taking orders which are usually included when you open a trading account with a forex broker. When you look for forex trading software to use please note that the software differs greatly in functionality when compared to software for other types of securities.

Forex brokers will allow you to set up a demo account so that you see if you like the trading software. Every broker is very different and therefore every type of trading software is different so you really should take the time and set up a demo account before committing to a brokerage firm. Decide which software best suites your needs.
Once you have chosen a forex trading software you must choose your methodology for trading forex. You must choose the time frame in which you will trade forex and then you must decide if you will use support and resistance levels, buying or selling breakouts, or technical indicators such as the moving average and crossovers. Once you have decided and settled on a system and a methodology, you then should test to see if it is consistent. Many traders fell that as long as your system is reliable more than 50% of the time that you already have an edge of over traders.

Forex investors and traders recommend back testing your trading system and if you find that if you had traded very time your were given a signal that your profits were more than your losses, then you most likely have a pretty sound trading system in place. You should test a few forex trading strategies when using your forex trading software of choice in order to find one that provides consistent results. Once you find those strategies then you must stick with them and test it with a variety of instruments and various time frames.

The time frame, when forex trading, really tells you what type of trading is appropriate for your investment risk tolerance and your personality. Some traders choose weekly charts which means they are comfortable with overnight risk and they are okay with seeing a few days that may or may not go against your position. Other traders prefer five minute charts because they are more comfortable with being in a position without risking any overnight exposure. Additionally, traders can practice short term trading, also referred to as scalping if they are willing to sit in front of a computer screen all day long and make many trading decisions throughout the day.


Market Direction

Understanding the ramifications of the candlestick signals allows an investor to make intelligent trade decisions immediately. As of last week, holding short positions put a safety cushion in the portfolio. The trading of the last three days of last week indicated indecisiveness, Doji’s and Hammer signals. The stochastics had moved to the oversold conditions. What should this have prepared us for? The appearance of any bullish trading would have implied the past three trading days had been bottoming action. Upon witnessing the premarket futures trading positive this morning, that was a good indication the bottoming action would be confirming. This assessment of market conditions prepares an investor to make decisions immediately. The premarket futures showing bullish strength instigated selling the short fun positions on the open. From that point, those funds could be utilized for trading long positions.

Was this going to be a reversal day? At the open, the likely target was eventually a test of the tee line. If that was the case, there was no reason to be in short positions or short funds. There was no anticipation the tee line would be tested today, but establishing long positions put you in the right positions at the right time. Having the ability to analyze the direction of the markets with a high degree of accuracy allows for profitable movement of portfolio positions. The market trend can be easily evaluated for any time frame. This information becomes a valuable tool for the longer-term investor as well as the day trader. It does not matter whether you are trading stocks, bonds, commodities, or Forex, the correct interpretation of the candlestick signals creates a trading format that allows an investor to put the probabilities in their favor consistently.

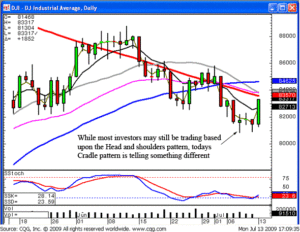
The NASDAQ is forming a cradle pattern and closing above the tee line. This is a strong indication of short-term trend has stopped going down. The Dow is also forming a cradle pattern and closing above the tee line. New bullish strength from this area would negate the analytical assessments derived from the head and shoulders pattern. The candlestick investor has the advantage of seeing how parts of patterns are being formed. Long positions will be established well before other technical analysts realize the head and shoulders formation is not confirming. This is what produces much better profits for the candlestick investor. Establishing positions before the rest of the investment crowd can reassess their positions.

Forex Trading Software, Dow

DOW

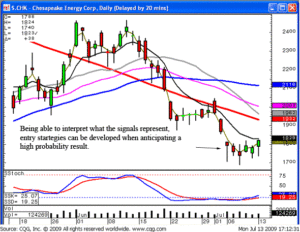
Candlestick signals prepares an investor for a potential pattern or pattern breakout. Being able to visually analyze when a trend is in the process of reversing allows for the establishment of positions at the appropriate time. Currently the CHK chart is revealing bullish sentiment in the oversold areas.

Forex Trading Software, CHK

CHK

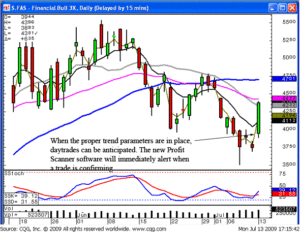
Forex Trading Software, CHK

FAS

High profit patterns presentation – Thursday July 16, 2009  Steve Bigalow will be presenting to the World Cup Advisors group. You are invited to join his presentation. The World Cup advisors group has a number of unique investor programs you can trade as they do through the World Cup program. Join us for a review of the candlestick high profit patterns. Also, learn about the different trading programs available with the World Cup advisors group. Please take the time to explore some technical investment programs operated by very reliable traders. This is a perfect method for diversifying your investment funds into highly profitable trading funds.The WorldCupAdvisor site is home to nationally recognized futures, forex and stock traders. Through their advanced technology, they are able to display their live trading accounts in real time and allow subscribers to attempt to replicate their activity. Many subscribers use World Cup AutoTrade service to follow trade activity automatically.

The Candlestick Forum Online Training clinic – July 25 and 26, 2009. Do you want to have better control of your own investments? Wouldn’t you like to accurately analyze your own investment trades versus depending upon others to invest your money? If you learn how to use candlestick analysis in a step-by-step orderly manner, you are going to have a much more clear understanding of how the professional investor thinks. Candlestick analysis is merely the graphic depiction of investor sentiment. The successful investor acknowledges that prices do not move based upon fundamentals, they move based upon the perception of fundamentals. The candlestick signals are graphic formations of investor sentiment. Whether you are a beginning investor or a seasoned trader, you will gain insights from this two day training program that will alter your investment abilities for the rest of your life.

Good investing,

The Candlestick Forum Team

Website special reflects current newsletter. If you are reading an archived newsletter you will be directed to Current Website Special

Commodity Futures Trading

Commodity futures trading reacts to a broad range of factors. For example, crude oil has just fallen to a three week low. Today commodities traders are concerned that other nations will follow India’s example and raise interest rates. Higher interest rates tend to slow economic growth and the use of oil. Commodity futures trading in oil has dropped just over fifty cents for April delivery of benchmark light sweet crude whereas February 2012 delivery has dropped a dollar. Oil futures trading as far out as June 2016 is unchanged as traders still view the commodity as an inflation hedge.

Unlike oil, orange juice futures have gone up because of the frost in the worldfs second largest producing area, Florida. Now there has been a slight downward correction as the Department of Agriculture reports that the frost was not as bad as previously believed. In the case of oil the commodity market sees less use and is dropping the commodity price now and in future months. In the case of orange juice commodity futures are up because of decreased supply. To fully understand how commodity futures trading is affected by many divergent factors sign up for Commodity and Futures TrainingTraining will help you use both fundamental analysis and technical analysis with tools such as Candlestick charting to understand and predict the market in commodity futures trading.

Commodity futures trading in an organized fashion dates back at least 300 years to trading Tulip bulbs in Holland and rice trading in Japan. Candlestick basics, the basis of today’s Candlestick analysis, came into being in early commodity trading as rice traders recognized recurring trading patterns. Traders said that they learned to let the market tell them what the market was going to do. Today’s technical analysis with Candlesticks as well as other technical analysis tools in use today evolved from early, formal commodity futures trading. Today’s ability of the commodity trader to foresee commodity prices in oil futures or orange juice dates back to the actions of very thoughtful traders in the distant past.

Today analysts are saying that the fundamentals of the oil market do not justify prices above $80. The market already knows that! Many smart traders buy when they believe the price of a commodity future is cheap and sell when they think it is overpriced. The sum of these trades creates a market consensus smarter than any one individualfs market analysis. The extent to which commodity trading software is successful is the extent to which it follows tools such as Candlestick charting techniques which date back hundreds of years. A computer may be able to do the calculations faster but the computer did not have the wisdom to develop a system that can so accurately predict the future in commodity futures trading. So, as you are drinking your watered down orange juice (Tropicana is planning on putting only 59 ounces of juice in its 64 ounce containers.) and practicing the use of Candlestick chart analysis donft forget to thank those early rice traders for envisioning a system that so accurately predicts where commodity investing is going next.


Market Direction

The markets continue to provide a consistent message. The Bulls continue to control the market!  Wednesday was the first day in over six weeks that indicated the Bears might be stepping in. The Dow closed right on the tee line while the S&P 500 and the NASDAQ formed Doji’s. The weaker open today provided strong evidence the sellers were continuing to take over. However, by the end of the day, it was evident the Bulls were stepping back in. This may seem like an elementary observation after the fact but there was more important implied information. Every time the markets have tested the tee line, there is no confirmation that continues to push the market down through that level.

Commodity Futures Trading, DOW example

DOW

The continuation of the uptrend has strong ramifications for the candlestick investor. Many chart patterns are now breaking out to the upside due to the lack of negative sentiment. This information is especially important for the candlestick investor. It allows for the continued participation in pattern breakouts that are going to produce much stronger returns than the normal uptrending stock.

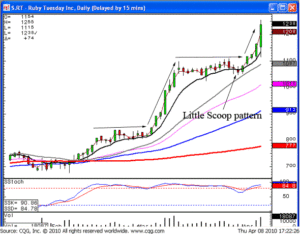
RT was recommended today due to the flattened scoop pattern. The price move above the $11 range gave the impression that another wave was about to start. Knowing what the results should be from a pattern makes the decision to enter or exit a trade much easier. Simple candlestick signal entry strategies provide a trading format that allows an investor to dramatically improve the probabilities of being in the right trade at the right time.

Commodity Futures Trading, RT

RT

Today’s entry into RT was relatively simple. The recommendation to get into this position was based upon the potential of another wave beginning. It opened lower . There is a very simple strategy for improving the probabilities of entering a trade at the appropriate time. When the price opens lower in a potential uptrend, set your buy stopped at the previous day’s close. The Japanese rice traders rationalize that the early profit-taking, causing the lower open, would be over if the Bulls could bring it back up through the previous day’s close. Obviously a lower open that did not have enough strength to come back up through the close of the previous day would not be a position that would convey strength.
 
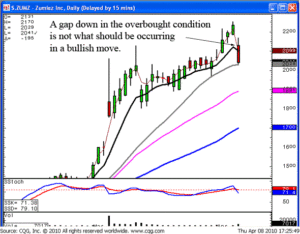
The same simple logic can be used for taking profits. Knowing the simple rules of candlestick analysis allows an investor to maximize potential returns. As seen in the ZUMZ chart, a recommendation to buy from a few weeks ago, did not exhibit the appropriate direction that would indicate Bulls were in control. A gap down below the previous day’s open, especially in an overbought condition, would immediately indicate the Bears have taken control.

Commodity Futures Trading, ZUMZ

ZUMZ

An open, below the previous day’s open, has the potential of creating a very strong sell signal, the kicker signal. With that knowledge, upon seeing a position gap open should instigate an immediate action, sell as fast as possible! Candlestick analysis is nothing more than common sense observations. The Japanese rice traders discovered centuries ago how investors think. When that is put into a graphic depiction, an investor gains immense control of their emotions and their profitability.

Chat session tonight at 8 PM ET. Learn how to identify breakout moves for big profits or daytrading scalping.

Good Investing,

The Candlestick Forum Team


This Week’s Special

Scanning Techniques to Higher Profits

Click here for details

Website special reflects current newsletter. If you are reading an archived newsletter you will be directed to the Current Website Special.

Useful Stock Investment Information

Useful stock investment information comes in several sizes and shapes. Not all investment advice and counsel is useful, so those interested in long term investing, options tradingday trading of stocks, or commodities trading should remember the old Roman saying about the buyer needing to beware. To find useful stock information in a stock advice column the investor should beware of the fact that oftentimes the writer’s sole purpose in writing the article may be to promote a stock. A hard fact is typically useful stock investment information, providing that it is up to the minute. Old information is commonly inaccurate to the degree as to be misleading. The stock market and stock prices change by the minute.

In a fast moving market technical analysis supersedes fundamental analysis as a source of useful stock investment information. Everyone knows the same fundamentals and is buying stock or selling stock based upon their own interpretation of the fundamentals. The most useful stock investment information for many can be found in Candlestick pattern formations as Candlestick patterns can tell investors or traders where a stock price is likely to go next. Spotting a market reversal or predicting the continuation of market trends with Candlestick analysis can be the most profitable way to interpret and take advantage of useful stock investment information.

Good sources of useful stock investment information include business news sources such as Bloomberg, the Financial Times, CNN, Reuters, the New York Time, the Wall Street Journal, and Forbes. To the extent that the investor can harvest absolutely fresh news from one of these sites or print media he may be able to sell stock at the top of an earnings cycle before the rest of the market responds. However, doing so typically requires that the investor has done a considerable amount of fundamental analysis first. Stock investment information is only useful stock investment information when the investor is able to accurately and promptly interpret it in order to buy stock or sell stock in a timely fashion. More commonly the investor will use these sources as background information. This is then the useful stock investment information that he will already have in his head when a piece of news breaks.

A stock’s price to earnings ratio, its price to sales ratio, information as to its margin of safety or its intrinsic stock value are all useful stock investment information. These are, however, fundamentals which everyone knows or can know with a little effort. Once an investor knows how a stock is trading in relation to its intrinsic value, margin of safety and current earnings he will want to look at how it is doing in technical analysis. With Candlestick charting techniques the investor can commonly anticipate market movement. If a stock has already been bid up due to its good fundamentals he will know that perhaps it is not the time to buy. Using the useful stock investment information in annual and quarterly reports, in news releases, or from stock price analysis using Candlestick charts the investor will not always buy or sell stock but when he do he will commonly do so more profitably.


Market Direction

Big profits are being easily made in these type of market conditions. An added advantage of candlestick analysis is the ability to apply common sense evaluation to what the   graphics are revealing. This makes trend analysis very easy. It allows an investor to maintain positions even though there may be some weakness along the way. The common sense analytical aspects of candlestick signals and patterns makes for relatively easy analysis even for the beginning investor. Unfortunately, profiting from candlestick analysis requires a human characteristic that is not often exerted, effort! This became evident this week when one of the local members of the Candlestick Forum offered to check with investment club leaders to see if they would like a candlestick presentation. Most of them said they would. However, one major club declined. The club leader did not feel that candlestick signals worked.

This was a surprising answer. But it produced an important realization. Most investors are looking for the investment trading method that is the most simple. They are looking for a trading method that does not take a great deal of effort. If you browse through the Internet, you will find numerous trading websites that have discovered the “secret” for successful investing. They promote how easy the trading program operates. It may be as simple as buying when the green arrow points to a buy and selling when the red arrow appears on the screen. Most of the time, these websites do not last very long. Or the investor does not have very much success with the program eventually and move onto something else. There is one adage on Wall Street that is very true. If something does not work, it will disappear quickly. If something does work, everybody would know about it.

One of the biggest risk factors for most investors is spending time and effort on learning a trading method only to find out that it does not work very effectively. Learning candlestick analysis alleviates that problem. Candlestick signals did not work, they would not be around after hundreds of years. The solid aspect of candlestick signals is the common sense elements that are built into the graphics. The graphics are made up from the reaction of investor sentiment. Investor sentiment has produced reoccurring and recognizable signals and patterns throughout history. Investor sentiment does not change from one generation to the next or one century to the next. Candlestick analysis is merely the interpretation of the reoccurring thought processes found in investors during all aspects of market trends. If you seriously want to learn how to invest successfully, utilize the information found in candlestick signals. If you find yourself not making profits, rest assured it is not the candlestick trading method that does not work, it is your interpretation or application of the investment program.

Candlestick signals reveal when a market trend is starting, when it is continuing, and when it is time to take profits. The days chart analysis is greatly improved due to the indicators that are computer-generated. The Japanese Rice traders were successful in trading rights with the most basic charting techniques. They did not have the capabilities of quickly calculating stochastics, moving averages, positive and negative transaction volume, or a multitude of other indicators that are instantly produced on the computer screen. This year, the candlestick forum is increasing its effort to show investors how to use candlestick analysis successfully. In many cases, this will involve a great deal of redundancy. However, the important factor is to teach people what to look for and how to successfully assess graphic information.

You will find the Candlestick Forum training programs and daily chat rooms will be directed toward teaching investors the full concepts of investment aspects. If you are willing to take the time and effort could completely learn a trading processes required to stay consistently profitable, the candlestick forum will take the time and effort to make sure your candlestick signal education is complete. The light will come on! You will be amazed at the amount of common sense investment perceptions are incorporated into candlestick signals.

Chat session tonight at 8 PM ET. Everybody is welcome.

We will be concentrating on identifying price patterns that produce an immediate profits.

Good Investing,

The Candlestick Forum Team


Current Website Special

MAJOR SIGNALS EDUCATIONAL PACKAGE

Website special reflects current newsletter. If you are reading an archived newsletter you will be directed to Current Website Special

Picking Hot Stocks

The profitable part of picking hot stocks is getting in early and getting out in time. Although fundamental analysis of stocks can alert traders to the fact that stocks are undervalued it does not necessarily tell one when stock prices will start to move. Picking hot stocks is largely the world of technical analysis and Candlestick stock charts. Those who rely solely on stock tips in picking hot stocks commonly buy stocks too late after prices have risen significantly. The same investors and traders who rely too heavily on tips and neglect Candlestick analysis may overstay their welcome, so to speak, and see their gains fall away in unanticipated market reversal. Certainly one needs to know where to find potentially hot stocks because of if a trader is not analyzing a stock he will not be seeing Candlestick patterns that would help him see a pending stock price or market rally. Services that alert traders to market action are useful in this regard. However, it is still the trader who needs to analyze stocks and decide if he is picking hot stocks or stocks that have now cooled off.

Picking hot stocks does not always mean that the trader will buy low and sell high. Virtually every stock rally levels off or reverses. A trader may not always get into a hot stock early enough to make a profit but he may find that with the use of Candlestick pattern formations that he can predict when the stock will reverse course. At that time selling short can be as profitable as buying at the bottom of a price swing. For the attentive Candlestick trader a useful means of finding hot stocks it to let an expert such as Stephen Bigelow do the work of picking hot stocks. If the trader becomes a member of Candlestick Forum he can watch Steve’s daily stock picks and learn from a Candlestick expert how to analyze, buy, hold, and sell stock using Candlestick trading tactics.

A current hot stock is that of the New York Stock Exchange. The NYSE agreed to a buyout by Deutsche Boerse in February. Now NASDAQ and Intercontinental Exchange are offering nearly twenty percent than the German offer at nearly $12 Billion. A bidding war could drive NYSE stock even higher than the $42 level to which it rose from $35 after the new offer. Variables to consider in this mix are whether the German entity will be allowed to own the largest US stock exchange and whether NASDAQ and NYSE having one owner would be an antitrust violation. The Candlestick trader will read the news and ponder what will happen next just like all the rest. The Candlestick trader will also let Candlestick chart patterns be his guide in buying stock in NYSE, selling stock in NYSE, buying options, or trading NASDAQ instead. Knowing that all trading situations result in patterns and that stock price patterns are predictable the Candlestick trader can follow the progress of a hot stock and get out before it cools off.


Market Direction

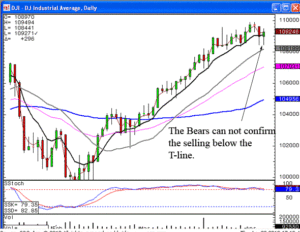
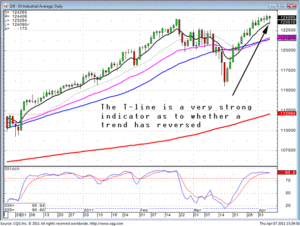
Candlestick analysis dramatically improves an investors ability to analyze a trend direction. As illustrated in today’s trading in the Dow, the uptrend remains in progress as long as there was not a candlestick sell signal and a close below the T-line. As can be seen in the Dow chart, there were a number of days that created candlestick sell signal ‘potentials,’ but they were not confirmed the next day with additional selling and the trend showed continued uptrend because of the lack of confirmation of a close below the T-line.

Picking Hot Stocks, DOW

DOW

The NASDAQ and the S&P 500 both form Doji’s today after bouncing back up off the T-line. This makes tomorrow’s trade analysis relatively easy. The markets will move in the direction of how they open after a Doji. The premarket futures should give us an indication whether there has been a change in investor sentiment.

Once you have mastered the easy-to-learn nuances of candlestick signals, you have the capability of finding stock prices that are going to move inordinately strong during market uptrend or downtrends. This information is easily assessed when analyzing candlestick signals at breakout conditions or coming out of candlestick patterns. This is not a difficult process to learn. Human nature reacts the same way time after time with a very high degree of predictability. Candlestick analysis is merely the graphic depiction of what is occurring in investor sentiment. Because investor mentality works the same way time after time, investors can gain huge advantages by graphically witnessing when a price move set up is occurring.

There are numerous candlestick trades setups that make for very high profit positions. Learning a few of these trades setups can provide a very good living. The reason they work with a high degree of accuracy is because they have worked in the past with a high degree of accuracy. That is the exact reason they have been identified.

Picking Hot Stocks, HRS

HRS

Picking Hot Stocks, HRN

HNR

Tonight’s chat session at 8 PM ET – guest speaker David Elliott of WallStreetTeachers – David Elliott and Steve Bigalow have been working together for over the past eight years. David’s expertise in finding and developing short-term technical trading indicators works very effectively in conjunction with candlestick analysis. Join the chat session tonight and view some of the techniques that when applied to candlestick analysis can greatly improve your correct trade ratio.

Chat session at 8 PM ET, everybody is welcome.

Good Investing,

The Candlestick Forum Team


Website special reflects current newsletter. If you are reading an archived newsletter you will be directed to Current Website Special

Futures Trading Commodities

Trading commodities on a commodities exchange is futures trading commodities. Commodities futures were developed by producers and buyers of commodities in order to stabilize commodity prices. Hedging of risk by both producers and buyers involves futures trading commodities by everyone from gold mining companies to cattle producers and silver refiners to companies that sell refined sugar. Futures trading commodities involves entering into a contract to either buy or sell a standardized amount of a commodity on a future date. Futures contracts are commonly made for months and even years in advance. The value of the contract will vary as the projected or anticipated price changes. Traders use technical analysis tools such as Candlestick chart analysis to anticipate price movement in commodities markets. A good place to get started with commodities is with Commodity and Futures Training.

Spot Price and Strike Price

The current price of any equity, including commodities, is the spot price. It is the price at which things are bought and sold, the current market price. The future price of a commodity can be anticipated but not known exactly until the day when it is sold, unless a contractual price is agreed upon. In order to guarantee a price at which a producer can sell his or her product the producer will sell a futures contract. The price stated in this contract is the strike price. It is the agreed upon price at which the producer will sell the commodity, no matter what the spot price may be. A trader speculating in futures trading commodities can make a profit from the difference between the contract or strike price and the spot price. What typically happens is that a trader will buy or sell a commodity futures contract for a given commodity and hold it until the commodity price moves. Then he or she will exit the position, taking his or her profit. A commodity trader virtually never holds his or her position until expiration as they do not really wish to take delivery of a herd of cattle or have to come up with several tons of soybeans to sell.

Anticipating Price Change and Gaining Profits

Anticipating commodity price movement by the use of commodity trading charts allows traders to profit in futures trading commodities. Rice traders in ancient Japan recognized that price patterns of rice repeated themselves. These traders also noticed that different patterns predicted different types of subsequent price movement. Candlestick pattern formations that predicted certain price movement led to Candlestick trading tactics that led to substantial profits. Candlestick analysis is just as valid today in futures trading as it was in Japan in the days of the Samurai. Market history repeats itself and those who pay attention can profit, repeatedly.

Analysis and Profits

Both fundamental and technical analysis are necessary in order to profit trading commodities. Fundamental analysis is essential in order to understand the basis of pricing. Technical analysis is essential to understand the market created by thousands of traders buying and selling both commodity futures and options contracts on commodity futures.


Market Direction

Why is the halfway point of a candle important to Japanese Rice traders? As illustrated in today’s markets, it reveals when the Bears are back in control. The Japanese Rice traders have a very simplistic and common sense explanation for the candlestick signals. The Dow formed a Bullish Engulfing signal on Thursday after a long legged Hammer signal and an Inverted Hammer signal. Friday saw some profit-taking, as was expected after the strong bullish day of Thursday. Today’s trading closed back down below the halfway point of Thursday’s candle body. What does this mean? The Japanese Rice traders simply explain that if the Bullish Engulfing signal of Thursday was a signal that showed the Bulls were now in control, then when the Bears were able to close more than halfway down that candle, it demonstrated the bears were back in control.

This weakness in today’s trading now illustrates the tee line and the 200 day moving average area are continuing to act as resistance. Any week trading tomorrow would warrant buying the short funds again. If you are not making very much money over the past couple of weeks, do not be discouraged. Today’s close is almost exactly at the same level the Dow closed eight trading days ago. There will be times when the market does not allow investors to make money. This current sideways motion illustrates that point. Do not get discouraged. Recognize what the market is doing. Be prepared to take advantage of the next market move. Weaker trading tomorrow may indicate the downtrend is still in progress. Buying short funds may be the logical strategy.

Stop losses Intraday

The use of stop losses during the day is an important tool for protecting profits as well as maintaining a clear mental outlook. Note the overall trend of wheat. It has been moving down and the tee line has been an effective resistance level. Remaining short has been profitable. The simple rule that the downtrend remains in progress as long as they cannot close the price above the tee line. This allows a ‘short’ investor to remain comfortable until they witness a candlestick buy signal and a close above the tee line. The only concern for the short investor is stochastics being in the oversold condition. This makes the application of a logical stoploss very important. Although Friday’s Bearish Engulfing signal may have been the indication the next wave to the downside may be starting, there was still the possibility that wheat prices were in a bottoming stage.

Had today’s trading closed positive, after trading down most of the day, a much different formation would have occurred. A Hammer signal would have formed in the oversold conditions. If that were the case, the 10 minute chart provides a level that would indicate the would be forming on a daily chart. Putting a stop one tick above the early high of the day would have indicated the Bulls were in control. That was a good place to get stopped out of short positions. If the trading had remained positive at the close, the Hammer signal would have been a worrisome signal for a short position. However, as seen on the 10 minute chart, a Hanging Man signal was followed by a Bearish Engulfing signal. This indicated that the price of wheat was heading back down with approximately 30 minutes left to trade in the day. This created the opportunity to reshort the position going into the final few minutes of trading. Why would this be important? The week trading going into the close created a bearish candle, confirming the bearish engulfing signal of Friday, continuing the next leg down. This is completely different than if the price had remained strong going into the close, forming a Hammer signal in the oversold area.

Examining short-term charts allows an investor to extrapolate what the longer-term chart is going to look like. Stopping out of a position when it looked like the position should not be maintained was the prudent thing to do. Reestablishing the short position when it appeared as if the sellers were back in control was once again the prudent thing to do. In this case, stopping how of the short position did not cause the profitability of this trade to suffer. The trade could’ve been reestablished at approximately the same level it had been stopped out. These situations are easily evaluated using candlestick analysis.

No Chat Session Tonight

Good Investing,

The Candlestick Forum Team


Current Website Specials

Gap Trading 

5-Star Trading Plan

Click here for details