The commodity market is where raw or primary products are exchanged through the buying and selling of futures contracts. This market originally began with the buying and selling of agricultural products such as wheat, corn, cattle and pigs. Other foods such as soybeans were only added recently in most of the commodities markets whereas agricultural products were widely traded in the 19th century. In order for a specific type of commodity to establish itself in this market, there has to be a broad consensus on the different variations in the product that make it acceptable for various purposes.
Commodities trading online occurs when traders trade futures contracts for goods, but the traders don’t have to physically deliver the good to the consumer. The contract means that the investors instead will determine if the commodity price will appreciate in the future, or depreciate in the future. If the trader thinks the price will appreciate he will buy a future contract for the commodity, and conversely if the trader thinks the price will depreciate, he or she will sell the future contract to avoid losing money. The main requirement in the commodity market is that the trader must deposit enough capital though a brokerage firm to ensure that he or she is able to pay for potential losses if they are unsuccessful in their trade.
The commodities exchange is highly regulated and the trading is done in the “pit”, meaning that the transactions are handled by licensed commodity brokers. These brokers bring together buyers and sellers and aim to identify your investment shortcomings in order to help overcome those drawbacks.
Unlike in the old days, you don’t actually visit the commodity market in order to do business, but you instead go though a broker who takes your order to exchange for you. Your broker can either be a live person you speak with on the phone to place your orders, or it can be an online broker, or electronic commodity trading over the internet. The best known markets in the United States for trading commodities are located in New York, Chicago, Kansas City, and Minneapolis.
Many investors utilize Japanese candlestick signals in order to develop a highly profitable commodity trading system. Commodities are actually easier to trade than stocks when using candlestick signals because there are fewer outside influences to affect commodity prices. Continue to learn about how candlestick analysis can help you to trade commodities successfully.
Market Direction
The inherent credibility built into candlestick’s can be readily seen in days like today. It is a very simple analysis. Candlestick patterns are recognized for the inordinate strength provided in price moves. The Japanese rice traders witnessed patterns throughout the centuries that were created with very specific parameters. Just as they were able to analyze what investor sentiment was doing in individual signals, they were also able to explain the investor sentiment that created price patterns. Patterns are produced based upon the accumulation of buying or selling pressures that result in anticipated price moves. That in itself is a very strong element for producing large profits.
When the market trends can be identified, price patterns can produce much larger profits than a normal price trend.
Additionally, the buying forces that are building up in a bullish pattern are less likely to disappear when general market conditions suddenly turn in the other direction. As witnessed in today’s market, numerous Candlestick Forum recommendations continued to trade positive, or at least held up well, in a very hard selling market. It is not unusual to have a bullish portfolio finish a day net positive during a very bearish market day. If not net positive, at least very close to breakeven for the day. The pre-market futures today indicated some potential profit-taking. Many times, this puts an investor in a position of having to decide whether to take profits in specific positions. This always leaves the nagging question, “is this position merely pulling back due to profit-taking, or should I close the position?”
Candlestick formations often help answer that question.
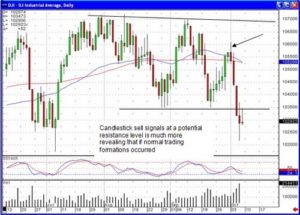
A bullish trending position may open lower when pre-market futures indicate strong selling. However, the candlestick formation provides a much more clear picture of what is occurring after the price opens. If the price starts moving up after the open, the bullish candle is very clearly visible. What does it tell us when a price opens lower, then starts showing a bullish candle? Very simple, it reveals there is continued buying although it opened lower. This is very important information when having to make a decision as to whether to liquidate a trade based upon weakness.
HK
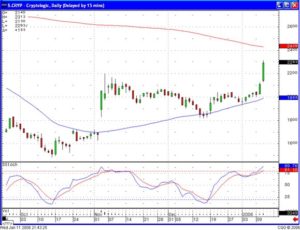
CHK
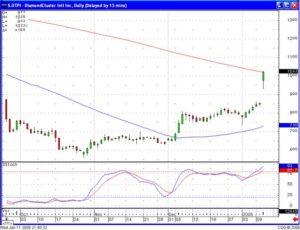
Candlestick patterns make it very simple to anticipate what should be occurring next in that pattern. The Candlestick Forums recommendation on GERN was based on a very simple pattern analysis. Yesterday the price formed a Doji/Harami after just touching the tee line. This was a set up for a possible Jay-hook pattern. After the price opened and started trading down today, a very simple entry strategy could be implemented. If the price came back up through today’s open, essentially going positive, this would be further confirmation a Jay-hook pattern was developing. This position was bought during the day as the price came back up through the open price in despite of the fact the markets were still selling off extremely hard. The pattern identification was the result of the predetermining factors for creating a Jay-hook pattern; a very strong price move. After a couple of days of pullback, supporting at the tee line and producing a potential candlestick reversal signal, it was very easy to establish an entry point based upon a high probability results if the price eventually went positive.
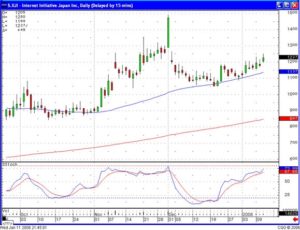
GERN
Other positions in the portfolio have the same potential on a big bearish day in the indexes if they were established based upon a pattern set up. Learn how and why candlestick patterns are created. Having this knowledge allows for positioning a portfolio to continue to do reasonably well even with the markets moving unexpectedly in the opposite direction. This is not difficult information. The Japanese rice traders merely incorporated commonsense investment perspectives in easy-to-visualize graphic formations. Applying that knowledge to fundamental research or strictly technical trading allows an investor to understand why prices move as they do.
Chat session tonight 8 PM ET — Everybody is welcome, bring your friends. Invite those people you think would be a good investment associates as you are trading during the day or week. Tonight session will concentrate on recognizing which patterns are setting up for the best potential trades.
Good investing,
The Candlestick Forum Team
Setting Entry and Exit Points
E-book Profitable Entry & Exit Strategies
Website special reflects current newsletter. If you are reading an archived newsletter you will be directed to Current Website Special.