The Japanese traders say “let the market tell you what the market is going to do.” The utilization of Candlestick signals makes analyzing the direction of the stock market indexes and trends relatively easy. It becomes difficult at times to sort out what the stock market indexes intentions are when listening to the many scenarios from the so-called “market experts.” Watching the financial news stations will always provide a multitude of opinions of where the market is going. Using Japanese Candlestick signals will circumvent all that noise.
The one basic factor built into Japanese Candlestick signals is that they are formed by the cumulative knowledge of all the investor input, the buying and selling, of a trading entity or trading entities, during a certain time period. No matter what you hear elsewhere, the Candlestick signals tell you exactly what investor sentiment is doing.
Candlestick analysis allows investors to project trend reversals of the stock market indexes with a relatively high degree of accuracy. One misconception about Candlestick signals is that there are too many of them to learn. Of the 50 or 60 Candlestick signals, there are only about 12 signals that will occur a vast majority of the time: The Doji, the Bullish and Bearish Engulfing signal, the Hanging Man, Shooting Star, Hammer, the Inverted Hammer, the Bullish and Bearish Harami, the Dark Cloud, the Piercing Pattern, and the Kicker signal. Knowing these signals alone will dramatically improve your analysis of trend reversals and make learning Candlestick analysis much easier. Having this analysis capability in one’s mental arsenal allows the Candlestick investor to have their portfolio positioned in the correct direction when a move occurs. Understanding the psychology of how the signals are formed provides investors with better foresight into where to have positions placed.
Candlestick analysis is not rocket science. It is simple investment philosophies put into a visual graphic. The 400 years of actual investment results from Japanese rice traders have provided high probability signal results. The Candlestick signals illustrate the investor sentiment mostly defined as fear and greed. Human emotion, when it comes to investing funds, will always have the same ingredients. The Candlestick signals are simply the graphic depiction of investor sentiment. Candlestick signals were not discovered and tested by computer back testing simulations. Candlestick signals are the result of centuries of analyzing how human emotions affect a price trend. The signals, occurring over and over at specific points in a trend reversal, provide a statistically proven trading platform. If you understand how they are formed, you’ll understand what makes prices move.
The Morning Star signal is one of the most clear, symmetrical Candlestick reversal patterns. Not to overstate the obvious, but if Candlestick signals didn’t work, we would not be looking at them today. The Japanese rice traders that used Candlestick signals became enormously wealthy.
The major benefit of Candlestick signals is that they are very easy to learn and identify. You do not need to learn formulas. You do not have to do extensive fundamental analysis. The visual aspect of Candlestick signals identify when a reversal is about to occur. Somebody else has already made decisions that it is time to buy or sell. The Morning Star signal, when fully analyzed, reveals very simple common sense features that identify the change in investor sentiment.

The Morning Star
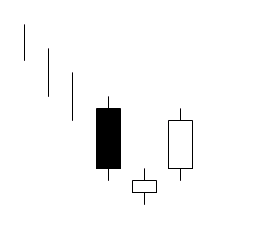
The Japanese rice traders described it as the planet Mercury, the Morning Star. It foretells that brighter things, sunrise, is about to occur, meaning that prices are going to go higher. It is formed after an obvious downtrend. The first three-day signal consists of a long black body, usually one produced from the fear induced at the bottom of a long decline. The following day gaps down. However, the magnitude of the trading range remains small for the day. This produces an indecision-type day. The third day is a white candle day. The white candle represents the fact that the bulls have now stepped in and seized control. The optimal Morning Star signal would have a gap before and after the star day.
The make-up of the star, an indecision formation, can consist of a number of candle formations. However, a Doji or a Spinning Top is usually the predominant formation in a Morning Star signal. The important factor is to witness the confirmation of the bulls taking control the next day. That candle should consist of a closing more than halfway up the black candle of two days prior.
Identifying the Morning Star signal is relatively easy. It is visually apparent to the eye. There are some very simple parameters that can enhance the Morning Star signal’s probabilities of creating a reversal.
- The longer the black candle and the white candle, the more forceful the reversal. This demonstrates a more severe change in investor sentiment.
- The more indecision that the star day illustrates, the better probabilities that a reversal will occur, such as a Doji signal.
- A gap between the first day and the second day adds to the probability that a reversal is occurring. A gap before and after the star day is even more desirable.
- The higher the close of the third day, coming up past the middle point of the black candle of the first day, reveals more potential in the strength of the reversal.
The probability of a Morning Star signal reversing a trend becomes extremely high when found in oversold conditions. Using a simple indicator such as stochastics, in the 20 area or below, represents an oversold condition. The most important element of the signal is the magnitude of the white candle’s close during the third day.
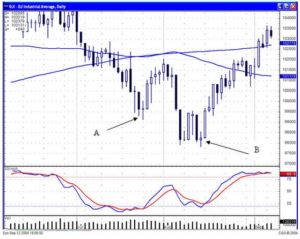
Candlestick analysis can be used with all trading entities. Whether doing a long-term evaluation on a monthly Dow chart or a one-minute chart trading the e-minis, the signals working just as effectively for revealing change in investor sentiment during that time frame. As seen in the daily Dow chart, the Morning Star signals revealed when the Dow established a bottom. Being able to analyze the direction of the DOW increases the probabilities of being in a correct trade when analyzing individual stock charts.
In July and August 2004, the Dow index reversed after Morning Star signals. Note point A, when the stochastics were on an oversold condition, a three-day Morning Star signal appeared. Then, two Morning Star signals appeared a week later, point B, to start the next rally again in the Dow Jones Averages. In both cases, it became very clear to start buying stocks that have produced good Candlestick “buy” signals when the markets are showing buying strength.

Candlestick signals occur in the markets every single day. Scanning software makes finding the signals very easy. They can find the best Candlestick trades in less than 10 minutes every day. This is not rocket science. This is simply using the same successful analysis that has been used for centuries. When you see a Morning Star occurring in an oversold condition, the probabilities of being in a successful trade are very high.
Training Tutorial
Speak Your Mind