Candlestick Kicker Signal = Powerful Profits, Futures Magazine

Do you chase a stock that is already up 12% on the day? What do you do when one of the your stocks announces an earnings warning? What do you do when one of your stock positions announces an SEC investigation and after a pleasant up-trend, it crashes and goes the other direction? Or a company you own announces a huge new surprise contract, reversing its down-trend, gaps up, continues higher. Will prices bounce right back after the news is digested? These situations baffle most investors. However, having the knowledge of Candlestick formations provides huge advantages. The formation that the price move creates is an important function of how to profit from that price movement. 

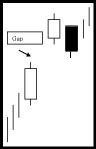
Big dramatic moves! What do you do? Many investors act like deer in the headlights, do nothing as most advisors suggest. But Candlestick analysis tells you instantly what to do. An announcement can completely reverse a trend direction. For example, if a trend has been in progress, whether strong or mild, and a surprise announcement occurs, how that formation rolls out will tell the investor what to do. One viable possibility is observing the previous day’s candle formation, with the open price, then the closing price continuing in the direction of the existing trend. After the announcement, the price alters its direction, opening at the same level as the previous day, a gap open, and proceeding to close in the complete opposite direction of the previous day. This is known as the Kicker signal. It is a high-powered candlestick signal. This signal should never be ignored. It can create huge easy profits.

The Japanese rice traders identified approximately 50 reversal and continuation signals through their centuries of developing candlestick signals. Of these, about 8 major signals will provide more trades than most investors will ever need. We put the Kicker signal in the category of a “major” signal because the results created from the aftermath of the Kicker.

Kicker Top and Bottom Formations

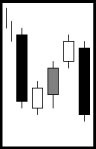
Kicker Top and Kicker Bottom Formations

The Kicker Signal is the most powerful signal of all. It works equally well in both directions. Its relevance is magnified when occurring in the overbought or oversold areas, but is effective no matter where it appears in a price trend. 

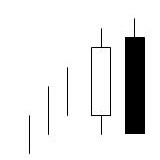
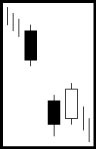
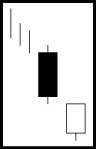
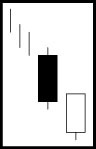
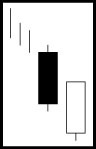
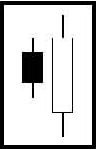
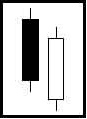
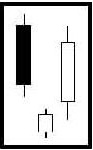
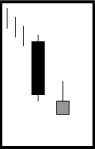
Consider the investment sentiment that formed this pattern. It is formed by two candles. The first candle opens and moves in the direction of the current trend. Investors are continuing with the established trend, closing the price further in the existing direction. Then, something has occurred to violently change the direction of the price. Usually a surprise news item is the cause of this type of move. The signal illustrates such a dramatic change from the current price direction that the new direction will persist with strength for a good while. (There is one caveat to this signal. If the next day prices gap back the other way, liquidate the trade immediately. This does not happen very often, but when it does, get out immediately.) The second candle opens at the same open as the previous day, a gap open, and heads in the opposite direction of the previous day’s candle. The bodies of the candles are opposite colors. This formation is indicative of a dramatic change in investor sentiment. The candlesticks visually depict the magnitude of the change.

Dollar Tree Stores Kicker Signal
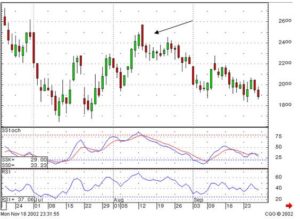
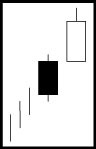
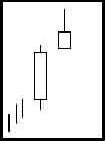
DLTR, Dollar Tree Stores

Due to the change being so dramatic, and the initial reversal effecting a large percent of the price, the trend usually persists in the new direction for an extended period of time. First, the news report takes investors by surprise. The people that heard it from the time it was reported bailed out on the open. Others will hear about the news later, making their investment decisions during the next day or so. Others may not hear about it for a week or so. If it is bad news, the overhanging supply keeps weighing down the price for a few weeks. If it is good news, it will take a good while for the enthusiasm to wane. These moves can usually be substantial, especially if it is moving in the same direction as the market in general.

The Kicker Formula

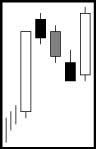
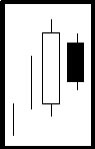
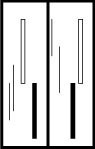
The Kicker Signal is can be easily formulated for search purposes. The position of the signal, in a trend, is not important. The important factor is that a severe change in investor sentiment has occurred. Because the Kicker signal is a two-day signal, two opposite elements are required. First, in a Bullish Kicker Signal, the predominant trend should have been downward. The first day of the signal would have opened, traded down, then closed lower than where it opened.

(O1 > C1)

Day two should have opened equal to or above the open of day one and then closed higher than the open of day two.

AND (O => O1) AND (C > O)

Do not let the magnitude of a kicker reversal signal deter you from making the trade. The announcement or event that created the Kicker signal in that stock is not going to be a one-day affair. It has reversed the direction of investor sentiment. That was the surprise in which the investment community reversed its outlook. The big percentage move, that first day before you got in, is just a small part of the rest of the move.

Many investors will mistakenly wait for the price to pull back so that they can get in. The candlestick investor does not want to see a pullback. The buyers should maintain their buying to make this trade a strong one. To wait for a pullback is not the buying pressure that you would want for a strong up-move stock.

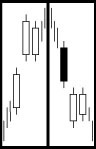
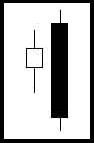
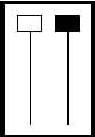
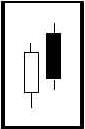
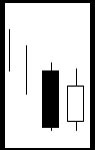
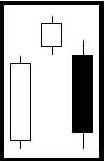
The Bearish Kicker Pattern has the opposite formulas. Of course the trend should be in a predominantly upward direction. Usually a bad news announcement will send the stock price crashing. The formula should be.

(O1 < C1)

The open on the following day is equal to or lower than the open of the previous day and continues down, closing lower than the open.

AND (O <= O1) AND (C <= O)

The more overbought when the signal started, the better. Again, the magnitude of the reversal is directly related to the strength that should be conveyed in the remaining portion of the new trend. Do not be afraid to participate in the move despite the magnitude of the initial move. Because the news was a surprise, it will take at least a few days, if not much longer, for the investment community to digest and assess the ramifications of the surprise.

Candlestick Advantage

Knowing what a candlestick signal looks like creates tremendous profit making advantages. If a surprise announcement occurs, the Candlestick trader can take advantage of the price movement immediately versus waiting to see what direction the trend will evidentially take. These opportunities will happen almost every day. Having the proper search criteria provides a constant supply of highly profitable trades. In a universe of 9,900 stocks, it is likely that one or two will have a surprise external event that will drastically alter the perception of the future of those companies. Violent price moves usually leave investors in their tracks. Having the foresight of what candlestick signals can be forming creates great opportunities to make big profits. Somebody is taking advantage of the big profit situations. No reason it can’t be you.

Training Tutorial available on The Kicker Signals

Selling Puts – Bullish Options Trading Strategy

Selling a put is very similar to a covered call, only with a slightly different perspective. When you write a covered call you are speculating that the stock will go up or stay the same. With a covered call, you must own the stock, so your risk is losing money to a falling stock. In order to make money with a covered call, you need for the stock to go up, or even sideways. Learning the technique of selling puts is a valuable step in becoming a successful trader.

Selling a put, however, does not require you to own the stock in advance. This is the beauty of playing the stock market by selling puts. You can sell puts on margin; although it is necessary to research the margin requirements carefully. For put selling, margin requirements vary from broker to broker. When you sell puts, the “premium” collected for the trade is deposited into your account on the day your trade is entered into.

There are a number of different reasons why you might want to sell a put on a stock. As mentioned earlier, with a covered call, it is necessary for the stock to go up or sideways to realize a profit. When selling a put, it is possible to make money investing in stock several different ways, including when the stock is going down.

These ways are:

  1. If the stock goes up, your put expires and you earn the premium.
  2. If the stock stays flat, your put would also expire, leaving you to earn the premium.
  3. If the stock drops less than the difference of the selling price and the put, you would again earn the premium.
  4. If the stock shows a weakness that you consider temporary, you can “buy back with a roll out”. This means that you buy back your option, and then sell the put for the next month. This essentially buys you extra time for your stock to move positively. The entire process would move out one month and the same parameters. This is a key benefit in being able to perform stock technical analysis. By learning how to read stock charts, an investor is better able to predict unfavorable movements in a stock and react.
  5. Finally, you can use marginable stocks in your portfolio to sell puts on additional stock which you can purchase below the current market price.

Once again, while there are a number of ways to earn money selling puts, and two primary ways to lose money. First, if you hold a weak stock past its strike price and sell, you actually create a situation where you lose on your investment. Second, is that someone will “put” the stock to you at the put price. If your stock drops below the put price, minus premium, and someone puts the stock to you, you will lose money. This can be avoided with a “buy back with a roll out” or a simple buy back on your option. As you might expect, a sound investor takes care to close positions before being put to minimize the risk; this is a basic concept of learning to invest in the stock market.

Selling puts is a great way to accumulate stocks for a discounted price. This is a strategy that can potentially be used with your IRA to form a plan for long term investing. Many IRA underwriting companies may not allow you to do this; the IRS and SEC have deemed such a practice to be a suitable way to invest in your IRA.

Return to main Options Trading Category

How Does Crude Oil Affect The Markets?

Oil prices are still having an effect on the market trends. However what used to be a potential damper on the DOW’s and NASDAQ’s upward movement might now be a stimulant. Crude oil future prices showed signs of bouncing off the 50 day moving average this past week but on Friday, the crude oil chart formed a bearish engulfing pattern. A lower open on Monday may indicate that the consolidation. At the 50 day moving averages over and may be ready for its next down leg. If we see that occur, that could be adding strength to the market indexes. Candlestick charts make this analysis very easy.

October Crude Oil

Note the distinctive Bearish Engulfing signal three weeks ago. The pullback came back exactly to the obvious support, the 50 day moving average. At that point, the stochastics were in the oversold condition when witnessing the doji forming right on the 50 day moving average. From there it acted as a support level for crude oil prices. However, on Friday the bearish engulfing signal, although it came right back to the 50 day moving average, might indicate further weakness in oil prices if we see a weak trading day on Monday. A breach of the 50 day moving average could make the next target at the 200 day moving average at the $35.60 area. 

Oil prices declining to $36 a barrel would put some new life in the stock market indexes. This past week the semi-conductors charts revealed a very strong reversal signal. The majority of the stocks in that sector have been in a steady decline for the past few months, some giving up more than half their price value. As mentioned in the morning comments area this past week, when a large number of charts, all in the same sector move with the same patterns, especially with gap ups following major reversal signals, it is a sign that the whole industry has had a dramatic change in investor sentiment. The gap-up buying indicates that a lot of force has entered the positions. Review our recommended list and study the semiconductor charts in general. The best time to participate in profitable price moves is when the moves are just beginning. The initial buying is now being hampered by any profit taking until higher levels.


Market Direction – For the past week or so, the moving averages have come into play in the recent market trends. The NASDAQ spent a week trying to come up through the 50 day moving average. Although it had some weak signals as it approached the 50 day moving average, it never had any trading to the downside that confirmed the weak signals. You’ll note in the NASDAQ chart that although the stochastics were pulling back, the price movement traded relatively flat. This was a sign that a consolidation period was in affect versus a reversal. The trading of Thursday and Friday turned the stochastics back in upward direction. The close above the 50 day moving average on Friday, with stochastics facing up, should now give us the potential target of the 200 day moving average. Remember, that is now a potential target, the signals should reveal if and when that target might be hit.

NASDAQ Response to Oil Price Change

NASDAQ Response to Oil Price Change

Note how the stochastics showed a downward bias after coming up to the overbought area while the Nasdaq prices held fairly steady. As you may have seen in the market comments through this time period, it was recommended to have a mix of both long and shorts until the trend of the market could be identified. The trading of Friday demonstrated what the investor sentiment was going to be when testing the 50 day MA. Anticipate more days to the upside.

Likewise, in the Dow chart, prices came up through the 50 day moving average. For a couple of days, it pulled back, but did a hammer signal on Friday. This revealed that they did not want to close at below the 50 day moving average. The next resistance should be the trend line coming through the tops of the trading in April and June. A close above the June top would indicate that the slow waffling downtrend may be turning into an upward trend.

Stock market community at the Candlestick Forum site

A stock market community has many benefits when learning a new investment technique. The stock market community that has developed at the Candlestick Forum site is a valuable tool for learning how to use candlestick signals correctly. Members have the opportunity to be part of the stock market community participating in the chat room. That chat room becomes a useful tool for solidifying candlestick analysis thought processes. The chat room, as well as the forum, provides a format for asking questions and getting answers that may have a different perspective. Going through a learning process benefits greatly when different analytical aspects can be brought to your attention.

The stock market community on the chat room produces immediate feedback. The creation of a community that is all in the process of trying to learn how to improve their investment abilities is a valuable asset when an investor wants to clarify how candlestick signals should be analyzed. This same stock market community receives the benefit of the Monday night members chat session. This session goes more in-depth into the existing positions that have been recommended on the site. An explanation of why the position was established and when to close out the position becomes instrumental for an investors learning curve.

Candlestick analysis is very simple. It becomes much easier to learn with constant contact with an investment group. Learning any new investment technique creates questions. When those questions can be answered immediately and by many different levels of experience, a much more concise analysis can be learned in a much quicker time frame. The 12 major signals are the core of candlestick analysis. Learning just those 12 signals provide more trading opportunities than most investors will ever require. To become successful in the stock market community, an investor should learn how to use these 12 major signals effectively. They not only illustrate when to get into a trade, knowing what each one is supposed to illustrate as far as investor sentiment, makes profit taking and stop loss procedures very easy to implement. Click here for the 12 major signal training package special.

Market direction – What could have been the possibility of a Blue Ice Failure has now completely changed. Being able to recognize what patterns may be setting up and what candlestick signals are forming allows an investor to shift portfolio positions immediately if a pattern is not working. The failure of the 50 day moving average by the Dow on Tuesday created the possibility of a Blue Ice Failure pattern which would anticipate the next target being the 200 day moving average. However, the bullish candlestick signals changed that scenario.

Dow 4
Positive NASDAQ on a Day with an Indecisive Dow

Not so much in the Dow, but the bullish signals appeared in the NASDAQ and the S&P chart. Both had Bullish Haramis formed on Wednesday. This was the immediate indication that the selling had stopped. That information now negates the possibility of a Blue Ice Failure. A new scenario should now be analyzed.
What happens the first time a major moving average is touched? Usually it fails. But the next approach usually breaches that moving average. With the Bullish Haramis in the NASDAQ and the S&P chart, indicating bullish strength, the analysis on the Dow should be anticipating the second approach of the 50 day moving average to breach that level. This analysis diminishes the negative sentiment that was revealed on Tuesday. 

Finding Stock Price Breakouts Using Candlestick Signals

One of the most profitable trading strategies is identifying stock price breakouts. Stock price breakouts incorporate one simple element. Something new and dramatic has occurred in a stock price, making it extremely desirable for investors to get into the position quickly. A breakout pattern is very easy to scan for and identify. Utilizing Candlestick signals creates an easy platform for maximizing profits once a breakout has occurred. The signals provide the ability to determine whether to get into a stock trade after a huge percentage move immediately or wait for the profit-taking pullback. This can be done with some very simple analytical techniques.

Breakouts occur due to a change in world events or a dramatic change in the fundamentals of a company. As illustrated in the INVN chart, a world event changed the fortunes of this company. 9/11 made the product of this company a high profit potential.

INVN is a manufacturer of the luggage scanning machines for airports. The interest in their product after 9/11 moved the stock price from $2.50 to over $45 in approximately 4 months. What was the best way to trade this position? The black candle on the breakout day provided a much different scenario than if a white Candlestick had formed that day. How investors react to news, whether a world event or a product specific announcement for a company, has a great influence on how the trend will perform from that point.

INVN Breakout

INVN

Currently the AVII chart is illustrating a breakout situation. Recent news announcements have taken the lethargic trading into new recent highs. Volume becomes a very important factor for identifying a breakout situation. The probabilities are extremely high that once a breakout in price occurs, especially out of a very boring trading pattern, the uptrend will continue for a reasonably long period of time, due to the new interest that has come into the stock. The large volume trading days, going from approximate 200,000 shares a day to well over 2 million shares a day clearly demonstrates that new interest has entered the stock.

Once large percentage gains have occurred, pullbacks should be expected. How these pullbacks are portrayed with Candlestick signals is a very important factor for evaluating whether a profit-taking pullback is occurring or the uptrend is over. Having this knowledge greatly enhances the ability to ride through a strong positive move without getting out too soon.

AVII Breakout
AVII

Market Direction – The Morning Star signal in the Dow with stochastics in the oversold area has been the overriding reversal signal. What could have been a potential of a Double Bottom, or at least a test of the recent lows, was eliminated as buying brought the Dow index back up through Wednesday’s open. Wednesday’s Bullish Engulfing signal with stochastics closer to the oversold area than the overbought area illustrates that the buyers are still in control. The profit-taking of Tuesday and early Wednesday adds to the health of this uptrend.

Dow Breakout

The Dow

Continue to hold long positions in strong sectors. The uptrend should eventually test the 50 day moving average and the 200 day moving average.

Candlestick Engulfing Patterns – Neon Signs to Buy and Sell, Stocks & Commodities Magazine

The most striking facet of Japanese candlesticks is their ease of identification. Hundreds of years ago, Japanese rice traders become ultra-wealthy using Candlestick signals to trade rice. These signals were developed through simple observation. As years of successful utilization of the signals progressed, they even were able to analyze the psychology behind forming the signals. This provided a very powerful tool for projecting future price movement.

Two of the most compelling candlestick signals are the Bullish Engulfing Pattern and Bearish Engulfing Pattern. They are most effective when founding the oversold area, at the end of a substantial downtrend or the overbought area for the Bearish pattern. The Bullish Engulfing pattern consists of two bodies. The first body is the same color as the current trend, the second is the opposite color. The signal day opens lower than the previous days close, then it trades higher so by the end of the day, it will close above the previous days open. This new white candle now engulfs the previous days candle, known as the DAKI, or the embracing line.

Bullish Engulfing Pattern

Bullish Engulfing Pattern

Witnessing a white bullish candle, engulfing the previous black candle, stands out like a neon sign after a series of black candles. It becomes very plain to see that a change has occurred in investor sentiment. A couple of simple factors make the Bullish Engulfing pattern more convincing. The bigger the previous days candle being engulfed, the more effective the new trend signal will be. Or the lower the open of the white candle, then coming back up to engulf the previous day, the more powerful the next advance should be.

The formula is relatively simple:

(O1>C1) and (O O1). Defined as the open of yesterday is greater than the close of yesterday. And the open today is less than the close of yesterday, And the close of today is greater than the open of yesterday. 

The Bullish Engulfing pattern represents a complete change in investor sentiment. Using this pattern as a buy signal eliminates the need to grab for the fallen knife. When is “low” the right time to buy? The Bullish Engulfing pattern reveals when the buyers have stepped in. Note in the Dow Jones industrial chart that the whole market sentiment reversed at the Bullish Engulfing formations. The signals work equally well when analyzing indexes as they do for individual stocks, commodities, futures or any other trading entity.

Having the knowledge of just eight or nine Candlestick signals, the Bullish and Bearish Engulfing patterns being on that list, produces huge advantages for analyzing the direction of the markets in general. This reinforces the analysis of an individual stock price. Training Video for Engulfing Patterns 

Dow Jones Industrials, Bullish Engulfing

Dow Jones Industrials

The Bearish Engulfing pattern is the exact opposite that of the Bullish Engulfing pattern. After an obvious uptrend, the bulls finally gap it open due to their exuberance to get in the position. If stochastics are showing that this is occurring in the overbought area, the candlestick investor becomes very diligent. A gap, however slight, away from the previous days close, should alert the candlestick investor that the trend may be ending. If long, putting a stop one half way down the last bullish candle is usually prudent. If trading comes back through that point and closes below the open of the previous day, a bearish engulfing pattern has formed. Now you can short the stock with confidence. If nothing more than being long, you now know to close the position. Knowing the direction of the market allows the investor to establish positions with more confidence. Knowing that the market indexes have turned positive permits an investor to commit funds to the long side with more aggression than normal. As seen in the above DOW chart, being able to visualize the Bullish Engulfing patterns after extensive downtrend would have allowed an investor to get in and make impressive profits.

As in the Bullish Engulfing pattern, the Bearish Engulfing pattern is very easy to see. It stands out as a blatant change of direction in the trend. The white bodies in the uptrend now have a large black candle stopping the trend.

Bearish Engulfing

Bearish Engulfing Pattern

The black candle acts as an obvious sign against the uptrend. The formula is exactly opposite of the Bullish Engulfing pattern formula. ( C1 >O1) and the(O>C1) and (C>O1), The close of the first day is higher than the open, thus a white candle. The next day has an open than is higher than the previous day’s close and closes lower than he previous days open.

The visual depiction of a Bearish Engulfing pattern creates an ominous darkness at the top of a trend. It does not take learning complicated formulas or analyzing numerous indicators to understand a candlestick signal.

Enron Bearish Engulfing Pattern

Enron

Note how the Bearish engulfing pattern terminates the uptrend in the Enzon Inc. chart.. As the trend persists, buyers finally get so exuberant, they gap the price up. It immediately starts losing ground until it finally closes lower than where it opened the previous day. This clearly illustrates that the sellers have gained strength. That confirmation of selling starts a trend of selling.

The Engulfing patterns are statistically valid for indicating reversals at the tops and the bottoms. As stated early, the signals are highly accurate when a bullish Engulfing pattern is witnessed during oversold conditions. Conversely, the Bearish Engulfing pattern is valid in the overbought area. But both have a recognized indicator at the other end of a trend. A big bullish Engulfing pattern observed at the top of a trend usually represents the last gasp of the trend. The same occurs at the bottom of a trend with the Bearish Engulfing pattern. The last gasp sellers create a bearish engulfing pattern which usually is followed by increased buying. Remembering this fact provides another opportunity to extract profits out of a price trend. When the “hopeful” are buying once more at the top or the “panicked” are selling their last stock position at the bottom, the Candlestick investor is already familiar with what that last bullish or bearish engulfing pattern indicates at the wrong end of a trend. Putting on positions becomes a comfortable endeavor while everybody else is buying or selling the wrong way.

The Candlestick Engulfing patterns have survived centuries of investment skepticism. The Japanese Rice traders become ultra-wealthy utilizing these patterns. This is not rocket science. Rice traders developed high profit trading programs using purely visual recognition of reoccurring high probability formations. This is the most convincing form of statistical analysis. Use it to your advantage.

Stephen W. Bigalow is author of “Profitable Candlestick Trading, Pinpointing Market Opportunities to Maximize Profits” and principal of the www.candlestickforum.com, the leading website on the Internet for providing information and educational material about Japanese Candlestick investing. Over fifteen years of extensive study and utilization of candlestick analysis has produced an array of easy-to-learn educational material about Candlesticks. As one of the leading Candlestick experts in the nation, Mr. Bigalow, through his consulting with major trading firms, has developed multiple successful trading programs for the day-trader to the long-term hold investor.

Stock Market Trading Tools – Candlestick Signals

Stock market trading tools should have one primary function.  Stock market trading tools should be easy to analyze, evaluate, and improve. Many stock market trading tools have come and gone.  Some work for specific conditions of the markets, others work for only stock market trading. Candlestick signals have been around for centuries.  The benefit of these trading tools is numerous.  They can be used for any trading entity that involves investor sentiment.  This includes stocks, commodities, futures, Forex, bonds or tulip bulbs.

The major advantage of candlestick patterns as a trading tool is that they have been proven to work effectively for centuries. The information incorporated into the signals can be readily applied to enhance emerging trading tools. Extracting profits from a stock market consistently becomes much easier when applying candlestick signals with common trading patterns. Investor psychology moves prices in waves. This has been occurring ever since the beginning of mankind. Applying candlestick signals to reoccurring trading patterns become a very high probability trading platform.

As illustrated and Steve Bigalow’s new book, “High Profit Candlestick Patterns” a Jay-hook pattern produces extremely good profits. It is an easy pattern to recognize and using the candlestick signals as trading tools, the investor can identify many potential patterns in their early stages of development.  This allows the investor to maximize profit potential while at the same time reducing losses with simple stop loss procedures.

J-hook

J-Hook Pattern

A Jay-hook pattern is a variation of a wave 1 — 2 — 3 pattern.  It becomes an easy pattern to identify with the use of candlestick signals.  The problem most investors have is understanding when to sell after a price has made a strong move.  The Jay-hook pattern demonstrates some easily identifiable attributes.  First, it starts with a strong uptrend, a trend that usually produces “stronger than normal” returns in a very short period of time.  This strong up-move is significant enough to create the normal wave pattern. A reversal caused by profit taking, followed by a declining the trajectory of the pullback, then the continuation of the uptrend.  The Jay-hook pattern is the description of the pullback that starts to round out at a bottom and starts moving back up, thus forming a ‘hook.’

This pattern provides the candlestick investor with some very simple profitable applications.  The first uptrend will usually show clear candlestick ?sell? signals when it comes to an end.  The top may be formed with the stochastics in the overbought area or very close to the overbought area.  Because all the strong initial uptrend, the first evidence of ?sell? signals should be acknowledged.  Even if it is suspected that the uptrend could be forming a Jay-hook pattern, why a risk remaining in the trade?  When a sell signals become evident, take profits.

What criteria makes a candlestick investor suspect a Jay-hook pattern to form?  The analysis of the market trends in general should provide that information.  For example, if a stock price has had a strong run up while the market indexes have had a steady uptrend, and the market indexes do not appear to be ready for a significant pullback,  then a strong stock move could warrant some profit taking before the next move up.  The benefit of being able to identify candlestick signals is being prepared for the witnessing of some candlestick ?buy? signals after a few days of pullback.  These signals would also alter the trajectory of the stochastics that will be pulling back.
 
Opportunity is missed by most because it is dressed in overalls and looks like work. ? Thomas Alva Edison
 
Witnessing Doji’s, Hammers, Inverted Hammers or Bullish Haramis, after a few days a pullback becomes an alert that the selling is starting to wane.  If the stochastics are flattening out during that same time frame, then a set-up for a Jay-hook pattern is taking place.  Taking profits when the first sell signals occurred in the initial uptrend eliminates the downside risk.  Those candlestick ?sell? signals indicate that it is time to get out of the trade.  Even though the strength of the initial move would warrant  suspecting  a Jay-hook pattern to form, there is no guarantee that the pullback couldn’t retrace 20%, 40%, 60% or even greater of the initial up-move.

This creates a trading strategy that allows for an investor to utilize the common sense built into the candlestick signals. When it is time to get out, get out!  If after four days, small candlestick buy signals start forming, there is nothing wrong with buying back into the position.  The second entry of this trade now has some targets that can be clearly defined.  The first target should be the test of the recent high.  Although this may not be a huge percentage return moving to that level, at least the probabilities indicate that it should be profitable.

The benefit of candlestick signals once again can be applied if and when that recent high is tested. Witnessing another sell signal, as the price approaches the recent high trading level, would be a clear indication that the recent high was going to act as resistance.  This would induce taking quick profits and getting back out of the trade.  On the other hand, if strong signals are seen as the recent high is breached, that would be a clear indication  the  high was not going to act as a resistance level. A new leg of the trend may be in progress.

Continuation Patterns Found In Candlestick Charting

Most Candlestick signals are reversal patterns; however, there are periods of trends that represent rest. The Japanese insight is, “there are times to buy, times to sell, and times to rest.” Once a pattern is recognized, it is suggesting a direction for future price movements. Continuation patterns found in candlestick charting help with the decision-making process. Whatever the pattern, a decision has to be made–even if the decision is to do nothing.

Learning the continuation patterns found in candlestick charting has important features. In some cases, differences between reversal patterns and the continuation of a trend can be subtle. Candlestick Charting provides the knowledge of how minor price variations can affect the direction of a trend can lead to enhancements of profits. As the candlestick charts are studied, recognizing the differences will greatly alter investment strategies.

For easier reference, continuation patterns found in candlestick charts have a section of their own. Each week we will select a continuation pattern and break it down into detail with the description, pattern criteria, and pattern psychology from the list below.

UPSIDE TASUKI GAP

Upside Tasuki Gap

Pattern Description with criteria and Pattern Psychology

DOWNSIDE TASUKI GAP

Downside Tasuki Gap

Pattern Description with criteria and Pattern Psychology

ON NECK LINE

On Neck Line

Pattern Description with criteria and Pattern Psychology

IN NECK LINE

In Neck Line

Pattern Description with criteria and Pattern Psychology

THRUSTING

Thrusting

Pattern Description with criteria and Pattern Psychology

FALLING THREE METHOD

Falling Three Method

Pattern Description with criteria and Pattern Psychology

RISING THREE METHOD

Rising Three Method

Pattern Description with criteria and Pattern Psychology

SIDE-BY-SIDE WHITE LINES

Side by Side White Candles

Pattern Description with criteria and Pattern Psychology

SEPARATING LINES

Separating Lines

Pattern Description with criteria and Pattern Psychology

MAT HOLD

Mat Hold

Pattern Description with criteria and Pattern Psychology

THREE-LINE STRIKE

Three Line Strike Small

Pattern Description with criteria and Pattern Psychology

UPSIDE GAP THREE METHOD

Upside Gap Three Method

Pattern Description with criteria and Pattern Psychology

Gap-Up At The Bottom

There are technical analysis basics that can greatly enhance the production of extraordinary profits in the markets. Candlestick signals amplify the ability to identify high profit chart patterns. The visual aspects of Candlestick signals make evaluating high profit trades very easy.

One of the technical analysis basics is identifying a Candlestick bullish signal followed by a gap-up. A gap, witnessed after a Candlestick “buy” signal, also has powerful implications. Knowing that a gap represents enthusiasm for getting into or out of a stock position creates the forewarning that a strong profit potential situation is about to occur or has occurred. Where is the best place to see rampant enthusiasm? At the point you are buying, near the bottom. Obviously, seeing a potential Candlestick “buy” signal, at the bottom of an extended downtrend is a great place to buy. In keeping with the concepts taught in Candlestick analysis, we want to be buying stocks that are already oversold, to reduce the downside risk. What is even better to see is the evidence that buyers are very eager to get into the stock.

Reiterating the technical analysis basics of finding the perfect trades, as found in the book “Profitable Candlestick Trading”, having all the stars in alignment makes for better probabilities of producing a profit. The best scenario for a high profit trade is a Candlestick “buy” signal, in an oversold condition, confirmed with a gap-up the following day.

As illustrated in the Bombay Company Inc., the uptrend was obviously instigated after a gap-up and large bullish candle following a Doji. The fact that prices gapped up was immediate demonstration that buyers wanted to get into this stock with great fervor.

Bombay

Unofficially, statistics illustrate an 80% or better probability that a trade will be successful when stochastics are oversold, a Candlestick “buy” signals appears, and prices gap up. (The Candlestick Forum will offer our years of statistical figures as “unofficial.” Even though over fifteen years of observations and studies have been involved, no formal data gathering programs have been fully utilized. However, the Candlestick Forum is currently involved with two university studies to quantify signal results. This is an extensive program endeavor. Results of these studies will be released to Candlestick Forum subscribers upon completion.)

Having this technical analysis basic statistic as part of an investor’s arsenal of knowledge creates opportunities to extract large gains out of the markets. The risk factor remains extremely low when participating in these trade set-ups.

Many investors are afraid to buy after a gap-up. The rationale being that they don’t like paying up for a stock that may have already moved 3%, 8%, 10%, 20% already that day. Witnessing a Candlestick “buy” signal prior to the gap-up provides a basis for aggressively buying the stock. If it is a the bottom of a trend, that 3%, 8%, 10% or 20% initial move may just be the beginning of a 50% move or a major trend that can last for months.

Utilizing this technical analysis basic concept will dramatically increase the potential of profits being produced in one’s portfolio. This is not difficult analysis. Candlestick analysis is the application of common sense investment practices put into graphic depiction.

Training Tutorial
Gap at the Bottom

How To Trade The Stock Market Using The Major Candlestick Signals

The Major Signals

Doji

Doji

DOJI Recognition: The open and close are the same or very close to the same.

Pattern Psychology: The Bulls and the Bears are conflicting. This is an alert to investors to take heed for possible trend reversal.

Related Articles: How To Trade the Doji SignalThe Dynamic Doji

Training Tutorial: Dynamic Doji

View Current Charts & Lists of Stocks for  Doji Stock Screens


Bullish Engulfing Pattern

Bullish Engulfing

BULLISH ENGULFING Recognition: The body of the second day completely engulfs the body of the first day. Shadows are not a consideration.

Pattern Psychology: This pattern suggests the Bulls are stepping in with force, suggesting prices will move up.

Related Articles: How to Trade the Bullish Engulfing SignalCandlestick Engulfing Patterns

Training Tutorial: Bullish Engulfing

View Current Charts & Lists of Stocks for Bullish Engulfing Stock Screens

Bearish Engulfing Pattern

Bearish Engulfing

BEARISH ENGULFING Recognition: The body of the second day completely engulfs the body of the first day. Shadows are not a consideration.

Pattern Psychology: This shows the Bears are overwhelming the Bulls, suggesting prices will move down.

Related Articles: How to Trade the Bearish Engulfing SignalCandlestick Engulfing Patterns

Training Tutorial: Bearish Engulfing

Hammer Hanging Man

Hammers and Hanging Man

HAMMERS and HANGING-MAN

Recognition: The lower shadow (or tail) should be at least two times the length of the body. The color of the body is not important although a black body has slightly more Bearish indications and a white body has slightly more Bullish indications.

Pattern Psychology: This pattern at the bottom of a down trend is called a Hammer. This pattern at the top of an uptrend is called a Hanging-Man

Related Articles: How to Trade The Hammer Signal, How to Trade the Hanging Man

Training Tutorials: HammerInverted HammerHanging Man

Piercing Pattern

Piercing Pattern

PIERCING PATTERN Recognition: A two candle pattern, the body of the first candle is black and the body of the second candle is white. The white day opens lower, under the trading range of the previous day. The price closes above the 50% level of the black body.

Pattern Psychology: After a strong downtrend, the atmosphere is Bearish but before the end of the day the Bulls step in and price closes near the high of the day.

Related Articles: How to Trade the Piercing Pattern

Training Tutorial: Piercing Pattern

Dark Cloud

Dark Cloud

DARK CLOUD Recognition: A two candle pattern, the body of the first candle is white and the body of the second candle is black. The black day opens higher, above the trading range of the previous day. The price closes below the 50% level of the white body.

Pattern Psychology: After a strong uptrend, the atmosphere is Bullish but before the end of the day the Bears step in and price closes near the low of the day.

Related Articles: Stock Trading Methods, How to Trade the Dark Cloud Signal

Training Tutorial: Dark Cloud Cover

Bullish Harami

Bullish Harami

BULLISH HARAMI Recognition: A two candle pattern forming in a down trending price pattern. The body of the first candle is the same color as the current trend and should be a long black candle. The body of the second candle is white and opens and closes within the body of previous day’s candle.

Pattern Psychology: After a strong downtrend the Bulls step in and open the price higher than the previous day’s close. This concerns the Bears and the shorts start covering their positions. A strong day after that would convince everybody that the trend may be in a reversal.

Related Articles: How to Trade the Bullish Harami, The Harami – A High Profit Candlestick Signal

Training Tutorial –  Harami Pattern

Bearish Harami

Bearish Harami

BEARISH HARAMI Recognition: A two candle pattern forming in an up trending price pattern. The body of the first candle is the same color as the current trend and should be a long white candle. The body of the second candle is black and opens and closes within the body of the previous day’s candle.

Pattern Psychology: After a strong uptrend the Bears step in and open the price lower than the previous day’s close. The price finishes lower for the day and the Bulls are concerned and begin taking their profits.

Related Articles: How to Trade The Bearish Harami The Harami – A High Profit Candlestick Signal

Training Tutorial: Harami Pattern

Morning Star

Morning Star

MORNING STAR Recognition: A three candle pattern at the bottom of a downtrend.The body of the first candle is black, confirming the current downtrend. The second candle is an indecisive formation. The third candle is white and should close at least halfway up the black candle.

Pattern Psychology: After an apparent downtrend the Bulls step in and open the price higher than the previous day’s close. The price finishes higher for the day and the Bears are concerned and begin covering their short positions.

Related Articles: How to Trade the Morning Star Signal, Morning Star Reversal Signal

Training Tutorial: Morning Star & Evening Star Signals

Evening Star

Evening Star

EVENING STAR Recognition: A three candle pattern at the top of an uptrend. The body of the first candle is white, confirming the current uptrend. The second candle is an indecisive formation. The third candle is black and should close at least halfway down the white candle.

Pattern Psychology: After an apparent uptrend the Bears step in and open the price lower than the previous day’s open. The price finishes lower for the day and the Bulls are concerned and begin selling to take their profits.

Related Articles: How to Trade the Evening Star Signal    Swing Trading with an Evening Star Signal

Training Tutorial: Morning Star & Evening Star Signals

Kicker Signals Bearish and Bullish

Kicker Signals

Kicker Signals Bearish and Bullish Recognition: The first day’s open and the second day’s open are the same BUT the price movement is in opposite directions.

Pattern Psychology: The Kicker Signal demonstrates a dramatic change in investor sentiment. The longer the candles, the more dramatic the price reversal.

Related Articles: What is the Strongest Candlestick Signal – The Kicker!, Technical Analysis that Produces Big Profits

Training Tutorial: Kicker Signals

Shooting Star

Shooting Star

SHOOTING STAR Recognition: One candle pattern appearing in an uptrend. The shadow (or tail) should be at least two times the length of the body. The color of the body is not important, although a black body has slightly more Bearish indications.

Pattern Psychology: After a strong uptrend the Bulls appear to still be in control with price opening higher, but by the end of the day the Bears step in and take the price back down to the lower end of the trading range. Lower trading the next day reinforces the probability of a pullback.

Related Articles: How to Trade the Shooting Star Signal

Training Tutorial: The Shooting Star

Inverted Hammer

Inverted Hammer

INVERTED HAMMER Recognition: The upper shadow should be at least two times the length of the body. The real body is at the lower end of the trading range. There should be no lower shadow or a very small lower shadow.

Pattern Psychology: After a downtrend has been in effect, the atmosphere is Bearish. The price opens and trades lower but before the end of the day, The Bulls step in and take the price back up. A higher open or a white candle the next day reinforces buying.

Related Articles: Technical Analysis SimplifiedHow to Trade the Inverted Hammer

Training Tutorial: The Inverted Hammer