One of the most effective commodity trading systems is the analysis of Candlestick signals. Candlestick signals were developed trading rice for hundreds of years. Most commodity trading systems are usually implemented using fundamental analysis to determine what the supply and demand of that particular commodity will be in the future.
Candlestick signals provide a very effective format for setting up profitable commodity trading systems.
Commodities, usually leveraged extensively for trading purposes, need to have a trading system that immediately tells you what is going on with price movement. A small move in price can affect profits dramatically one way or the other.
Commodity trading systems require much closer analysis. Major reversals in trends are much more easily identified when using Candlestick signals. In normal commodity trading movements, “normal” meaning other than extraordinary events causing massive price movements, investor sentiment is much easier to identify than in the equities. The investor sentiment usually evaluates the supply and demand influencing that commodity price.
Crude Oil prices can be effectively analyzed. The major corporations that utilize commodity trading systems for hedging their energy or inventory costs can benefit immensely through Candlestick analysis.
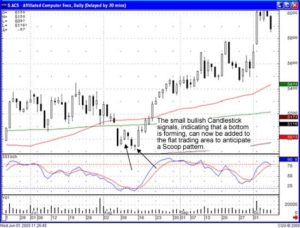
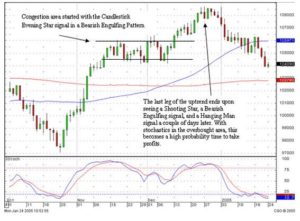
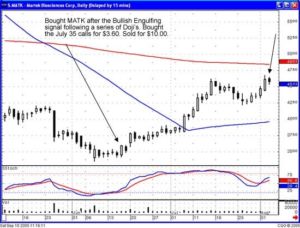
As demonstrated in the Crude Oil chart, the June contract, the recent Dark Cloud signal illustrated that crude oil prices may not have too much strength left in the current up-move. A gap down below the 50 day moving average was an indication that investor sentiment was back to the bearish direction.
Commodity trading systems evaluated correctly can also be utilized for analyzing the direction of the equity markets. Crude oil prices, which have recently been affecting the market direction, are a prime example.
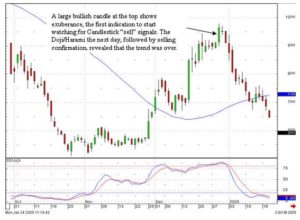
The fact that crude oil prices are now showing weakness, due to the larger than expected reserves, can add strength to the equity markets. For commodity traders, the analysis of the weak Candlestick signals, close to the 50 day moving average, becomes a clear indication that prices might be in a bearish mode.
One of the most effective commodity trading systems is the analysis of Candlestick signals. Candlestick signals were developed trading rice for hundreds of years. Most commodity trading systems are usually implemented using fundamental analysis to determine what the supply and demand of that particular commodity will be in the future.
Candlestick signals provide a very effective format for setting up profitable commodity trading systems.
Commodities, usually leveraged extensively for trading purposes, need to have a trading system that immediately tells you what is going on with price movement. A small move in price can affect profits dramatically one way or the other.
Commodity trading systems require much closer analysis. Major reversals in trends are much more easily identified when using Candlestick signals. In normal commodity trading movements, “normal” meaning other than extraordinary events causing massive price movements, investor sentiment is much easier to identify than in the equities. The investor sentiment usually evaluates the supply and demand influencing that commodity price.
Crude Oil prices can be effectively analyzed. The major corporations that utilize commodity trading systems for hedging their energy or inventory costs can benefit immensely through Candlestick analysis.
As demonstrated in the Crude Oil chart, the June contract, the recent Dark Cloud signal illustrated that crude oil prices may not have too much strength left in the current up-move. A gap down below the 50 day moving average was an indication that investor sentiment was back to the bearish direction.
Commodity trading systems evaluated correctly can also be utilized for analyzing the direction of the equity markets. Crude oil prices, which have recently been affecting the market direction, are a prime example.
The fact that crude oil prices are now showing weakness, due to the larger than expected reserves, can add strength to the equity markets. For commodity traders, the analysis of the weak Candlestick signals, close to the 50 day moving average, becomes a clear indication that prices might be in a bearish mode.
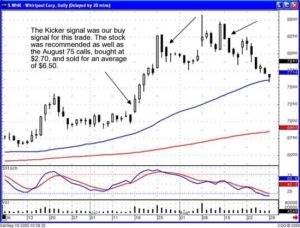
Being able to analyze a commodity chart can produce extremely large profits. Not only does Candlestick analysis produce profitable trades, the stop loss process involved with Candlesticks allows an investor to set up a format for cutting losses quickly.
To learn more about Commodity and Futures Trading – Click Here for our Free 10 Part Lesson
Learn the 12 major signals in Candlestick analysis and you can develop very effective commodity trading systems.