The first step to understanding the stock market is to understand basic stock information. By knowing what a share of stock is, it is easier to understand the workings of the entire stock market. Before you begin investing in the stock market, it’s time to get your basic stock information.
Among the stock market basics, the share is the smallest unit of ownership in a company. The size of a share varies from company to company. It can even vary within one company as it issues more shares or buys back shares that were previously issued. If you own a share of stock in a company, you are a part-owner of that company. The sum total of all your stock holdings is called your stock portfolio. If a company issues dividends, or profits, to the shareholders, you will likely receive money based on the number of shares you own. Each year, companies issues corporate results and basic stock information for their shareholders to review.
One of the stock investing basics of stock ownership is the concept of limited liability. If Ford loses a lawsuit and must pay a huge judgment, the worse that can happen is your stock becomes worthless. This is basic stock information, but important to know; creditors can’t come after your personal assets. Whether as the result of a lawsuit or creditors, the worst losses you will experience investing in companies are losses on struggling stocks.
In the terms of basic stock information, the two types of stocks are:
- Common stock – This is the type of stock held by most individuals. Those holding common stock have voting rights as well as the right to receive dividends. Whenever you hear that a stock is going up or down, the reference is being made to common stock. While not all publicly traded companies have preferred stocks, all publicly traded companies have common stocks.
- Preferred stock – In spite its name, preferred stock has fewer rights than common stock, except with regards to dividends. Companies that issue preferred stocks usually pay consistent dividends and preferred stock has first call on dividends over common stock. Investors buy preferred stock for its current income from dividends, so look for companies that make big profits to use preferred stock to return some of those profits via dividends.
Liquidity
Another piece of basic stock information is that common stocks can easily be bought or sold, or they are highly liquid. Not all companies are traded daily but most of the larger companies appear daily on the stock market, giving investors the opportunity to buy or sell shares.
Conclusion
Learning how to invest in stocks is really a product of learning basic stock information and learning to understand to dynamics of a fascinating market. After learning basic stock information, forming a stock trading plan, and understanding technical analysis, a trader can begin to enjoy the hectic world of the stock market.
Market Direction
There are some very simple rules in candlestick analysis. Most recently, we have been discussing that an up trend is shown to have reversed after a candlestick sell signal AND a close below the tee line. The opposite is true after a downtrend, a candlestick buy signal followed by a close above the T-line. This scenario occurred around March 10.
A close below the tee line after an extended uptrend clearly reveals a change in trend direction. This set of rules is very good for the longer holding swing trader. Simple commonsense assessments allows an investor to move more quickly. Today’s trading in the Dow is a very clear example of why a candlestick signal being confirmed is the first criteria for a sell decision.
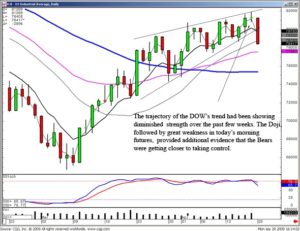
Friday, both the Dow and the NASDAQ formed a Doji in a relatively indecisive trading day, options expiration day. As far as investor sentiment, there was nothing to indicate any change in the bullish trend sentiment. However, there was a Doji formed on Friday. This would not have any major significance other than what had previously been occurring in the downtrend. There had been previous Doji’s followed by selling, usually bringing the trend back down to the T-line. Although the trend continued to stay above the tee line, the magnitude of the trend was diminishing, meaning it looked like the Bulls were running out of steam. Visually being able to recognize that an uptrend is running out of steam makes an investor more prepared. A Doji at the top, followed by strong selling, might have more credence for forming a reversal.
DOW
Logic dictates that if the market appears to be losing strength and another candlestick sell signal has formed, the confirmation of that sell signal may have greater significance. The markets are in overbought conditions. Where is the first potential support level on a pullback? Once again, it could be the T-line. Taking profits on today’s open could have been a non-important activity had the markets supported at the T-line. In most cases, upon seeing the strength showing up at the T-line, many positions could have been repurchased. On the other hand, had the T-line not acted as support, as we witnessed today, the indicators showed the probabilities of closing some trades being greatly in favor of the investor. The market will tell us what the market is going to do. Evaluating that information correctly is very important for maintaining high profits.
A candlestick reversal signal, confirmed, is the first criteria for identifying a change of investor sentiment. The longer a trend persists, the more compelling the reversal signal needs to be. This makes the tee line in extremely important factor. It can be used in the anticipation of a reversal occurring as well as confirming that a reversal has occurred. Note in the FAZ chart, there have been numerous potential reversal signals during the downtrend. However, there should be one observation that indicates the downtrend was still in progress. There was not a breach of the T-line.
FAZ
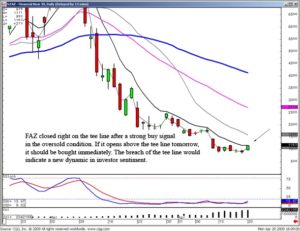
FAZ closed right on the T-line today. How do we use this to our advantage? Very simple, if we know what the tee line has represented in the past, we know what should or should not occur in the future. Today’s trading produced a gap up bullish candle after a Doji signal on Friday. This produced a confirmed buy signal. The only missing requirement was that it did not close above the T-line. Tomorrow’s trading strategy becomes very simple. If the price opens lower and does not show any strength, what can be assumed? The tee line continues to act as resistance. On the other hand, if the price opens above the tee line, a whole new set of assumptions occur. The tee line, which had acted as resistance, was now not acting as resistance after a strong buy signal in the oversold conditions. This would allow an investor to establish a position immediately without any hesitation.
Candlestick analysis is many simple if/then situations. The results are relatively predictable based upon hundreds of years of observations. Because investor sentiment works in constant reoccurring patterns, having the ability to recognize when the signal/patterns have occurred or might be in the process of occurring allows for a much faster execution decision-making process. You will gain bigger profits by recognizing when to move and when to move quickly. Please learn the 12 major signals and the Candlestick Forum patterns. The more knowledge you have about when a price move is about to occur, the better the buy and sell decisions can be made.
Good investing,
The Candlestick Forum Team
Speak Your Mind