Stock Market Correction

The expression, stock market correction, sounds like something was wrong and is now being fixed. Depending upon the point of view of traders and investors involved in the stock market this is sometimes the case. In general a stock market correction is a drop in stock price, usually after a rapid and/or prolonged rise. Typically a decline of as little as five percent and a much as twenty percent in the Dow Jones Industrial Average is the benchmark for a stock market correction. The decline in stock prices happens over a brief period. When stocks decline over a long period it is referred to as a bear market. Unlike bear markets stock market corrections are secondary market trends. A stock market correction is a market reversal superimposed on a steadily rising bull market. Using technical analysis tools such as Candlestick pattern formations traders are able to distinguish between a stock market correction and the start of a persistently downward, bear, market.

Why does a stock market correction occur? That is the part about something being wrong and needing to be fixed. In both long term investing and in day trading it is important to keep an eye on intrinsic stock value. Stock prices may go up and give the impression that there is no end in sight. When this happens stocks become “over bought.” Latecomers to a market rally will try to buy in with the hope of obtaining profits before the trend reverses. Those who bought stock early in a market rally will start to worry when the price to earnings ratio of their stock rises too high to be supportable. One quarterly report with flat profits in key industries will commonly spook many investors who will rush to the exits, selling stock as they go. Likewise smart investors will simply take a little profit as the market heats up. In either case the selling pressure on the market drives prices down.

The trader or investor who uses Japanese Candlestick analysis will commonly see this coming and be able to sell stock or sell short just before a market reversal. Likewise, when the stock market correction happens the savvy trader reading Candlestick patterns can see when a correction has run its course and will often be able to buy stock to reverse short selling or even buy more stock as the market heads upwards again.

When the stock market moves up or down dramatically it is critical to have technical analysis tools such as Candlestick charting techniques on your side. The psychology of trading and the psychology of investing are such that it is easy to become fearful or to become greedy when what the person needs to do is thoughtfully analyze the stock market signals in order to profitably buy or sell stock, engage in buying calls or buying puts, or simply sit tight while the panic subsides. Seeing a stock market correction for what it is will allow the investor who was caught by surprise to ride out the storm and regain his or her stock value in a short time. Seeing a stock market correction coming will allow the same investor to buy puts on the same stock. When the price corrects the investor will execute the options contract and get the strike price for the stock. Afterwards he or she can repurchase the same stock at the now lower price spot price and resume a comfortable ride in the resuming bull market.


Market Direction

How do you tell if a trend is merely correcting or had a full-scale reversal? This is the question many investors find debilitating as far as taking profits.  Not knowing how to recognize a profit-taking pullback versus a full-scale reversal makes it difficult for most investors to close out a long position. This leads to one of the most prominent fears most investors encounter. “Do I take profits here or hold on in case the price turns around and heads higher?”

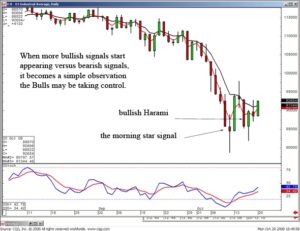
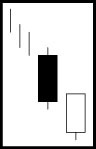
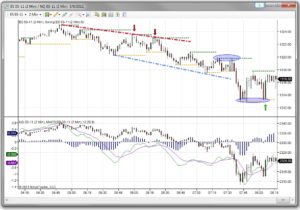
This problem is dramatically diminished if one can identify what the general market trend is doing. As seen in the Dow chart, there were signs that indicated a high probability that profit-taking would be occurring. After the strong bullish candle moved the Dow away from the T-line, while the stochastics were indicating overbought conditions, the appearance of candlestick sell signals produced a high probability scenario that it was time to take profits. However, many investors fear that if they took profits at that level, they would have been fooled out of good positions. This fear stems from the fact that up until not too many years ago, most investors had no indicators they could study to show when it was time to be in or out of positions. Most of the time, closing a position had more to do with a stockbroker recommending it was time to take profits or in other words, it was time to produce some commissions.

DOW Nov. 18

DOW

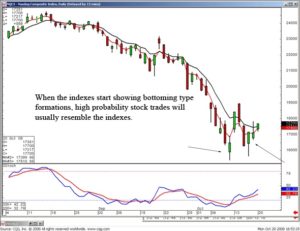
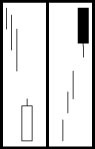
With the whole array of investment indicators at our fingertips, an investor can make much better assessments as to whether merely profit-taking is occurring or the sellers are trying to bail out of the market. Note how the Dow pulled back with indecisive candle formations. This illustrated there was no ‘convincing’ strength to get out of the market. Price patterns also become an advantageous tool. Knowing what should result from the development of a price pattern allows an investor to make a much better decision for when to get back into a trade.

Additionally, there are a number of subtle indicators that tell an investor what the general investor sentiment is during specific market conditions. Witnessing a good number of stocks continuing to trade positive in spite of the market moving down provides important information. Buyers are not vacating the market in a panic. When a good percentage of stocks are continuing higher as the market in general is heading lower, it can be assumed the selling has not turned into a mad rush.

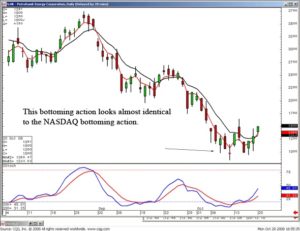
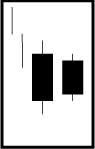
When up trends are not producing exuberant buying assessments from the so-called professionals, this also diminishes the panic factor when the market moves south for a few days. An uptrend can produce visual evidence with a strong up moves but mild pullbacks. As seen in the ATW chart, the uptrend maintains good strength when there is profit-taking along the way. This can be seen with much more clarity when using candlestick charts.

ATW

ATW

Learn how to use the information built into candlestick charts and you will be able to assess price movement with the same expertise as professionals who have been doing it for years. There is an immense amount of information built into candlestick charts. When you utilize that information for establishing trade positions, you put the probabilities are greatly in your favor.

Chat session tonight at 8 PM

Good Investing,

The Candlestick Forum Team

Stock Price Volatility

Stock price volatility is an indicator that is most often used by options traders to find changes in trends in the market place. There are two main types of stock volatility including historical volatility and implied volatility that are used in the options markets. The increase or decrease in volatility results from changes in investors emotions in the market place. More specifically greed and fear in the market place are the two main factors that cause stock prices to change. Stock price volatility tends to rise when there is new information released in the markets however the extent to which it rises is determined by the relevance of that new information as well as to the degree in which the news surprises investors. In today’s article we will discuss both types of volatility and how each type is used. 

Historical volatility, often referred to as actual volatility and realized volatility, is the measure of a stock’s price movement based on historical prices (stock price history). and it is used to measure how active a stock price typically is over time. It measures the fluctuations in the share price, and more specifically it is measured by taking the daily percentage price changes in a stock and calculating the average over a specific time frame. It makes sense that long term investing requires the use of longer time frames to calculate the historical stock price volatility (60-day to 360-day) while short term investing requires the use of shorter time frames (5-day to 30-day).

Implied volatility is the current volatility of a stock and is estimated by its option price. In other words, the implied stock price volatility is that level of volatility that will calculate a fair value that is equal to the current trading option price. When looking at an option to determine its implied volatility, there are five parts to take into account. These include the strike price, the expiration date, the current stock price and the stock dividends paid by the stock. Investors will then use an options pricing model, using these parts, to find the implied volatility. This calculation is often used to find an option’s value in the market. When options trading, investors will use this calculation when setting up combination strategies. These investment strategies are used to find expensive or cheaper options. It is important to note however, that each option on a stock can and will most likely have a different implied volatility because there different strike prices and expiration dates.

The stock price volatility can also be useful for non-options trading as well. Traders must be very careful when doing this and should combine volatility with other technical indicators. Implied volatility tends to be a leading indicator of stock direction. For instance, when a stock falls and the implied volatility doesn’t change, the market doesn’t really worry about it. Conversely, if the implied volatility rises, then the market is nervous about the stock’s downside potential.

There is a lot more to the stock price volatility that every investor should know and understand, especially those investors interested in online options trading. The importance of understanding the fundamentals to trading and investing in stock cannot be stressed enough.


Market Direction

When the markets become extremely volatile, that usually prelude’s a change of investor sentiment. As we have witnessed in the Dow over the past few weeks, the daily trading range has expanded to 400 to 800 points a day. These excessive swings in daily trading illustrate the indecision that is going on between the bulls and the bears. This becomes vital information for investors. After the strong bearish move following the Dumpling Top pattern, the next question becomes whether the consolidation that has occurred, over the past week and a half, was ready to form a bearish J-hook pattern or a bullish double bottom. Until that can be answered, the risk factor of being exposed to the market was too great. Consider your own emotions during the past few weeks. When the market is down 777 points, it is very difficult to find any reasons to be bullish. More than likely, the fear of what might be going on in our economy was probably enhanced. The major benefit of candlestick analysis is the visual depiction of what direction investor sentiment is likely to move. Today’s bullish trading; bringing both the Dow and the NASDAQ up through the T-line provided more evidence to the bullish side. Until today is trading, it could not be clearly evaluated whether the T. line was acting as resistance or not.

DOW, Oct. 20

DOW

Price volatility becomes a valuable input when utilizing candlestick signals. As seen in the Dow, the reasonal bottoming action has revealed more bullish candlestick signals than bearish candlestick signals. Add that information to the fact that stochastics were slowly moving up, today’s strong close provides more evidence that the Bulls appear to be taking control. The next confirmation would be a close above the 9450 area, a reasonable resistance area. The longer prices appeared to stabilize, the more likely the markets ‘fear’ will dissipate.

NASDAQ,, Oct. 20

NASDAQ

When the indexes are showing bottoming signals, our scanning procedures will likely find individual stock charts with the same patterns. As can be seen in the NASDAQ chart, it is forming a stutter step bottom. It is not difficult to find numerous individual stock charts with the same pattern set up. As often discussed in our evening chat sessions, it is much better to find stocks that are moving in the same direction as the market in general. Why go against the current? The probabilities of being in a correct trade are increasingly improved when the market and the sector are all producing the same bullish patterns. Candlestick analysis is merely the implementation of common sense investment procedures put into a graphic depiction. It allows an investor to put all the probabilities in their favor.

HK Bottoming Action

HK

Do you want to have a much better understanding on which way the market is moving? Do you want to be able to find the best probability individual stock trades in those market conditions? If you are not a member of the Candlestick Forum, you are missing out on the immense amount of information that is provided by candlestick signals. Our daily chat room involves constant analysis of what signals and price movements are revealing. The best method for learning a trading program successfully is to have a community of investors that are all assessing the same information at the same time. When you back up the live information with over 500 pages of Candlestick Forum information, you get a much better grasp of how the successful investor looks at the market. Take advantage of the membership special this week. This is the time to be learning how to understand what the market movements are telling you. You will not be disappointed with the amount of insights you gain from working with other candlestick investors. Join us today. The information you gain from candlestick analysis will benefit your investing for the rest of your life.

Chat session tonight at 8 PM ET for members only.

Good investing,
The Candlestick Forum Team


This Week’s Special
Free Video Download with Monthly Membership Purchase
Free video PLUS EXTRA Free Month with Annual Membership Purchase

Website special reflects current newsletter. If you are reading an archived newsletter you will be directed to Current Website Special.

Hot Stock Market Picks Are Better Identified When Using Candlesticks Signals

What is every investor looking for? Hot stock market picks!!! Everybody wants to find the stock that is going to make them wealthy. Hot stock market picks is the Golden Goose that all investors try to find. Is there a system for finding hot stock market picks? Not really, but one of the best investment tools for finding the hot stock market picks is candlestick signals. The signals do not necessarily identify  hot stock market picks, they simply put  investors into positions that have a high probability of producing big-profit moves.

Candlestick signals identify where money is flowing into and out of stocks/sectors. Being able to identify and understand the investor psychology that creates the candlestick signals produces a huge advantage. It allows an investor to participate in stock investments that have an extremely high probability of moving in the right direction. The signals are created by common sense investment practices. Trying to identify  hot stock market picks is a long shot. However, utilizing candlestick signals dramatically increases the probabilities of being in a strong price move. The signals have been developed through hundreds of years of visual analysis. When investor sentiment starts turning, the Japanese Rice traders identified the signals that illustrated the change.

The point of investing is to put investment funds into situations that have the highest probabilities of making money. Will there be failed trades? Of course, and the candlestick signals reveal when to get out of those trades very quickly. Will candlestick signals put investors into  hot stock market picks? The candlestick signals do not identify the hot stock market picks, they put investors funds into trading patterns that increase the probabilities of participating in big price moves when they occur. Utilizing the signals correctly will dramatically improve the probabilities of being in the right place at the right time. Use to your advantage. Learn the 12 major signals well and you’ll understand why prices move. Be aware of the secondary signals because they can also produce the evaluation of whether to get in or stay in positions.

Upside Gap Two Crows

Trading the Upside Gap Two Crows Pattern

Description

The Upside Gap Two Crows is a three-day pattern. The upside-gap is created between the long white candle at the top of an uptrend and the small black candle of the second day. The black candle gaps open and pulls back before the end of the day. Even though it has pulled back, it did not fill the gap. The third day opens above where the first black candle opened. It can not hold at these levels and pulls back before the end of the day. Closing lower than the previous day, it has engulfed the small black candle’s body. However, it still did not close the gap from the white candle.

Criteria

  1. A long white candle continues the uptrend.
  2. The real body of the next day is black while gapping up and not filling the gap.
  3. The third day opens higher than the second day’s open and closes below the second day’s close. This produces a black candle that completely engulfs the small black candle.
  4. The close of the third day is still above the close of the last white candle.

Pattern Psychology

After a strong uptrend has been in effect, the atmosphere is bullish. The price gaps open but cannot hold the gains. Before the end of the day, the bears step in and take the price back down. However, the gap up from the white candle was not filled. The next day, the bulls try again; they open the price higher than the open of the previous day. Again, they cannot hold the price up. It backs off and closes lower than the previous day. This now has taken all the steam out of the bulls. At this point, you will want to see the bears really stepping in the next day to confirm the reversal. (This pattern is not as bearish as the Two Crow Pattern)

The Hanging Man Signal

Learning how the stock market works for novices is a difficult process. The first  thing an investor should learn is the basics of why prices move.  Unfortunately, the new investor can be overwhelmed with stock trading advice.  Most of that advice does not teach an investor how to  utilize human emotions.  The candlestick signals, especially the 12 major signals, involve the visual elements produced by human emotions.  Being able to correctly analyze what these emotions are doing at specific points of a trend becomes a valuable tool for successful investing Learning how the stock market works for novices is an endeavor that most investors never master.  Learning how the stock market works for novices involves controlling one’s emotions.  Candlestick signals are a great benefit for the beginning investor as well as the experienced trader.  The information conveyed in the major candlestick signals is the visual depiction of investor sentiment.  Most investors sentiment unfortunately involves the extremes of human emotions, fear and greed. Learning how the stock market works for novices is an educational process.

The information incorporated into a major candlestick signal provides a huge advantage for those investors just learning how to play the stock market. Learning how the stock market works for novices should be made is simple as possible.  The results of simple visual analysis permits an investor to take advantage of high probability situations.  The major signals are created by the aspects of human emotions being put into trading decisions.  Investor psychology produces reoccurring thought processes as investors go through different stresses of a price trend.  The 12 major signals are a very important tool when learning how to play the stock market.  Understanding the investment psychology that creates each signal is an important element for understanding how professional investors think. One of the most important facets for learning how a stock market works for novices is knowing how to put the probabilities in your favor.  The candlestick signals create a format that does just that.  Hundreds of years of observations have resulted in reversal signals that are easy to identify.  When learning how the stock market works for novices, it is very important to find indicators that have a high probability of producing profits and a low probability of producing losses. This may be stating the obvious.  However, the utilization of candlestick signals is being done by a very small percentage of the investment population.  Use the major signals to start profiting from your investment decisions immediately.

The Hanging Man  produces some very important attributes when analyzing a potential reversal.  It is considered one of the 12 major signals.  Learn how to use a Hanging Man signal correctly. The probabilities of being in a correct trade when utilizing this signal becomes extremely high.

Hanging Man Candlestick Pattern

HANGING MAN

Description

The Hanging  Man  is also comprised of one candle. It is easily identified by the presence of a small body with a shadow at least two times greater than the body. It is found at the top of an up trend.  The Japanese named this pattern because it looks like a head with the feet dangling down.

Criteria

  1. The upper shadow should be at least two times the length of the body.
  2. The real body is at the upper end of the trading range. The color of the body is not important although a black body should have slightly more bearish implications.
  3. There should be no upper shadow or a very small upper shadow.
  4. The following day needs to confirm the Hanging Man signal with a black candle or   better yet, a gap down with a lower close.

Signal Enhancements

  1. The longer the lower shadow, the higher the potential of a reversal occurring.
  2. A gap up from the previous days close sets up for a stronger reversal move provided the day after the Hanging Man signal trades lower.
  3. Large volume on the signal day increases the chances that a blowoff day has occurred although it is not a necessity.

Pattern Psychology

After a strong up-trend has been in effect, the atmosphere is bullish. The price opens higher but starts to move lower. The bears take control. But before the end of the day, the bulls step in and take the price back up to the higher end of the trading range, creating a small body for the day. This could indicate that the bulls still have control if analyzing a Western bar chart. However, the long lower shadow represents that sellers had started stepping in at these levels. Even though the bulls may have been able to keep the price positive by the end of the day, the evidence of the selling was apparent. A lower open or a black candle the next day reinforces the fact that selling is going on.

When identifying the Hanging Man signal under the correct conditions, with stochastics in the overbought conditions, at the top of an uptrend, provides the information needed for identifying the possibility of a trend reversal.  When learning to play the stock market, being able to put all the probabilities in ones favor is very important.  When will an uptrend reverse?  When indications start appearing that demonstrate that the sellers are starting to take control!  The Hanging Man signal provides the elements that indicate the sellers stepping into a trend. Use this information to your advantage.

The educational process for learning to invest correctly is greatly enhanced when utilizing candlestick charts.  The information conveyed in candlestick signals is easily analyzed through candlestick formations.  Learning how to invest in the stock market becomes much easier when it can be visually analyzed. The candlestick patterns portray high probability investment situations. The candlestick investor gains huge advantages by seeing what investor sentiment is doing right now.

Training Tutorials

The Major Signals Educational Package  has over 8 Hours of training for trading Candlestick Signals or The Hanging Man individual training video available for Quick Download.

Candlestick Forum Flash Cards   These unique Flash Cards will allow you to be “trading like the Pro’s” in no time.

Return to Candlestick Explanation of the Major Signals

Currency Trading Made Easy With Candlestick Signals

Currency trading has recently gotten a new spurt of popularity with the advent of Forex trading. Currency trading has a much different dynamic than stock market trading. The major advantage of currency trading is that once a long-term trend takes hold, the trend will move in the same direction for long periods of time, for weeks and months. Candlestick signals work very effectively in currency trading. The same  investor sentiment found in stock trading is also found in the candlestick signals when analyzing currency trading.

Being able to analyze the direction of a currency dramatically improves Forex trading results. Forex trading can be broken down into very simple analytical features. The candlestick signals easily identify the direction of a specific currency trend. Due to the simple nature of candlestick analysis, being a completely visual process, the evaluation of the different currencies can easily be applied to a Forex trade. Currency trading is nothing more than exploiting the information that the candlestick signals reveal. If the dollar is moving up, and the British pound is trading down as can be identified with the candlestick signals, the Forex trade set up is very simple.

Use the information that is provided by the candlestick signals. Currency trading is a very simple process once understanding what the Japanese Rice traders projected for investor sentiment. This same  investor sentiment works on all trading entities. Understanding and identifying candlestick reversal or continuation signals helps pinpoint the optimal times to buy and sell. Understanding the investor sentiment that creates the candlestick formations allows an investor to project the direction of specific currencies against each other.

Join us each week in our live internet stock chat as we continue our free training on Trading with Japanese Candlesticks. This week’s article introduces the “In Neck Line” a Bearish Continuation Pattern.

In Neck Line
IN NECK LINE
(iri kubi)

Description

The In Neck pattern is almost a Meeting Line pattern. I t has the same description as the On Neck pattern except that it closes at or slightly above the previous day’s close. Confirmation is suggested. The In Neck Line indicates some short covering, but not a change in trend direction.
 
Criteria

  1. A long black candle forms in a downtrend
  2. The next day gaps down from the previous day’s close; however, the body is usually smaller than one seen in the Meeting Line pattern.
  3. The second day closes at the close or just slightly above the close of the previous day.

Pattern Psychology

This is the same scenario as the On Neck pattern. After a market has been moving in a downward direction, a long black candles enhances the downtrend. The next day opens lower, a small gap down, but the trend is halted by a move back up to the previous day’s low. The buyers in this up move should be uncomfortable that there was not more strength in the up move. The sellers step back in the next day to continue the downtrend.

Back to Continuation Patterns

Candlestick Forum Flash Cards   These unique Flash Cards will allow you to be “trading like the Pro’s” in no time.

Stock Market Investing Guide Should Incorporate Candlestick Signals

What is the best stock market investing guide? An investment method that has common sense investor intelligence built in. This is exactly what the candlestick signals provide. Most investors do not have a stock market investing guide. They will try anything that promotes high profit results. They move from one technique to the next not ever finding an investing technique that works. What should be used as a stock market investing guide? A technique that is proven. A technique that can be easily learned.

A technique that once you have learned it, can be applied to any trading market or any market conditions.
Candlestick signals are the cumulative knowledge of everybody that is buying and selling a trading entity in a specific time frame. The Japanese Rice traders not only identified the change of investor sentiment in a trend, being able to pinpoint the reversals of a trend, they also learned what the investor sentiment was doing to create that reversal. This information becomes very powerful for the investor. If an investor has a stock market investing guide that not only illustrates when to buy and when to sell, but also educates the investor as to why they are buying and selling, this provides the knowledge to successfully trade any market.

Learn how to use candlestick signals correctly. Having the ability to understand why the signals work creates the investment knowledge to give an investor full utilization of their investment abilities. The major signals have powerful implications. The secondary signals also provide valuable information. Using the signals as a stock market investing guide will provide a comprehensive investment format. An investor can apply candlestick signals as the basis for any other trading technique. Learning the candlestick signals allows the investor to gain insights into market trends that are not available with any other trading techniques.

This week’s signal – Trading the Belt Hold Pattern – Reversal Signal

Belt Hold Candlestick Pattern

BELT HOLD

The Belt Hold  lines are formed by single candlesticks. The Bullish Belt Hold is a long white candle that has gapped down in a downtrend. From it’s opening point, it moved higher for the rest of the day. This is called a White Opening Shaven Bottom or White Opening Maruboza. The bearish Belt Hold is just the opposite. It is formed with a severe gap away from the existing uptrend. It opens at it’s high and immediately backs off for the rest of the day. It is known as a Black Opening Shaven head or Black Opening Maruboza. Yorikiri, a sumo wrestling term, means pushing your opponent out of the ring while holding onto his belt. The longer the body of the Belt Hold, the more significant the reversal.
 
Criteria

  1. The  candlestick body should be the opposite color of  the prevailing trend.
  2. It significantly gaps open, continuing the trend.
  3. The real body of the candlestick has no shadow at the open end. The open is the high or low of that trend.
  4. The length of the body should be a long body. The greater the length, the more significant the reversal signal.

Signal Enhancements

  1. The longer the body, the more significant the reversal pattern.

Pattern Psychology

After a strong trend has been in effect, the trend is further promoted by a gap open, usually a large gap. The opening price becomes the point where the price immediately moves back in the direction of the previous close. This makes the opening price the high or the low for the trend. This causes concern. Investors start to cover shorts or selling outright. This starts to accentuate the move, thus reversing the existing trend.

Candlestick Forum Flash Cards   These unique Flash Cards will allow you to be “trading like the Pro’s” in no time.

Return to Candlestick Explanation of the Major Signals

Commodity Supply and Demand

Fundamental analysis in commodity trading has to do with anticipating commodity supply and demand. Successful traders who sell commodity futures and those who buy commodity futures learn and follow the various aspects of commodity production. Gold futures are affected by the fact that gold mining companies are digging deeper for gold in developed countries and exploring in politically unstable regions of the world. Corn futures are affected by drought, flooding, and the worldwide acreage planted. Oil futures are affected by disasters such as the BP oil spill in the Gulf of Mexico. Commodity supply and demand is the basis of commodity price. Anticipated commodity supply and demand is the basis of commodity futures price. Commodity demand rises for industrial metals like copper and energy commodities such as natural gas during an economic recovery. Thus commodity supply and demand together determine commodity price. To understand how commodity supply and demand, as well as market factors, determine commodity prices a new trader ought to consider Commodity and Futures Training. For the more advanced trader in commodity options a course such as Options Training with Stephen Bigelow can be very useful.

Traders in commodities buy futures and sell futures. Buying putsbuying callsselling puts, and selling calls on commodity futures is also done and can be profitable as well. Trading supply and demand has to do with fundamentals of the individual stocks, options marketscommodities, and futures of the equity market that one is trading. Technical trading has to do with anticipating the actions of others in the market. Unlike trading other equities basic supply in the case of commodities really has to do with just how much of the commodity there is for sale, not how much stock, for example, is available at a given price. Demand for agricultural commodities has to do with how many hungry people there are and how much they can pay for rice, wheat corn, milk, eggs, and meat. Demand for energy commodities goes with a thriving economy as well as severe northern winters. It drops during a recession and when a northern hemisphere January is mild.

Successful options trading in commodity futures is just as strongly related to commodity supply and demand as is buying and selling commodity futures. Buying options gives the buyer the option but not the obligation to purchase or sell if commodity futures price movement is beneficial. Selling options on commodity futures entails the same set of risks as buying and selling stock options. It tends to be more profitable over the long run but can result in occasional substantial losses. In commodity options, just like stock options, it is the large investment houses and companies with deep pockets who typically engage in options trading of commodity futures. All trading in futures and options may ultimately depend upon supply and demand. However, the business of buying and selling at the optimal price is most commonly and most efficiently assisted by use of technical analysis tools such as Candlestick analysis. In the end, everyone knows the fundamentals and it is the ability to predict the sum total of what other traders will do that leads to profits.

Predicting Stock Market Trends

Why is it so difficult to predict stock market trends? Just look at two of the ‘indicators’ some investors use for predicting stock market trends.

Some people put their faith in the “January Barometer”. A theory that the movement of the S&P 500 during the month of January sets the stock market trends for the year. If the S&P 500 is up at the end of January compared to the beginning of the month, expect the stock market to rise during the rest of the year.

Another prediction of stock market trends is based upon the Super Bowl indicator. An ‘urban legend”; claiming that if the winning team is from the AFC there will be a down market and if the winning team is from the NFC expect an up market.

Now if this isn’t proof that stock market trends are based upon human behavior, I don’t know what is. Stock market trends are nothing more than the shifting of investor optimism. Since investor optimism is an expression of human emotion, it makes sense that we find clues in stock market trends by observing candlestick patterns.

Japanese Candlesticks is the best technical indicator for predicting stock market trends. The Candlestick Forum helps investors recognize stock market trends by explaining how human weakness creates conditions resulting in predictable patterns. Candlestick signals visually illustrate investor sentiment, as the Homing Pigeon reversal pattern below.

Homing Pigeon

HOMING PIGEON

Description

The Homing Pigeon is the same as the Harami, except for the color of the second day’s body. The pattern is composed of a two-candle formation in a down trending market. Both candles are the same color as the current trend. The first body of the pattern is a long body, the second body is smaller. The open and the close of the second day occurs inside the open and the close of the previous day. Its presence indicates that the trend is over.

Criteria

  1. The body of the first candle is black; the body of the second candle is black.
  2. The downtrend has been evident for a good period. A long black candle occurs at the end of the trend.
  3. The second day opens higher than the close of the previous day and closes lower than the open but above the closing price of the prior day.
  4. Unlike the Western Inside Day, just the body needs to remain in the previous day’s body; where as the Inside Day requires both the body and the shadows to remain inside the previous day’s body.
  5. For a reversal signal, further confirmation is required to indicate that the trend is moving up.

Signal Enhancements

The higher the second candle closes up on the first black candle, the more convincing that a reversal has occurred.

Pattern Psychology

After a strong downtrend has been in effect and after a long black candle, the bulls open the price higher than the previous close. The shorts get concerned and start covering. The price finishes lower for the day but not as low as the previous day. This is enough support to have the short sellers take notice that the trend has been violated. A strong day after that would convince everybody that the trend was reversing. Usually the volume is above the recent norm due to the unwinding of short positions.

 Candlestick Forum Flash Cards  

These unique Flash Cards will allow you to be “trading like the Pro’s” in no time.

Return to Candlestick Explanations

The Morning Star – A Powerful Candlestick Reversal Signal, Stocks & Commodities Magazine

The major Candlestick reversal signals are very illuminating. They are hundreds of years of visual observations revealing high probabilities of a reversal occurring. Not to overstate the obvious, but if Candlestick signals didn’t work, we would not be looking at them today. The Japanese rice traders that they used candlestick signals became enormously wealthy.

The major benefit of Candlestick signals is that they are very easy to learn and identify. You do not need to learn formulas. You do not have to do extensive fundamental analysis. A Japanese Candlestick reversal signal is a visual identification of a change in investor sentiment. Of the 50 or 60 Candlestick signals, there are 10 major signals that occur at the reversals the majority of the time.

The Morning Star signal is one of the most clear, symmetrical candlestick reversal patterns.
Morning Star
Morning Star

The Japanese rice traders described it as the planet Mercury, the morning star. It foretells that brighter things, sunrise, is about to occur, meaning that prices are going to go higher. It is formed after an obvious downtrend. The three day signal consists of a long black body, usually one produced of the fear induced at the bottom of a long decline. The following day gaps down. However, the magnitude of the trading range remains small for the day. This produces an indecision type – day. The third day is a white candle day. The white candle represents the fact that the bulls have now stepped in and seized control. The optimal Morning Star signal would have a gap before and after the star day. 

The make up of the star, an indecision formation, can consist of a number of candle formations, however a Doji or a spinning top is usually the predominant formation in a Morning Star signal. The important factor is to witness the confirmation of the bulls taking control the next day. That candle should consist of a closing more than half-way up the black candle of two days prior.

Identifying the Morning Star signal is relatively easy. It is visually apparent to the eye. There are some very simple parameters that can enhance the Morning Star signal’s probabilities of creating a reversal.

  1. The longer the black candle and the white candle, the more forceful the reversal. This demonstrates a more severe change in investor sentiment.
  2. The more indecision that the star day illustrates, the better probabilities that a reversal will occur, such as a Doji signal.
  3. A gap between the first day and the second day adds to the probability that a reversal is occurring. A gap before and after the star day is even more desirable.
  4. The higher the close of the third day, coming up past the middle point of the black candle of the first day, reveals more potential in the strength of the reversal.

The probability of a Morning Star signal reversing a trend becomes extremely high when found in oversold conditions. Using a simple indicator such as stochastics, in the 20 area or below, represents an oversold condition.The most important element of the signal is the magnitude of the white candle’s close during the third day.

Candlestick analysis can be used in all trading entities. Whether doing a long-term evaluation on a monthly Dow chart or a one minute chart trading the e-minis, the signals working just as effectively for revealing change in investor sentiment during that time frame. As seen in the daily Dow chart, the Morning Star signals revealed when the Dow established a bottom. Being able to analyze the direction of a DOW l increases the probabilities of being a correct trade when analyzing individual stock charts.

Ninja Trader Partners with Stephen Bigalow and Candlestick Forum

Ninjatrader

NinjaTrader is the preferred active trader platform for traders worldwide including our clients.  We are pleased to offer NinjaTrader to our clients for many reasons but one great reason is that you can get started with NinjaTrader for Free!  Why pay hundreds of dollars per month for products with less functionality when with NinjaTrader all you need is access to a real-time or historical data feed. 

You can also connect NinjaTrader to Kinetick, our preferred market data service, for free End-of-Day data!  Download NinjaTrader Now

NinjaTrader provides superior order entry options!
If you are using the wrong trading platform, order submission and trade management can be a timely and error prone process.  Since 2003, NinjaTrader has pioneered easy to use yet powerful order entry and trade management functionality to overcome the limitations of other trading platforms helping our clients better achieve their trading goals!

The innovative NinjaTrader SuperDOM and Chart Trader set the benchmark for order entry screens and is one reason we recommend it to our clients.   Considered the industry’s best order entry screens they provide traders with ease of operation, clear trade visualization and fast entry to capitalize on today’s markets. 

Dom

SuperDOM

Easy to see trade visualization
Single click order entry, modification  and cancellation
Can be use with Advanced Trade Management (ATM) module

Chart Trader

Chart Trader
Easy to see trade visualization on the chart
Single click order entry, modification and cancellation from the chart
Can be used with Advanced Trade Management (ATM) module

Chart Trader

NinjaTrader is the industry leader in trade management features!

Advanced Trade Management (ATM) is NinjaTrader’s signature order management technology that lets you pre-define personal trade management strategies including; multiple profit targets and stop loss orders, one-cancels-other (OCO) orders, auto-breakeven stops, trailing stops and much more.  This feature can significantly enhance trade performance by automatically submitting all entry/exit orders within milliseconds!  This feature alone tends to cover the cost of the platform while simultaneously lowering your stress level by eliminating the “deer in the headlights” feeling commonly associated with manually managing multiple exit orders in fast moving markets.

ATM entry box

Easily specify multi-stage exit parameters
Single check box to create an auto break even stop
Highly configurable and easy to use auto-trail stop

ATM Strategy

Utilize NinjaTrader’s comprehensive market analytics tools to help find trading opportunities!

Regardless of what markets you trade, what style of trader you are or if you require real time or end of day analytics, the NinjaTrader trading platform provides you the tools to analyze the markets and your trading ideas in a flexible, customizable and user-friendly manner that helps you trade better.

Charting

  • Powerful market visualization
  • Multi-time frame and multi-instrument analysis
  • Over 100 pre-built customizable indicators plus 100s of optional 3rd party indictors

Chart for Ninjatrader

Other Analysis Tools

  • Trade performance tool
  • Market Analyzer
  • Strategy analyzer

Automate and customize your trading!

Take your trading to the next level through custom development and trade automation!   NinjaTrader provides you with the ability to automate your trading strategies whether they were developed natively using NinjaScript® or in an external application such as TradeStation.

Automated and Custom Trading

  • Develop or purchase automated trading strategies
  • Analyze automated trading strategies
  •  Execute automated trading strategies
  • Process Trading signals from external applications
  • Create or purchase 3rd party custom charting indicators

Choice of Market Data Services and Broker Connectivity Options

NinjaTrader is a broker independent trading platform so you have choice on where you can execute your trades. NinjaTrader supports all leading independent market data service providers including Kinetick, our preferred market data service. Paper trade and do your analysis with real time data without having to pay a single penny for software!

NinjaTrader is committed to providing Education and Support

Our team is technically familiar with NinjaTrader and provides basic client assistance.  The NinjaTrader team however is deeply versed in all aspects of platform operation and can be easily accessed through email or their support forum.  Their dedicated team of twenty plus client support specialist are at the ready should you ever need platform assistance.  In addition, NinjaTrader provides daily educational webinars and a complete context sensitive online user’s manual interlaced with many product videos to minimize your platform learning curve.

Education and Support

  • Free daily NinjaTrader training webinars
  • Media rich help guide
  • Video library
  • Active user community

Download NinjaTrader Now