Traded Commodities

There is a lot of information for the beginning commodity trader to learn. Traded commodities include agricultural products, energy products, precious and industrial metals, and the newly created environmental commodities. A good way to approach commodity trading is to decide which traded commodities you want to deal in. Then it is wise to do Commodity and Futures Training. A commodity trading course will familiarize you with the commodities marketscommodity trading charts, and the application of Candlestick chart analysis to modern traded commodities.
Trading commodities in agriculture includes both crops and livestock.

Crop commodities are also referred to as grains, food, and fiber. Commonly traded commodities are cocoa, coffee, corn, cotton, oats, rapeseed, rice, soybeans, soybean oil and meal, sugar, and wheat. As an example, corn is traded in 5,000 bushel lots and soybean oil in lots of 60,000 pounds. Livestock and meat commodities include feeder cattle and live cattle as well as frozen pork bellies and lean hogs. Lean hogs trade in 20 ton lots. Agricultural commodities are subject to fundamental analysis as well as technical analysis. Technical analysis charts for trading agricultural commodities go all the way back to rice trading in Japan in the days of the Samurai. Although the modern commodity investing includes much more than rice, the centuries old principles of Candlestick chart formations and Candle chart patterns apply as well to corn futures and pork bellies today as they have to rice trading for centuries.

Energy commodities include crude oil, gasoline, ethanol, heating oil, natural gas, and propane. Commodity and Futures Training will help you understand the principles of trading commodities online with energy commodities. It will show you how commodity trading info optimized with Candlestick signals can optimize your profits in trading. Training will also help you pick effective commodity trading software and understand its use.

Precious metals traded as commodities include gold, silver, platinum, and palladium. These are traded as bullion. Although each of these metals has industrial use, only silver has substantial use in industry. Commodity investing in precious metals has become widely popular in recent years as the economy has faltered. With very heavy trading it is typical that technical analysis with Candlesticks will outweigh fundamental factors in the price swings of precious metals. With trading as heavy as it currently is the trader will be wise to stick very close to Candlestick basics in trading commodities such as gold.

Industrial metals as traded commodities include aluminum, copper, nickel, lead, recycled steel, tin, and zinc. Commodity prices in industrial metals closely follow the economy. These metals trade in metric tons. Environmental commodities are a totally different breed. Carbon offsets, energy efficiency credits, known as white certificates and renewable energy certificates are new creations meant to help protect the environment. As an example of environmental commodities, carbon offsets trade in metric tons of carbon dioxide equivalent from a mixture of green house gases. One offset credit is intended to represent the reduction of one metric ton of carbon dioxide emission. Companies that successfully reduce their emissions gain these credits and can sell them to companies that have yet to reduce emissions. Although industrial metals and greenhouse gas emissions are very different they both can be traded effectively using Candlestick trading tactics. To learn more about traded commodities and about how to trade them seriously consider Commodity and Futures Training.


Market Direction

What are the candlestick signals revealing about this market trend? The market is in an overbought condition but the market is healthy. Although this may sound like a contradictory analysis, the information provided in the charts allows an investor to make a refined analysis. Statistically, the Japanese Rice traders have discovered that a trend that has moved with eight or more positive closes is due for a correction. The last time the S&P 500 had more than 10 positive closes in a row was back in 1995. It has only done this a handful of times in the markets history. Expect some profit-taking, because everybody is expecting some profit-taking. However, although the market is overbought, there has been good profit-taking on an intraday basis. This makes for a longer, more solid trend. There is not any significant exuberance occurring when it can be seen that profit-taking is occurring on a consistent basis.
Today’s trading revealed Hanging Man signals in all of the indexes. This obviously makes for market conditions to potentially show a reversal. Witnessing negative premarket futures would warrant closing out long positions that were demonstrating some weakness.

Traded Commodities, Dow
DOW

Traded Commodities, NASDAQ
NASDAQ

A major advantage for the candlestick investor is having the ability to identify both long and short potentials. The trading strategy becomes relatively simple during these market conditions. Long positions should be kept in place provided they are not showing confirmed sell signals. Confirmation requires a candlestick sell signal and a close below the T-line.

As long positions are closed out, the risk factor of rolling that money into additional long positions is relatively high. This is where the identification of strong short situations helps modify a portfolio exposure.
Simple scanning techniques reveal where strong selling is occurring. Adding a few short positions to the portfolio, even though a major cell signal has not occurred in the market indexes, acts as a good hedge. A good hedge is one that can produce profits even if market conditions don’t yet show the overall investor sentiment having change direction. As seen in our short recommendation on the BG chart, shorting the stock has high probabilities of produce a profit whether the market is going up or down. It provided an easy entry strategy today and still provides an easy entry strategy for tomorrow.

Traded Commodities, BG

BG

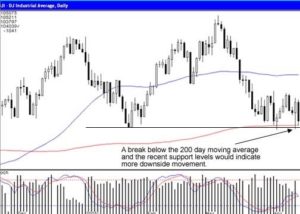
Each of the major signals have very simple rules that make them effective. One of the rules for a Doji is that a trend will move in the direction of how they open the price after a Doji. Add that to the recent analysis of this chart, a dark cloud signal ending the uptrend at the 200 day moving average, followed by a bearish engulfing signal on Friday made for very simple trade. If it opened lower today, it could be shorted. Today’s Doji also makes for an easy trade. If it opens lower tomorrow, it can be shorted immediately. Stochastics indicate more downside following the candlestick sell signals.

These same simple rules can be applied to very profitable commodity trading. Witnessing a sell signal as prices have moved a good distance away from the T-line make for a high probability short sale. As seen in our recent recommendation for shorting lean hogs, shorting after a Doji made the prospect of a test of the T-line very likely. A failure at the T-line would make the possibility of a downtrend continuing to the 50 day moving average or possibly lower. This is not rocket science analysis. This is merely utilizing the signals and confirming indicators that have produced consistent profits in the past.
Traded Commodities, Live Hogs
Lean Hogs April

Chat session tonight at 8 PM ET.

Good Investing,
The Candlestick Forum Team


This Week’s Specials

Candlestick Signals Educational Package

Click here for details

Website special reflects current newsletter. If you are reading an archived newsletter you will be directed to the Current Website Special.

Commodity Price Patterns

Although commodity prices may or may not repeat themselves commodity price patterns do. In fact, it is because history repeats itself that technical analysis tools work to predict the next move in a commodity price.

Certainly commodities traders have long had an intuitive sense about the commodities markets. However, it was not until Japanese rice traders developed Candlestick charting techniques in the days of the Samurai more than three centuries ago that there was an organized and teachable system for commodity trading. Today a beginning commodity trader can take commodity and futures training to learn about Candlestick trading tactics as well as modern technical analysis terms for the same Candlestick pattern formations that guided traders centuries ago.

The basic price of a commodity comes from the law of supply and demand. Inflation will make commodity prices higher in dollars even when a commodity such as gold will still buy the same amount of food or a house for the same weight that it did a century ago. Predicting changes in the basic price of a commodity is a matter of fundamental analysis. Following commodity price patterns is a matter of technical commodity analysis.

Commodities are prone to cyclical price changes. Copper futures, for example, will go down in price during an economic recession and up when traders see a recovery on the way. Corn futures may vary throughout the year as concerns about the next harvest prompt hedging by growers and buyers. These commodity price patterns are longer term, typically yearly. Commodity price patterns that emerge from the actions of thousands of traders develop over months, weeks, days, and even hours or minutes.

Trend trading of commodities is possible when the market comes to believe that the future price of a commodity and its commodity futures price will gradually go up or down. Traders will profit from buy and selling or short selling and buying commodity futures when successfully trading a trend. Doing this successfully requires that the trader follow the market and market news attentively, studies commodity price patterns, and compares current price patterns to technical analysis charts, whether they are of the modern variety or modern versions of Candlestick charts.

Just as the use of technical analysis to verify that a trend is likely to continue the trader will use technical methods to anticipate a market reversal. Although it is the basics of commodity production and the market for the commodity that ultimately decides price it is the combined actions of many traders that generate commodity price patterns. Being able to “see the forest for the trees” is an old expression for recognizing trends or the big picture. This is what Candlestick basics have done for centuries. Long before today’s statistical analysis methods were even dreamed of traders dutifully recorded commodity prices and came to recognize patterns that predicted the market’s next move. The old saying that using Candlesticks allows the trader to let the market tell him what the market will do is as true today as it was in the days of the Samurai.


Market Direction

A bounce or a reversal? How would you tell the difference? If you add all the indicators together, you get a much more clear picture of what is occurring in investor sentiment. Friday saw a bullish trading day. The Dow was up 130 points. This is not an insignificant bullish move. However, there are indicators that would confirm whether a reversal have occurred for a bounce had occurred. There were a number of indications that led to anticipating this was just a bounce in a downtrend. Although the NASDAQ formed a Piercing Signal right on the 200 day moving average, the Dow did not form a true signal. It was not a Bullish Harami because it opened lower than Thursday’s close. That might be splitting hairs, but there were other indications the markets had not reached bottom yet.

The stochastics are still heading in a downward direction. The bullish trading on Friday did not put a wrinkle in their trajectory. The NASDAQ had experienced some gap downs over the past few days in its formation of a bearish J-hook pattern. When we understand the significance of a gap down in price, it makes the trend analysis easier to evaluate. It would be very unusual to have the sellers gapping prices down, indicating a strong selling force, and then the markets reverse well before the stochastics indicate an oversold condition. The lack of strength in today’s follow-through revealed the Bulls had not yet taken over control of the trend. Continue to hold short positions and short funds until a strong reversal signal appears in the appropriate areas of the trend.

Commodity Price Patterns, NASDAQ
NASDAQ

Being able to analyze market trends provide important information when trading commodities. The weakness in the cattle market is due to the anticipation that if there is problems in the world economies, the higher cost meats are going to be less attractive to consumers. Note the rounding top, the Dumpling top formation in the feeder cattle chart. It can be seen that when there was bullish movements in the stock market Friday, the downtrend in price of Feeder Cattle became indecisive. Once the bearish trading came back into the equity markets, cattle prices sold off again.

Commodity Price Patterns, FC
FC

This weekend the Candlestick Forum presented a two day training on how to analyze and correctly position oneself in commodity trading. Candlestick signals and patterns work extremely well when trading commodities. The Japanese Rice traders made fortunes trading the most basic of all commodities, rice! Trading commodities has advantages. The perception that commodities are very risky becomes greatly diminished when applying candlestick signals to the trading program. There will be more commodity picks available in the members area. This may not be a daily occurrence due to the limited number of commodities. There are very simple procedures for establishing commodity trades that have a high probability of moving in the correct direction immediately. This greatly relieves the emotional anxiety of being in a commodity position.

Chat session tonight at 8 PM ET

Good Investing,
The Candlestick Forum Team


Current Website Specials

July 2010

2-Day- Training Webinars 

Candlestick Technical Analysis Webinar – July 10 & 11

 Options Training Webinar – July 31st & August 1st

Click here for details

Website special reflects current newsletter. If you are reading an archived newsletter you will be directed to Current Website Special.

Stock Investing System – Do You Have One In Place?

It sounds logical enough; an investor needs a good stock investing system. But then comes the obvious questions; what is a stock investing system and how do I establish a good one? First, a stock investing system is a system for evaluating stocks, identifying risk and profit objectives, and planning a long term investing strategy. Secondly, a good stock investing system will also include a stock trading system such as Japanese Candlesticks. While it is important to realize that even the best stock market investing strategy isn’t perfect, successful traders maintain that the discipline to follow their plan contributed to their success more than their trading philosophy. They know that the proof of a good plan is tested over time.

Adding to the success of a stock investing system are the stock market trading tools, specifically the tools used for stock technical analysis. When coupled with a system such as candlestick chart analysis, an investor can know that his or her trading plan contains the components necessary to establish a successful presence in the market. With all of this power available, an investor must still be able to recognize when they have made a mistake and recover successfully. A good stock investing system will include stop loss strategies so that an investor is prepared in the event that a particular investment goes bad. Preparing for exactly such a situation can be the difference between success in the market and complete failure.

Another valuable concept for the investor is portfolio diversification. A portfolio that has a broad variety of commodities, varying levels of risk, and diverse profit potential can be an excellent way to insulate an investment. This way, it is possible to speculate on a stock and use the rest of the portfolio as a hedge against a devastating loss. Such a practice is valuable in any stock market trading system.

How does the investor figure into a stock investing system? The investor is the centerpiece of every successful, or unsuccessful, trading plan! The market is a psychological adventure, with euphoria, boredom, joy, pain, greed and fear all attempting to alter the stock investing system of the investor. A wise trader is able to withstand the emotions of the market and stick to the stock trading plan. Avoiding investing in unknown markets and resisting the temptation to invest out of boredom are factors in avoiding potential problems.

While the market has many pitfalls, a good stock investing system can assist any investor who wishes to realize a profit trading in the market. When beginning investing in the stock market, it is immensely important to develop a plan to trade stocks, acquire the necessary stock market trading tools to create an edge, and learn from those who have gone through it all before. While the market is unpredictable, the principles and techniques needed to be successful are time tested and reliable. As with any event in life, a good stock investing system and the lessons learned by others will provide the best investment advice an investor can ever receive.

How To Invest In Stocks

When you are learning to invest in the stock market, you soon find out that the stock market can supply you with a lot of stocks every day. Many of them profess to be stock market movers, hot stocks related to new technology from the health care, homeland defense, nanotech, biotech, voip, or internet sectors.

Most of them seem attractive, but the truth is that quite a few of these investing and trading opportunities might not be as profitable as you think. That’s why it’s important to learn how to invest in stocks the right way, especially if you plan to invest in them on a daily or weekly basis.

When you learn how to trade stocks the right way using the basics of stock market investing, you will hopefully be able to consistently pull money out of the markets in a short period of time.

You don’t necessarily have to trade hot momentum stocks all the time. However, you can learn how to take advantage of them when you encounter the best opportunities for going long or for shorting them to make money when they are poised to fall down.

The truth is, leaning when to invest in stocks is not as important as learning how to invest in stocks. And how you invest in stocks should take into consideration what goals you are setting for that investment. For instance, are you investing for capital appreciation or for income through dividend paying stocks? Are your investments in the stock market for the combination of both capital appreciation and dividend income? Are you investing through a Mutual fund(s) or selecting your own individual stocks? Are you employing solid stock investing concepts?

Do you invest with a lump-sum dollar amount or dollar-cost average into your stock or Mutual fund positions (buying the same stock or Mutual fund at different prices over the years)? Is your investment dollar spread too thin and are all of those dollars working for your ROI (return on investment)? Do you pay commission fees to purchase a stock? Who do you use to help with investing?

Do you pay load fees in your Mutual funds? How large an amount does your Mutual fund charge you for ‘hidden fees’ such as management, operating, and marketing fees?

Learning how to invest in stocks is more important than when you invest in stocks and how you invest will determine your ROI.

A good stock market investing strategy incorporates a comprehensive a how-to plan that takes into consideration all of the factors above. Remember, every penny of your investment dollar should benefit you and your loved ones and no one else.

Stock Market News – Do You Take Advantage Of This?

Following stock market news can be a great source of information for the successful trader. Whether gleaning facts or anticipating emotional responses by other investors, it is possible to garner a great deal of information from stock market newsletters and from both the print and network media outlets.

For example, the stock market news was buzzing on October 27, 2006 when the US Commerce Department announced that the economy was at its slowest pace in over three years, spurring speculation that the comfortable landing many had desired might not be found. Investors forced up the price of stocks in October, speculating that the economy was entering a slow period. The theory was that a gradual leveling wouldn’t affect corporate profits or consumer spending. A gradual slowdown is desirable to protect the economy from the threat of inflation and to encourage the Federal Reserve to lower short-term interest rates. Technical analysis of the stock market news led investors to believe that the report on the GDP (the broadest measure of the economy) would show slowing growth, but the report confirmed the belief that the sluggish housing market might affect other areas of the economy. The 1.6 percent growth rate was below the expected 2.1 percent forecast, fueled mainly by the lethargic housing market.

While the stock market news seemed to affect the greed and fear of the investors, some experts viewed the downturn as an indication of profit-taking and consolidation. The news of the stock market adjustment was the perfect opportunity for some traders to take a deep breath after the recent run and review their portfolio diversification. While trading was down for both the Dow Jones and NASDAQ stock exchanges, their totals were still up, further indicating a temporary adjustment and not a major downturn.

Such movements are valuable when learning about the stock market. For a beginner investing in the stock market, it is important to differentiate between technical facts and emotional trading. While stock technical analysis changes only if information on a particular company or its stock changes, emotional trading can be affected by a stock market report on the news. Even a skilled trader can be moved by such sensational news, so it is imperative that a beginner be wary. It is possible for a trader, using a stock trading plan and a stock trading system, to avoid being lured into reacting only to news about the stock market.

stock investing system is crucial because it prevents a trader from becoming emotionally invested in the stock market news. This system should include stop loss strategies and techniques which aid the trader in decision making when a stock is faltering. In addition, a stock trading system implements technical analysis, keeping the investor focused on the factual side of trading and not on which member of the stock market is making news.  Using a system such as Japanese Candlesticks, even a beginning investor can be certain that he, or she, is prepared to act analytically even when the stock market news is bad.

Futures Trading – Balancing Risk and Reward

There is a paradox in futures trading; “get-rich” trading usually leads to poverty. While it is true there are many people that do get rich in futures trading, the norm is to lose. Because most investors don’t do the things necessary to be successful, they find failure is the only other alternative. This is a practice that requires training, experience and plenty of technical analysis. But, then, doesn’t all successful investing?

The Risks of Futures Trading

First, let’s back things up a bit; while futures trading can be very risky, the rewards can be very nice as well. Richard Dennis, a famed commodities trader, was able to parlay $1,600 of borrowed money into $200 million over ten years. While his results are truly extraordinary not everyone can expect the level of successful trading he achieved, there is good news for every investor; you can make money in futures trading. Now that we have made this statement, we can talk about futures trading.

Futures trading has a bad reputation as being filled with risk and, while there is risk, the truth is that futures trading is only as risky as a trader makes it. This is not the lottery or a trip to the casino; if you take a conservative approach, look for a reasonable return and make this a business, then the probability of success in commodity trading is very good.

What is Futures Trading?

Futures trading is different that investing in the stock market or bonds since you don’t actually own anything; in futures trading, you are speculating on the future direction of the price in the commodity you are trading. This is like a bet on future price direction. The terms “buy” and “sell” merely indicate the direction you expect future prices will take. He or she must only deposit sufficient capital with a brokerage firm to insure that he will be able to pay the losses if his trades lose money.

Futures trading is a sort of insurance plan for those who are trading and investing. A farmer may sell futures on his wheat crop if he thinks the price will go down before the harvest; conversely, a bread manufacturer may buy futures if they think the price of wheat is going to rise before the harvest. Regardless of the price movement, both are guaranteed their price. The final component of the equation is the investor in futures trading who looks for changes in the futures markets and seeks to gain advantages by buying or selling at a profit.

What are Futures Markets?

In addition to agriculture, there are a number of different futures markets. Among these markets are:

  • Currency trading such as the US dollar, the British pound and the Japanese yen
  • Interest rate futures on financial transactions and bonds
  • Energy Futures on oil and gas
  • Food sector on items such as coffee, sugar and orange juice
  • Metals such as gold and silver

Each futures market has producers and consumers who need to hedge their risk from future price changes. The speculators, who do not actually deal in the physical commodities, are there to provide liquidity. This maintains an orderly market where price changes from one trade to the next are small.

Is Substantial Risk Inevitable in Futures Trading?

Minimizing risk in futures trading is easy; instead of taking delivery or making delivery, the speculator merely offsets his position at some time before the date set for future delivery. If price has moved in the right direction, he will profit. If not, he will lose. Greed and fear are the enemies of futures trading and the cause of most big losses.
Futures trading is not for everyone; it possesses risks that are limitless to an uninformed, undisciplined investor. With solid trading rules and an understanding of the markets and techniques required, futures trading can be a very rewarding endeavor.

Defensive Investing – A Game Plan For Success

In sports, the general strategy is that teams should play defensively because a good defense wins games. It is commonly believed that a defensive approach opens up offensive opportunities. Transposed to the stock market, Benjamin Graham, the “Dean of the Stock Market” wrote a book nearly seventy years ago on defensive investing that is still must-read material for investors. Defensive investing helps traders through not only the good times but also on days like Black Monday.

Black Monday occurred on October 19, 1987. In just a couple of weeks, the stock markets plummeted 30% including a 508 point drop on Black Monday. To understand its severity, on September 17, 2001, the market only experienced a 7% drop for the first post-9/11 day of trading. Both events were bad, but they hold valuable lessons for successful traders today.

A drastic fall like either of these can make even the most grounded investor consider jumping hastily to sell assets. Defensive investing requires that an investor understand his or her stock portfolio and search it for vulnerability. After that, fundamental analysis is key because understanding the stability of the market and your stocks makes you less exposed to such extreme stock volatility. Understanding defensive investing helps an investor to be prepared for bad times in the market.

Is that all you can expect from defensive investing? Absolutely not! Remember that in sports, a good defensive can open up offensive opportunities. Get ready for some offense here! Traders that do not follow their stock trading plans open themselves up to emotional reactions from greed and fear. When investors dump a company’s stock, the stock prices fall because of the sell-off. This creates incredible opportunities for others to purchase stocks well below their actual market value. When the slide ends and the market stabilizes, these defensive investors are in for very handsome returns on their investments.

Defensive investing also fits very well with a stock trading system like Japanese Candlesticks. Since the emphasis in defensive investing relies on long term investing, you need stocks that are more conservative and follow very dependable trends. Technical analysis with Candlesticks allows you to see exactly where your stocks have been and gives you a very good idea of the track in the immediately future. Such a system allows investors to move very confidently in both good times and in bad times.

Because Japanese Candlesticks is a powerful stock charting tool, it can help an investor find a subtle trend that indicates which way a stock will move. Used as part of an overall stock trading plan, Candlesticks can provide the type of analysis needed to find conservative stock trends and help traders to invest defensively.
One thing is sure about the stock market; nothing is sure. Everyday there are twists and turns that that can attempt to lead a trader away from his or her trading plan. A defensive investment plan will keep your investment secure and allow you to go on the offensive at just the right time. If used correctly, this investment philosophy will help you to “win” in the stock market.

Developing A Trading Plan

The key component to any successful trading is the existence of a good trading plan. For the beginner investing in the stock market, the obvious question is; what is a trading plan and how do I establish a good one? The definition of a trading plan would be a process for evaluating stocks, identifying risk and profit objectives, and planning a long term investing strategy. In addition, a good trading plan will also include defining a trading system such as Japanese Candlesticks. While realizing that even the best trading plan isn’t perfect, most successful traders maintain that the discipline to follow their plan contributed to their success more than their investment philosophy. They know that the proof of a good plan is its results.

Adding to the success of a trading plan are the trading tools, specifically technical analysis tools. When you join technical analysis with a system such as candlestick chart analysis, you can be assured that your trading plan contains the components necessary to establish profitability in the market.

With all of this power available, an investor must still be able to recognize when they have made investing mistakes and be able to recover. A good trading plan will include stop loss strategies and techniques allowing an investor to have a pre-prepared plan in the event that a particular investment goes bad. Preparing for just such a situation can be the difference between success in the market and complete failure.

Another important concept in a trading plan is portfolio diversification. A portfolio that has a broad variety of investment options, varying levels of risk, and diverse profit potential can be an excellent way to insulate an investment. This way, it’s possible to speculate on a stock and use the rest of the portfolio as a hedge against a devastating loss.

What part does the investor play in a trading plan? The investor is the centerpiece and most important part of every successful, or unsuccessful, trading plan! The market is as much a mental adventure as it is anything, with euphoria, boredom, joy, pain, greed and fear, all attempting to shake an investor away from following his or her trading plan. A trader that can withstand the emotions of the market and stick to the trading plan will have the best chance at success. As with most things in life, emotional reactions when investing almost always lead to bad decisions. Avoiding investing in unknown markets and resisting the temptation to begin investing in the stock market because of boredom or peer pressure are good lessons to learn in order to avoid potential problems.

It is true that investing definitely has its share of pitfalls and a good stock trading plan goes a long way to assisting any investor who wishes to enjoy profitable trading in the market. When beginning to invest in the stock market, it is critical to take the time to develop a trading plan, acquire the necessary tools to correctly evaluate companies and their financial situations, and to take advantage of learning from the people who have gone through it all before. While the market can be unpredictable, the principles and techniques needed to be successful have been used for years and have been shown to be quite reliable. A well thought-out plan and the lessons learned by others will provide the best investing advice and investor can ever receive.

Investing In The Stock Market With Candlestick Signals

Investing in the stock market requires having a trading program that has accountability. Most investors, when invested in the stock market, do not have any program. They buy stocks based on a multitude of investment input. The problem with this approach is that there is no program for when to get in and when to get out. Investing in the stock market requires a trading format that can be analyzed after both good and bad trades.

Most investors don’t have an exit strategy for a trade that does work and especially for a trade that does not work. The lack of that information makes investing in the stock market more hit or miss. Using the analysis of Candlestick signals allows an investor to quickly interpret what a price action or a trend is going to do. Once this analysis has been made, price movement that deviates from that analysis can be quickly analyzed viewing the Candlestick signals. The prime example occurred on Tuesday as the Dow came back down and tested the 200 day moving average. The bullish signal that formed late in the day in both the Dow and the NASDAQ would have prepared investors to start buying upon seeing confirming buying on Wednesday. Using candlestick charts make the analysis very easy.

However, the consolidation in the morning could have been expected after a big reversal day. The fact that the sellers came in and pushed the markets back down to the 200 day moving average at the end of the day creates a completely different scenario than if the Bulls had sustained the uptrend on Wednesday. The weakness in both the NASDAQ and the Dow require a new analysis.

With the NASDAQ trading near its recent lows and the Dow trading right near the 200 day moving average, and with the Dow once again forming a Bearish Engulfing signal makes for a different evaluation. Two weeks ago, a Bearish Engulfing signal in an oversold condition meant to look for a buy signal. The Bearish Engulfing signal on Wednesday formed when the stochastics were not in the oversold condition any more.

This makes the new analysis fairly simple. Further weakness on Thursday, taking prices down through the 200 day moving average in the Dow and heading to new lower levels in the NASDAQ, while stochastics are turning back down, would indicate that more selling will probably come into this market. On the other hand, a positive trading day, such as a Bullish Harami or a Doji-type day would provide more evidence that the 200 day moving average was going to act as support.

Investing In The Stock Market With Candlestick Signals

Dow

Having the Candlestick signals to make an evaluation and using other simple technical indicators provide the Candlestick investor with a much easier view of what investors’ intentions are. Thursday’s trading needs to see strength above the 200 day moving average to consider holding on to any long positions.


Related Articles
Long Term Investing – Effective Long Term Investing With Candlestick Charting
Online Trading Easier with Candlestick Signals

Trading Rules to Successful Profits – Profitable Trading Rules

Whether your passion is sports, stock car racing, or the stock market, there are “rules of the trade” that control everything. Albert Pujols can’t hit a baseball into foul territory and expect to be awarded a home run. Tony Stewart can’t drive the opposite direction of the other drivers in a NASCAR race and expect to be given the trophy. And successful traders can’t ignore the trading rules established long before they began to trade and expect to have a profitable trading career. While the trading rules of the stock market are relatively simple, they provide the framework for all traders.

Emotional Trading

Emotional trading needs to be understood, and controlled, by the trader. Hope, greed and fear are emotions, not stock market strategies. While it is important to understand emotional trading from the aspect of its effect on other traders, it cannot be part of the trading rules. Trading is a psychological game; the market is not “against the trader”, only the trader’s emotions are an opponent.

It is important to remember that losses are the result of taking risks. Risk reward ratios are concepts that are important trading rules; admitting losses early and learning from them will keep this ratio in a positive direction for the trader. The key is to accept the fact that losses will come and use your trading plan to minimize their impact. Also, it is important to realize that a missed opportunity doesn’t exist, and dwelling on stock market results outside of the investor’s portfolio creates undue pain. Realize that the market will create all of the opportunities that an investor can handle; it is important for an investor to learn from the trading rules, monitor his own performance, and learn from his, or her, investing mistakes.

Trading Plan

Some traders think that gambling with their portfolio is the cornerstone of their trading rules. Without a stock trading plan, stock technical analysis, or even a clue, they throw money at the market. Such an approach usually has disastrous results. An analytical approach can produce results that guessing and emotional trading can never duplicate. With a dedication to a trading plan and a stock trading system, a trader truly has the cornerstone of trading rules. What kinds of principles make a trading plan? Here are a few:

  • Never trade based on emotions. Have an established action plan and do not change these trading rules based on the events of any given day.
  • Establish and adhere to stop loss strategies and techniques. Even the best plan can miss and it’s important not to lose the entire portfolio over one loss. Stop loss strategies are not trading rules that add to the bottom line, but minimize losses there.
  • It is important to achieve portfolio diversification. A portfolio that is heavy in one or two stocks is vulnerable to heavy losses. It is wise to balance investments based on volatility, profitability, and stability.

Technical Analysis

Technical analysis is a systematic review of stocks and their movements. By understanding the dynamics of a company and charting its performance, an investor can attempt to discern a pattern for the movements of its stock. This trade rule is based on research and probabilities; it is the one tangible element in a largely unpredictable endeavor. Using understanding and a system such as technical analysis with Japanese Candlesticks, it is possible to find patterns and actually make sense of the stock market.

Conclusion

Above all, it is important to remember that the stock market is a business. With any business, a serious approach is crucial to reach the desired result. After learning the trading rules and perfecting the stock market strategies, it is important to do one more thing. Take a part of the profit as a reward. All of the hard work is in vane if it is not enjoyed. So when it is all finished, relax and enjoy that ball game or stock car race knowing that the trading rules have worked!