Traders buy commodity futures in the expectation that the spot price on the commodity contract settlement date will be higher than the contract price. The trader will rarely accept delivery when they buy commodity futures. They will sell an equal quantity of the commodity, thus exiting the contract. The only ones who will actually deliver or take delivery of commodities are the producers and their customers. These traders are hedging when they buy commodity futures or sell them. For example gold mining company may sell gold futures and an oil refiner may buy oil futures in order to lock in a competitive price for the next months or years. It is possible to buy commodity futures on oil and other energy products several years into the future. Trading commodities requires a basic knowledge of the commodity in question and ongoing fundamental and technical analysis in order to competently anticipate commodity price trends. To learn how to buy commodity futures engaging in Commodity and Futures Training is wise. The use of very visual technical analysis tools such as Candlestick chart analysis can lead to profitable trades in the commodities markets.
Hedging commodities by producers and their customers goes back to the beginning of Candlestick basics in ancient Japan when rice traders learned to let the market tell them what the market would do. The traders who developed Candlestick charting learned that market history repeats itself. This repetition of Candlestick pattern formations allows traders today to buy commodity futures with an accurate sense of where the market is going next and how to engage in profitable commodity trading. When producers and customers hedge they are guaranteeing themselves a set price at a future date. This is a form of insurance and means of managing investment risk. The constant buying and selling of commodity futures by the main players in the commodities markets provides a baseline liquidity and stability to commodity trading. The addition of traders speculating on market activity adds to market volume and liquidity making technical analysis more accurate and typically makes Candlestick trading tactics even more successful.
Those who buy commodity futures are buying contracts for large quantities of live cattle, gold bullion, crude oil, and other commodities. However, the commodity market offers the trader leverage so that he or she need not provide the money to pay for the entire contract. To buy commodity futures the trader will typically pay several percent of the contract price. The leverage in buying commodities can lead to substantial returns on investment. The leverage can also lead to losses exceeding initial investment. Because of the potential market volatility in trading commodities the trader is well advised to stay in close touch with his or her investment. When a trader decides to buy commodity futures the trader is not obliged to keep the contract until the settlement date. If Candlestick analysis predicts that commodity futures prices will move in a profitable direction the trader can be ready to sell an equal contract and exit his or her position with a profit. If, as can happen, a technical analysis tool such as Candlestick chart formations predicts an unprofitable market move the trader will be able to exit the position before experiencing substantial losses.
Market Direction
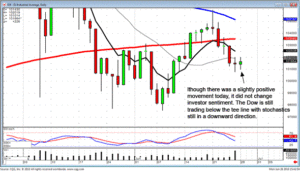
Candlestick analysis utilizes the information built into candlestick signals along with other indicators. Being able to analyze multiple indicators helps the investor see whether there has been a change of investor sentiment that is meaningful. The three predominant indicators should be candlestick signal itself, the direction of the stochastics, and the trading in relation to the tee line. Although the Dow traded indecisively today, with some elements of bullish participation, the stochastics were still heading toward the oversold condition and the trading remained below the tee line. The positive trading during the afternoon ‘might’ have caused the bears to cover short positions. However, the overall trend did not show any change in investor sentiment. If bearish, the positive trading in the markets during the late afternoon might have been uncomfortable but nothing that would have instigated reversing positions.

DOW
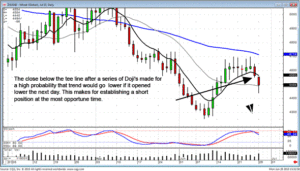
The use of the tee line, along with candlestick signals, produces high probability trade results. As illustrated in the July Wheat chart, the past two weeks of trading consisted mostly of indecisive Doji days. This revealed the possibility of two trend potential’s. Either this was a resting stage during uptrend or the trend was about to reverse. Although that may seem like an obvious analysis, the function of the tee line makes the trend direction much easier to diagnose. The lower open today was confirming the series of Doji’s to the downside. Friday’s close below the tee line made the trade decision extremely easy. A lower open on Monday would warrant immediately shorting of July wheat. The T line adds an excessive amount of credibility to the visual information conveyed by the signals. A trader is able to establish a short position was much more speed and confidence.

July Wheat
The visual aspects of candlestick analysis allows an investor to very quickly evaluate what is occurring in investor sentiment. The speed in which a trend can be analyzed allows the candlestick investor to enter trades at more opportune times. Where other trading techniques would require another day or two of confirmation, the candlestick signals provide valuable information immediately. Most investors learn how to invest with the wrong perspectives. This is due to normal human nature anticipating what price movements ‘should’ do. Reality shows that price movements usually move opposite of the normal investment thinking. This often debilitates an investor’s ability to make profits for many years, until they learn through hard knocks how prices actually move. Fortunately, the common sense investment practices built into candlestick signals allows an investor to correct their misguided thinking process. Learning how the candlestick signals are formed is a powerful training process that develops the correct insights into mastering profitable trading. This is not rocket science! This is merely learning the common sense investment principles through a graphic formation.
Chat session tonight 8 PM ET
Good Investing,
The Candlestick Forum Team
2-Day- Training Webinars
Candlestick Technical Analysis Webinar
Perfect for Beginners to Advanced Traders
Learn how to pick market-beating stocks.
Website special reflects current newsletter. If you are reading an archived newsletter you will be directed to Current Website Special
Speak Your Mind