This course is designed for individuals already proficient in recognizing and utilizing Japanese Candlesticks for technical analysis of the markets.
Who should attend this event?
Serious traders looking to increase their proficiency in technical analysis. The Advanced Chartist workshop builds upon your knowledge base to take you to a higher level of expertise.
Registered Reps interested in furthering his/her understanding of technical analysis techniques for evaluating the overall market or individual security.
To assure the education process is reinforced and put into practice all seminar participants receive a 3-Month paid subscription as a Candlestick Forum Member.
Your Instructor for this workshop

Stephen W. Bigalow
Mr. Bigalow has over 27 years of investment experience, including eight years as a stockbroker with major Wall Street firms: Kidder, Peabody & Company; Cowen & Company; and Oppenheimer & Company.
He is the owner of the Candlestick Forum, LLC, an educational website to train the investing public on financial technical analysis.
Mr. Bigalow holds a Business & Economics Degree from Cornell University.
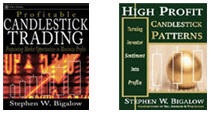
Author of‘Profitable Candlestick Trading”, published by John Wiley & Sons in January 2002 and “High Profit Candlestick Patterns” published in 2005.
Contributor to professional trade publications such as; Stocks & Commodities Magazine; Futures Magazine; Technical Analyst Magazine, and others.
Candlestick Analysis Technician – Advanced Chartist – Workshop Outline
Combining Candlesticks with other Technical Indicators
The professional investor makes sure to have as many probabilities in his favor when selecting exactly where to put limited capital. Combine candlesticks with other technical analysis, such as Bollinger Bands, stochastics, moving averages, wave analysis, and Fibonacci retracement.
Advanced Pattern Recognition and Execution
Breakout Patterns – Knowing when to get on board and when to take profits
Cradle & Belt Hold Patterns – Easy-to-identify and foretells of a dramatic change about to take place
Fry Pan Bottom – the pent-up power created in this signal can produce very compelling profits.
Trading Gaps – Gaps represent enthusiasm to get into a position to the point that investors will pay prices away from any of the previous day’s trading range. Great for identifying panic selling at the bottom and exuberant buying at the top.
J-Hook Pattern – How to differentiate between profit taking and a full-scale reversal.

Speak Your Mind