Misunderstood. That can be the only explanation for Japanese Candlesticks, the most proven investment technique in history, to be so underutilized. This technique has been exposed to the U.S. investment community for approximately twenty-five years. Yet it is only recently that interest has picked up in this highly accurate investment technique. The investor who takes the minimal time and effort to master candlesticks will reap inordinate profits. This is not an empty promise. Basic analysis of Japanese Candlesticks produce a couple of irrefutable conclusions.
A candlestick signal formation has a major aspect that makes it more powerful than all other technical analysis. The signal is the result of a change in investor sentiment. This statement will be repeated for effect. The signal is the result of a change in investor sentiment. Not the anticipation of a possible change! The actual result is the change of trend direction. Having this tool in an investor’s arsenal can dramatically change an investor’s ability to maximize profits while reducing risk exposure. It allows the average man/woman on the street to invest with the same temperament as the professional trader.
Buy at the bottom, sell at the top. Pretty easy, right? Yet where does one grab the falling knife? When is high too high? Candlestick signals alleviate that problem. A candlestick buy signal, appearing after an extensive decline in a stock price (all trading entities can be effectively analyzed with candlesticks. The term “stock” will represent all trading entities) reveals compelling information. This information inherently benefits investors, making for comfortable trading decisions.
The basic function of investing is to make money. However, few investors develop a trading program that put the probabilities in their favor. If searching for the “Golden Goose” of investment programs, the criteria would be simple; well researched, proven track record, and easy-to-identify reversal points.
All three of these elements are incorporated into Candlestick signals. Hundreds of years of rice trading resulted in the identification of high probability profitable trades. Make one assumption. The signals would not be around today if it were not for one convincing result. PROFITS! Today’s Candlestick signals exist today because of hundreds of years of actual profitable trades. Not computer back testing. Not questionable results. Profits produced from utilizing the signals are the only reason we are witnessing these signals today. Reversal points were identified by rice traders using very simple charting techniques. You can take advantage of these clear profitable signals!
Japanese rice traders used the same information found on a standard bar chart. The difference is that they put more weight on the open and closing prices as well as the high and the low of a time period. As illustrated in Figure 1, an open that is lower than the closing price creates a white candle. An open that is higher than the close creates a black candle. The positioning of these candles, with analysis of the colors of the candle, provides valuable information.
Bar Chart vs. Candlestick Chart
Until recently, mastering the Candlestick technique had its drawbacks. First, there were very few places to go to learn how to use the signals effectively. That resulted in a lot of misinterpretation of the signals. This misinterpretation created a questioning of the effectiveness of the candlestick signal technique. However, websites such as www.candlestickforum.com provide investors with a learning forum as well as the exposure to different degrees of candlestick analysis. Learning how to use the signals correctly is now easy and can provide tremendous investment profits.
Utilizing the Candlestick technique produces two powerful investment considerations. First, the demise of most investors is that great bugaboo – Emotion. Exploiting fear and greed created by the masses is the biggest contribution to professional investor’s profits. Japanese Candlestick trading eliminates emotional investing. Due to the fact that the signal is the visual depiction of investor sentiment and graphically illustrates a change, the candlestick investor becomes knowledgeable about when the masses are creating a profitable opportunity. Most investors panic at the bottom. And they get over-exuberant at the tops. Knowing this and visually seeing it happen forces the Candlestick investor to buy when the buy signal is formed at the bottom. They sell when they see the sell signal at the top. Did you ever wonder when people were panic selling, with blood flowing in the streets, who was buying? Or when the news on a company was so wonderful, who was selling to everyone piling into a stock at the top?
Secondly, the Candlestick signals have an additional powerful aspect not found in other techniques. Not only did the Japanese rice traders identify high profit reversal signals, they added another overwhelming aspect to candlestick analysis. They proceeded to interpret what investors were thinking when forming a signal. This process alone institutes dynamics that put candlestick analysis light years ahead of any other trading technique. Remarkably, what should be considered a highly sophisticated program, is merely the accumulation of common sense observations. This makes understanding candlestick analysis very easy to learn. Yet it provides insights that revolutionize most investor’s decision-making processes.
The “technology stock” bull market and crash is still fresh in everybody’s mind. The exuberance was so great that most investors didn’t know when the top was hit. Having the indexes graphically depicted by candlesticks provided a platform for knowing when to take profits and/or shorting stock. Note in Figure 2, a Shooting Star formed at the top of the Nasdaq market. A candlestick investor, upon witnessing a Shooting Star, (a Shooting Star is a formation where the open and the close are at or very near to each other at the lower one-third of the daily trading range – it illustrates that the buyers and the sellers are indecisive) at the top of a major move, would have been immediately alerted that a top was imminent.
Note that a couple of weeks later, the Nasdaq tried to make a run for another new high. However, another weak candlestick signal, a Doji, occurred prior to the move making a new high, demonstrating that the buyers were running out of steam. This would have been an opportune time to liquidate all positions.
Using the signals, whether day-trading, swing trading, or long term investing, provides a method to identify when the buyers are making a presence and when the sellers are stepping in. Even the fundamental investor can effectively use candlestick signals to protect their positions. A sell signal appearing in a stock position can give the fundamental investor an alert that something might be changing. Revisiting the fundamentals of that company may be warranted. Using the candlestick method of thinking, shareholders of Enron Corporation could have greatly modified their positioning upon viewing the candlestick chart.
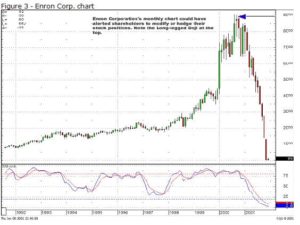
Enron
Enron Corporation’s long term chart showed signs of a pullback. The magnitude could not be anticipated, but employee retirement plans could have been modified.
Making a basic assumption, that signals have a high degree of accuracy, puts the probabilities immensely in the Candlestick investor’s favor. Adding simple confirming parameters also enhances the degree of accuracy. There are approximately 40 signals. Fortunately only eight to ten are more than the average investor needs to learn to be highly successful at investing. The frequency and consistency of these “Major” signals will produce more trading opportunities than most investors require. Easy-to-use search programs can identify a dozen highly profitable trades each day. Any investor with ten minutes of subjective analysis can fine-tune those stocks to find which position or positions are the highest probable trades.
Using the Candlestick technique provides the format for developing inordinately profitable programs. The definition of inordinate will range with the amount of time each investor can contribute to investing each day. Achieving returns of 10% to 40% monthly is not out of the realm of comfortable investing. Having a high degree of confidence in a trading entity’s direction creates many opportunities to maximize profits. Short-term traders can go long or short. Long-term investors can exploit short-term pull-backs by writing options against their positions. Relying upon brokerage firms ho-hum recommendations becomes less vital. Investors can now control the results of their own investments.
The prime aspect that allows investors to amass wealth using candlestick formations reverts to one basic element. Probabilities. Visually recognizing a pattern having a high degree of probability of changing the direction of a trend, immensely increases the investors ability to amass huge profits. To not take advantage of the knowledge incorporated in the signals is to leave an immense amount of wealth on the table. Mastering Candlestick signals and the ramifications that are built into the signals is not difficult. Having the most researched investment technique in the world provides the structure for revolutionizing investor thinking. Knowing how the signals are formed by the masses providing fear and greed opportunities, allows the Candlestick investor to take advantage of a constant supply of high profit situations. Learn to be the buyer when everybody is panic selling. Take two weeks of your life to master a technique that will forever improve your investment abilities. The concepts incorporated by the signals are those that traders are currently using to accumulate huge profits for major brokerage firms. You can participate in those profits.
Stephen W. Bigalow is author of “Profitable Candlestick Investing, Pinpointing Market Turns to Maximize Profits” and principal of www.candlestickforum.com, the leading website on the Internet for providing information and educational material about Japanese Candlestick investing. Over fifteen years of extensive study and utilization of candlestick analysis has produced an array of easy-to-learn educational material about Candlesticks. As one of the leading Candlestick experts in the nation, Mr. Bigalow, through his consulting with major trading firms, has developed multiple successful trading programs for the day-trader to the long-term hold investor.
Speak Your Mind