Stock chart patterns have been utilized in the stock market for centuries. These recurring stock chart patterns create a huge advantage for technical investors by assisting them in identifying pattern trends. Depending upon the stock chart patterns, the pattern representation alerts traders to short term trend reversals, continuation patterns, market tops, false breakouts, and potentially explosive moves in price. Stock chart patterns continue to gain popularity in the trading community due to their ability to predict price movements. It is no surprise that many of the new stock market charting programs include search parameters identifying candlestick patterns. Serious investors recognize the value of candlestick stock chart patterns and benefit from the message each signal conveys. These patterns reflect group behavior behind price movement and provide valuable insight.
Take the mystery out of stock chart patterns and learn to trade with Japanese Candlesticks. Each week we add a new article focusing on a specific candlestick pattern and unravel the secret behind upcoming price moves.
This week’s signal – Trading the Meeting Lines – A Candlestick Reversal Pattern.
MEETING LINES
Description
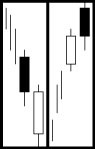
Meeting Lines (or Counterattack Lines) are formed when opposite colored bodies have the same closing price. The first Candlestick body is the same color as the current trend. The second body is formed by a gap open in the same direction as the trend. However, by the close, it has come back to the previous day’s close. The Bullish Meeting Line has the same criteria as the Piercing Line except that is closes the same close as the previous day and not up into the body. Likewise, the Bearish Meeting Line is the same as the Dark Cloud pattern, but it does not close down into the body of the previous day.
Criteria
- The first candlestick body should continue the prevailing trend.
- The second candlestick gaps open continuing the trend.
- The real body of the second day closes at the close of the first day.
- The body of the second day is opposite color of the first day
- Both days should be long candle days.
Signal Enhancements
- The longer the bodies, the more significant the reversal pattern.
Pattern Psychology
After a strong trend has been in effect, the trend is further promoted by a long body day. The exuberance is increased the second day with a gap in the same direction. But before the end of the day, the price has come back to the same closing price of the previous day. This indicates that the other sid eof the market has now stepped in. Another day, opposite of the predominant trend is required to demonstrate that the trend has reversed. The opposite colored body does not need to be a long as the first body. In every case, a confirmation day is going to be needed. The pattern has more strength if there are no shadows at the meeting point.
Candlestick Forum Flash Cards These unique Flash Cards will allow you to be “trading like the Pro’s” in no time.
Speak Your Mind