Stock Charts: Why Use Them?

Stock charts provide the investor a visual representation of a stock over a period of time. This allows you to assess stock market trends (uptrend or downtrend), to determine which levels are providing support and resistance, and many other aspects.

Technical analysts and chartists use stock charts to analyze an extensive display of securities and forecast future price movements. The word “securities” refers to any tradable financial tool or quantifiable index such as stocks, commodities, bonds, market indices, or futures. Any security with price data over a period of time can be used to form a stock chart for analysis.

Stock charts are helpful for use in stock market technical analysis and can also be useful in fundamental analysis. A graphical historical record makes it easy to see the effect of significant key events on a security’s price, its performance over a period of time and whether it’s trading near its highs, its lows, or in between.

Bar charts, line charts, point & figure charts and candlestick charts are four of the most popular methods for exhibiting price data using stock charting. A brief description of each is provided below.

Bar Stock Charts

The high, low and close are required to form the price plot for each period of a bar stock chart. The high and low are represented by the top and bottom of the vertical bar. The close is the short horizontal line crossing the vertical bar. On a daily stock chart, each bar represents the high, low and close for a particular day when trading in the stock market.

Line Stock Charts

Some successful traders consider the closing level to be more important than the open, high or low. Line stock charts are also used when open; high and low data points are not available. At times only closing data are available for certain indices, thinly traded stocks and intraday prices.

Point & Figure Stock Charts

Point & Figure stock charts are based only on stock price movement, and do not take time into consideration. Little or no price movement is considered irrelevant and therefore only price movements that surpass specifically indicated levels on stock charts are recorded. The focus on price movement makes it easier to identify support and resistance levels, bearish breakdowns, and bullish stock price breakouts.

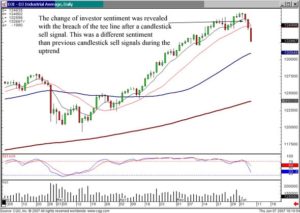
Candlestick Stock Charts

For candlestick charts, a daily candlestick is based on the open price, the intraday high and low, and the close. The open, high, low and close are all required. A weekly candlestick analysis is based on Monday’s open, the weekly high-low range and Friday’s close. Black candlesticks form on stock charts when the close is lower than the open and white candlesticks form when the close is higher than the open. This is also known as the black body or white body. The lines above and below on stock charts are called shadows and represent the high and low. Candlestick stock charts have become very popular in recent years since their origination in Japan 300 plus years ago. Many traders and investors believe that candlestick chart patterns are simple to read.

Earnings Per Share – Where The Rubber Meets The Road

It’s a classic saying. Simply put, it says that the proof is the result. It’s the same with investing in the stock market. It is possible to have the best stock trading plan, but the measurement of all your wisdom is found in one place; it all comes down to the bottom line, which is to say earnings per share.

Obviously that statement has a couple of different interpretations. One is the measurement of an investor’s performance; the other is a method of stock technical analysis which can help you to determine if a company’s stock price accurately reflects its worth. Once you are able to determine a stock’s value, you have a better understanding of whether the stock price is high, low or just right. There are a number of sources and techniques for evaluating stocks but it is generally agreed that the best method is earnings per share.

For the typical investor, stock evaluation is based on the company’s earnings. This becomes the central source of information and everything else adds to, or takes away from, the earnings report. Earnings are nothing more than a company’s profit and a reflection of how much money a company made during a certain period. And while it is normal to look for a positive earnings statement, it is not necessarily true that a small or rapidly growing company with negative earnings should be ignored. All technical analysis tools should be kept in their proper context and earnings per share can help to do that.

As can be seen in any given day on the stock market, established companies are expected to have positive earnings. If a giant like General Motors has a low quarter, the stock will likely fall as well unless there is a reason that explains the problem as a one-time event. A new company might go for years with negative earnings and still have favor with the market if investors believe in the future of the company. As a result, actual earnings are linked to expected earnings. Even if a company has actual earnings in a quarter but they fall short of expectations, it is common to see their stocks drop. Earnings, or a steady movement towards earnings, indicates the health of a company and if the stock will pay dividends or realize higher stock prices.

The most common metric of earnings is earnings per share. This calculation simply divides the earnings by the number of outstanding shares. For example, a company that realizes $10 million in earnings and has 5 million shares of stock has an earnings per share of $2.00. Earnings per share is important because it is difficult to compare companies of vastly sizes. Two companies that both earn $10 million dollars look the same, but when one company has 10 million shares and the other has 2 million, it is easy to see the difference. Looking at earnings per share can make the difference between successful trading and investing mistakes.

Earnings per share can be performed in one of three time frames: against the past, in the present or against future earnings. Each measurement has a different emphasis and the results imply different conclusions. It is important for a successful investor to review a number of different variables when selecting stocks and earnings per share can be valuable stock market trading tools in this analysis.

When analyzing a company for a potential stock purchase, earnings per share are always ?where the rubber meets the road?. The earnings per share ratio is one of the best technical analysis tools for identifying a company’s success at the bottom line.


Market Direction

How do you analyze what a trend should be doing? Easy! What are the candlestick signals revealing? That is the first analysis. If the candlestick signals are not showing anything definite, what are the next most revealing indicators? As can be seen in this current uptrend, the 20 day moving average has acted as a definite support level. When that can be ascertained, what candlestick formations occur at that level become more informational.
The weakness in the Dow at the end of last week demonstrated that the 20 day moving average was an important factor. When trying to figure out the direction of the market, being able to analyze what the investor sentiment is doing at technical levels that have previously shown some influence becomes important. Witnessing indecisive signals at a major moving average reveals the lack of selling conviction. This can be seen in the Dow chart.

Earnings Per Share, Dow

Dow

The NASDAQ has demonstrated that it does not want to close below the 20 day moving average. The sideways action of the NASDAQ while the Dow was showing some weakness produces a simple analysis. Selling sentiment has not taken control of the markets. What becomes the obvious predominant factor? The trend in general!

Earnings Per Share, NASDAQ

NASDAQ

“The market will tell you what the market is doing.” That is what the Japanese Rice traders profess. The candlestick signals are the ‘pieces’ that fine tune the understanding of what the markets are telling you. Learn the candlestick signals. Not learning proper interpretation being conveyed in candlestick signals dramatically reduces an investors potential of being in the right trends at the right times.

The simplicity of what occurs in investor sentiment can produce high probability profits. Investor sentiment produces reoccurring patterns that have occurred since the beginning of investing. The candlestick signals encapsulate simple rules. Candlestick analysis is a very easy and simple investment method for identifying when to be in a trade and when to be out.

BRLC is a recent recommendation on the Candlestick Forum. Stochastics in the oversold condition with a Doji being confirmed right at the 50 day moving average makes for a high probability trade. The stock has been in a long uptrend. It has reasonably pulled back to the 50 day moving average. This is an excellent set up for another ‘buy’ situation. The stop loss procedures are simple when using candlestick analysis. The potential target/targets are simple when using candlestick analysis. Establishing the proper exit points is very simple when using candlestick analysis.

Most investors learn how to invest backwards. They are advised to find companies that have good balance sheets and earnings growth. Through the years, they discover that criteria doesn’t work well. The best performing companies may not move for a long time until somebody else discovers the reasons for being in that position. Candlestick signals circumvent that process. Candlestick signals are formed by the cumulative knowledge everybody buying or selling during a specific time period. Understanding what the candlestick signals reveal incorporates the knowledge that other investors have done the research required for making an investment buy or sell decision. Utilizing that information produces a huge advantage for the candlestick investor. It not only indicates what the buyers and sellers are doing, it shows when they are doing it. Click here for more information on how to learn about candlesticks signals.

Chat session tonight for members 8 p.m. ET
January 11 2007- Houston, TX 6:30PM – 9:00PM

Steve will speaking to the Houston TC Users Group, meeting at HAL-PC located at 4543 Post Oak Place Dr.


New Year Specials – 20% off all Quick-Download Videos and E-Books – Buy Now before Offer Ends!

Plus – Discount Package Specials on “Profitable Candlestick Trading” and “High Profit Candlestick Patterns”

Order Now! – Discount Pricing will end on January 9, 2007!!!


Seminar at Sea – scheduled for late April – details will be on the site this coming week

Good Investing
The Candlestick Forum staff

Investing Mistakes and How to Minimize Them

Ah, those investing mistakes that everyone wishes hadn’t happened to them. Not all losing ventures in the stock market are due to foolishness. For a plethora of reasons, including reckless advice from the “experts”, emotional trading, misapplication of the basic stock investing concepts, and failure to follow a proven stock trading system all can lead to the same end.  Here is a list of common errors to avoid, improving your results and limiting those investing mistakes:

1. Never invest without a clearly defined stock trading plan. A well-conceived plan will include considerations of time, risk-tolerance, and future income….and a proven system for success (such as the Japanese Candlestick stock trading method). A plan that follows these guides will steer clear of most investing mistakes.

2. Investors don’t stick to their best investment plan. All too often, investors will feel changes in the market and not have faith in their plan. Although investing is always referred to as “long term”, it is rarely dealt with as such by investors who would be hard pressed to explain simple stock market basics. Again, a good investment plan including a strong system can help to evade most investing mistakes.

3. Investors fall prey to the “one-trick pony” method of investing. To think that a rising stock will continue to rise indefinitely, especially if it is a company to which the investor has ties, is fool’s gold. Remember, portfolio diversification is a hedge against investing mistake. Follow your system and take your profits according to your plan.

4. Too often, investors are stricken with “analysis paralysis”, overdosing on stock market information. Such an approach is confusing, frustrating, and leads to more investing mistakes. Something else is good to remember; sales pitches do not constitute research! Technical analysis can be dirty work, but the end result is usually worth the effort.

5. Investors frequently are looking for the “home run”, that shortcut to a huge profit which usually only leads to more investing mistakes. A beginner investing in the stock market will abandon a profitable investment plan to take a chance on securities that cause nothing but trouble. The fact is, a solid plan will likely improve risk reward ratios faster, and more securely, than that swing for the fence.

6. Many investors fail to respect the cyclical nature of the markets and buy the latest fad in securities at its highest price. They will abandon the plan and system that was improving their stock market results and in turn, create a “buy high, sell low” trend in their investing. 

Trade Commodities

To learn to effectively trade commodities a trader will typically start with a course such as Commodity and Futures Training. By doing so, traders become grounded in the fundamentals of commodity trading. They also benefit from the insights of experienced commodities traders. Before a trader begins to trade commodity futures live he or she will typically use programs and data included in online trading software to trade in simulation. This sort of practice trading is, obviously, a much less expensive means of learning from mistakes than by trading live from the beginning.

In order to successfully trade commodities the trader will learn to do both technical analysis of commodity prices and fundamental analysis of commodity supply and demand. Learning the fundamentals of a commodity will give the trader a general sense of trading range and general possibilities. Learning and becoming skilled at technical analysis tools such as Candlestick chart analysis will allow the trader to be able to accurately anticipate commodity price movement and trade commodities profitably.

Training to trade commodities is not limited one beginning class. Many traders sign up for an online trading course from time to time in order to maintain a sense of perspective in commodities trading and by networking with other traders.

In successful commodities trading practice never stops. Many experienced traders engage in simulation trading on a recurrent basis. Especially if a trader is interested in trying a new strategy, he or she can use years of price data on the entire range of commodities in trading software to test a theory. To a large degree it is a performance art to trade commodities. The trader may have all of the knowledge and skill needed to trade. However, he or she needs to be able to put that skill to use in a real setting. Practice makes perfect in the old saying. Practice makes profit in the commodities markets.

When one is ready to trade commodities by virtue of having learned what there is to know about fundamental and technical analysisCandlestick trading tactics, and has practiced the art of trading to a fine skill there are a number of practical considerations. The trader must decide which commodity or commodities to trade, how large a margin account to start with, and general limits on how much and it which markets he or she will trade. Trading strategy is not just deciding to buy or sell based upon trading signals. It is deciding how many hours to trade a day and how many to spend doing commodity research. Because one can trade commodity options in commodity futures as well as trade commodity futures the trader will need to decide how much time and effort to devote to options trading as opposed to direct commodities trading.

The last and, perhaps, most important issue if you want to trade commodities successfully is that reviewing results and modifying trading tactics and trading strategy based upon review makes the difference between an average trader and an excellent one. Some traders are better at trading market trends and other do better anticipating the occasional market reversal. Knowing where your strengths are and trading with your strengths is something that comes from an honest review of trading results.


Market Direction

Knowing the candlestick patterns provides a distinct advantage. It allows investors to identify which price moves may occur with much more force in an uptrending market. Obviously most stocks will move up during uptrending markets. The candlestick investor gains an advantage by knowing which stock prices have the opportunity to produce much stronger returns. This is based upon a simple premise. Candlestick patterns produce strong and predictable results. When the indexes develop price patterns, such as a J. hook pattern that has formed in the Dow, the NASDAQ, and the S&P 500, it can be assumed that there will be J hook patterns forming in individual stocks.

This becomes important information. It allows investors to purchase at the appropriate times and has an estimated price move once they have entered the trade. The price move is usually going to be equally strong as the price move prior to the Jay hook set up. The calculated price move is usually going to be a lot stronger than most price moves occurring during the uptrend. Most investors have a difficult time analyzing which direction the market should move. The candlestick investor not only has a fairly accurate analysis of the market direction, they can also utilize their knowledge for identifying which patterns may be producing the bigger price potentials.

Trade Commodities, Dow

DOW

Many of our recent recommendations came from potential short situations reversing and  forming up J-hook patterns. The rationale is very simple. Prices that appeared to have moved up very rapidly would be more likely to sell off fairly hard if the market was still heading down. However, having the visual ability to recognize when a J-hook pattern was setting up, reversing the short positions back to long positions made sense. The rapid move to the upside was the precursor to a possible J-hook pattern.

Private training sessions

The August 13 training and the August 28 training are sold out. The private training sessions are excellent formats for getting insights into full-time trading perceptions. Many investors continually learn about candlestick analysis, but they just do not seem to have that final turn of the key that allows them to make profits consistently. The major benefit of these small group private training sessions is for each individual investor has every single questioning aspect answered. this puts them into a position of not having to doubt what they might not know and start using the candlestick information in a productive progressive application.

There are two people scheduled for a third training session to be done in Pittsburgh PA. However, if there are two more people that would like to get the complete knowledge of candlesticks from a private training session, we will schedule another three day training during the first week of September back up on Keuka Lake. It will still be relatively warm and the wine tasting just as enjoyable. If you would like more details on what will be presented in a private training session and where it will be presented, please e-mail Steve@CandlestickForum.com.

Chat session tonight at 8 PM ET

Good Investing,
The Candlestick Forum Team


Current Website Specials

Video Bootcamp

Click here for details

Website special reflects current newsletter. If you are reading an archived newsletter you will be directed to Current Website Special.

Trading Options – An Introduction

Trading options can represent the best as well as the worst of commodities trading. Trading options can allow the investor to make great profits. It can also lead to disastrous results if he or she doesn’t stay with a proven trading plan. No matter what you know, it is always good to have an introduction to trading options.

Definition Of Trading Options

Options are legal agreements that give their buyers the right, not the obligation, to purchase the underlying assets at a future date. Whether it is the NASDAQ 100 or corn futures, trading options allows the investor to invest in these assets with a number of different investment strategies.

Hedging and Speculation

While other reasons also exist, the two main reasons for trading options are hedging and speculation. Each has a different investment philosophy as well as techniques for trading it. Before attempting either strategy, it is important to understand the differences between them and incorporate the one that you want to pursue into your trading rules.

Hedging

When you purchase commodities in an attempt to offset a potential downturn, you are hedge fund investing, or hedging. Hedging in like an insurance policy that protects the investor in the event of a negative price movement for a commodity. By trading options, you are able to reduce the potential downside of your commodity trading while still receiving the full benefits of investing. The beauty of this is that you limited your risk while preserving your profit potential.

Hedging can be done by investing in stable, commodities to offset any potential losses in more speculative endeavors. In addition, it can be done as a separate investment on an existing commodity investment; by having a second, opposing investment, it is possible to minimize any potential losses in the first position.

Speculation

When trading options, speculation is like the opposite of hedging. While hedging is a defensive investing strategy, speculation is purely an offensive one. Speculation can be looked at as a bet by the investor on the price movement. The interesting part of trading commodities in this manner is that not only can you make money when the market goes up, but you can profit when it goes down or even sideways. To be successful you must correctly analyze the direction of the movement as well as the amount it will move.

Given the fact that speculation can be very risky why would you want to do it? Two reasons come to mind. First, you have at your disposal at great deal of versatility. There are many different investment options for trading options at your disposal to employ. Second is leverage; by being able to control 1,000 barrels in one oil futures contract, you have a tremendous profit potential. These reasons combine to make trading options an excellent investment opportunity.

Help with Your Trading

As with any type of investing, it is important to follow the steps for successful trading, including establishing a trading system and performing technical analysis. While understanding how to trade is critical, putting your plan into action and following it is more important.  With a solid plan and the research to back it up, you substantially improve your odds for success.

Understanding Options

Trading options is an excellent way to accumulate wealth. It is important to understand the approach that you wish to take and follow that method, whether you are hedging or speculating. By understanding about trading options you will be able to implement your plans and confidently follow them, giving you the opportunity to be a successful trader in the futures market.

Hedging Strategy

How to Determine Your Hedging Strategy

To determine your strategy of choice when hedging you must first understand what a hedge fund is. This fund is an unregulated investment pool of capital for wealthy individuals or institutions that employ one of various investment strategies in attempts to gain from market inefficiencies. Fundamental and technical analysis are both used to hedge underlying risks.

When reading about the various strategies below keep in mind that many investors will use a combination of strategies rather than just one strategy. The strategies are very different and they require different levels of borrowed money. That too should assist you when deciding what strategies you would like to utilize. While there are about 14 different hedging strategies available to investors, in today’s article we will discuss handful of them.

Hedging Strategy #1 – Dedicated Short Bias

This strategy happens when the fund continuously shorts stocks it doesn’t own with the expectancy of a decline in value. The fund should perform contrary to the stock market with tremendous results and with funds having high returns when the market goes down and vice versa.

Hedging Strategy #2 – Fixed Income Arbitrage

This strategy uses bonds in a variety of different ways. One example includes the shorting of bonds of higher credit companies. The proceeds are then used to buy bonds of lower credit companies. The idea is that the Bond Confidence Index will move toward 100 and the lower quality bonds will outperform the higher quality bonds.
Hedging Strategy #3 – Market Timing
This strategy is typically based on technical factors (technical analysis) such as price, volume and market sentiment and it is short-term in nature. The goal of this strategy is to buy a financial asset with the expectation that the asset will increase in value.
Hedging Strategy #4 – Aggressive Growth

This strategy deals with investing in stocks that have a high potential for growth due to strong earnings growth or sales. Investors must understand the concept of Standardized Unexpected Earnings (SUE) in order to practice this from of hedge fund investing. This form of investing deals with the buying and selling of stocks in companies that have reported earnings either above or below estimates made by analysts.

Hedging Strategy #5: Opportunistic

This strategy is a tricky one and depends on the judgment of a portfolio manager. Basically, a fund manager rotates among all possible strategies with it depending on the point of view associated with a particular investment strategy at a specific point in time.

There are many additional strategies for hedging that are available to investors. Strategies such as the managed futures strategy, the sector specific strategy, the market neutral strategy, and the emerging markets strategy should all be considered. While this article does not explain these additional strategies this does not take away from their importance. Each investor should continue to study and learn as much about hedging as they possible can and they should also continue to research and find out which investment strategies work for them.

For additional help with investing, please continue to read additional articles located on the Candlestick Trading Forum site. There are many additional resources available to assist you so that you are on your way to successful investing!


Market Direction

Utilizing the premarket futures is a valuable tool when using candlestick signals. It allows for the preparation of establishing positions based upon the confirmation of the expected price trends of the markets. What do we want to see after a Doji in an oversold condition? Bullish confirmation the next day, to indicate a reversal has occurred. Each individual candlestick signal has some simple rules as to what to expect the following day. This makes establishing stock positions relatively easy. If we see a bullish candlestick signal in the oversold conditions, what do we want to see as confirmation the next day? The Bulls are still participating! Each morning the premarket futures can be easily seen on CNBC or Bloomberg. If we are anticipating the market is in an uptrend, and a buy signal potential has been found in a specific stock, the premarket futures will give a good insight into what is occurring in the general market sentiment before the open. If we see the premarket futures for the Dow and NASDAQ are positive, we are better prepared to establish a position in a stock based upon the confirmation of our buy signal.

Yesterday the Dow formed a Doji. Was that indicating the top of the trend channel was going to act as resistance? Because of the simple rules applied to a Doji, trading actions the next day are very simple. A trend is usually going to move in the direction of how the markets open after a Doji. Thursday morning, the premarket futures showed very strong bullish sentiment. Any potential buy signals that were discovered in our scanning techniques the previous night would probably be confirming after the market opened Thursday morning. This would allow investors to immediately start purchasing those positions. This is not sophisticated investment techniques. It is merely participating in the common sense applications of what the candlestick signals are revealing.

Hedging Strategy, DOW

DOW

It also allows for non-emotional covering of existing positions. Until the last few days, it has been recommended to carry some short funds in the portfolio. This was acting as a hedge for any severe downdraft in the market. However, upon seeing the premarket futures showing great strength when the indexes were in the oversold condition allowed for immediate decisions on the open. Those positions could be closed as soon as the market opened and the funds could be reallocated to confirming candlestick buy signals. Investment strategies should not be difficult. What becomes difficult for most investors is knowing which direction the market is moving. The use of candlestick signals makes that assessment much easier. Therefore, an investor is much better prepared to take advantage of price moves at their initial reversals.

The development of candlestick signals at specific support and resistance levels provides a much better analytical tool than most technical trading methods. It shows exactly what is going on in investor sentiment when those levels are reached. As illustrated in WBMD, the 200 day moving average was a potential target. Stochastics were moving into the overbought condition. As the price move to the 200 day moving average, we took some profits. Why? Because the price was heading toward the overbought condition. And it reached a potential target, the probabilities of a candlestick sell signal became much greater. With those conditions setting up, the anticipation of a candlestick reversal signal will make an investor much more diligent.

Hedging Strategy, WBMD
WBMD

Why do most investors not take profits when the probabilities say they should? Because they do not want to look stupid. They do not want to sell a stock at $28.50 and watch the stock continue to $45. Boy, would we look stupid! The benefit of knowing what candlestick signals can occur under specific conditions makes taking profits much easier. For those that are afraid they might look stupid, a very simple selling procedure can be applied. When the price moves to a projected target, that target was anticipated based upon the expectation that when it reached it, it would now be in an overbought condition. That process alone is the result of knowing when to buy based upon candlestick signals. Being in the right direction at the right time is difficult for most investors. Being in the right position and projecting a potential target is more difficult. When it gets there, what happens in most investors thought processes? Boy, if I was smart enough to figure out when to get in and what target it could potentially reach, this pick of mine could even go much further. Egotism starts to overplay rational evaluation.

Unfortunately, the euphoria of making big profits and being correct starts clouding rational thinking. This occurs in most all investors. What is the remedy? If the fear of selling too soon is so great that it paralyzes the rational thought processes, closeout half the position. That makes the next decision process that much easier. Today when WBMD reach the 200 day moving average,  closing out half the position put a good profit back in the account. Now the decision-making process becomes easier to contend with. Had the price continued above the 200 day moving average, our mind would be able to rationalize that we were still holding one half of a position that was continuing to make profits. This was being done in a high risk area, the overbought condition.

On the other hand, the Bearish Harari that formed after the 200 day moving average was touched would have had us closing out the other half of the position. If we had not taken half the position off at the 200 day moving average, we would have chastised ourselves for not taking profits when the target and the stochastics showed a high probability that we had reached the top. How stupid we would have felt knowing we should’ve sold at the $28.50 level when we finally closed out the of the $25 level. But selling half the position at $28.50 and the other half at $25, we now can rationalize to ourselves that we got an average around $27, or most of the profits from this trade.
The best investment trading method in the world will not work properly if it is not applied correctly. Candlestick analysis greatly improves an investors ability to handle their own emotional flaws. These aren’t arm’s-length words of wisdom. This is from the learning process of somebody that has spent 30 years in investing and needed to find ways to overcome the emotional faux pas  of investing.

Chat session tonight 8 PM ET – Click here for instructions, or if you already have HotComm installed, click here to connect.

Good investing,
The Candlestick Forum Team


Halloween Specials

TASTY TREATS FOR YOUR TRADING TOOL-KIT

Website special reflects current newsletter. If you are reading an archived newsletter you will be directed to Current Website Special.

Traded Commodities

There is a lot of information for the beginning commodity trader to learn. Traded commodities include agricultural products, energy products, precious and industrial metals, and the newly created environmental commodities. A good way to approach commodity trading is to decide which traded commodities you want to deal in. Then it is wise to do Commodity and Futures Training. A commodity trading course will familiarize you with the commodities marketscommodity trading charts, and the application of Candlestick chart analysis to modern traded commodities.
Trading commodities in agriculture includes both crops and livestock.

Crop commodities are also referred to as grains, food, and fiber. Commonly traded commodities are cocoa, coffee, corn, cotton, oats, rapeseed, rice, soybeans, soybean oil and meal, sugar, and wheat. As an example, corn is traded in 5,000 bushel lots and soybean oil in lots of 60,000 pounds. Livestock and meat commodities include feeder cattle and live cattle as well as frozen pork bellies and lean hogs. Lean hogs trade in 20 ton lots. Agricultural commodities are subject to fundamental analysis as well as technical analysis. Technical analysis charts for trading agricultural commodities go all the way back to rice trading in Japan in the days of the Samurai. Although the modern commodity investing includes much more than rice, the centuries old principles of Candlestick chart formations and Candle chart patterns apply as well to corn futures and pork bellies today as they have to rice trading for centuries.

Energy commodities include crude oil, gasoline, ethanol, heating oil, natural gas, and propane. Commodity and Futures Training will help you understand the principles of trading commodities online with energy commodities. It will show you how commodity trading info optimized with Candlestick signals can optimize your profits in trading. Training will also help you pick effective commodity trading software and understand its use.

Precious metals traded as commodities include gold, silver, platinum, and palladium. These are traded as bullion. Although each of these metals has industrial use, only silver has substantial use in industry. Commodity investing in precious metals has become widely popular in recent years as the economy has faltered. With very heavy trading it is typical that technical analysis with Candlesticks will outweigh fundamental factors in the price swings of precious metals. With trading as heavy as it currently is the trader will be wise to stick very close to Candlestick basics in trading commodities such as gold.

Industrial metals as traded commodities include aluminum, copper, nickel, lead, recycled steel, tin, and zinc. Commodity prices in industrial metals closely follow the economy. These metals trade in metric tons. Environmental commodities are a totally different breed. Carbon offsets, energy efficiency credits, known as white certificates and renewable energy certificates are new creations meant to help protect the environment. As an example of environmental commodities, carbon offsets trade in metric tons of carbon dioxide equivalent from a mixture of green house gases. One offset credit is intended to represent the reduction of one metric ton of carbon dioxide emission. Companies that successfully reduce their emissions gain these credits and can sell them to companies that have yet to reduce emissions. Although industrial metals and greenhouse gas emissions are very different they both can be traded effectively using Candlestick trading tactics. To learn more about traded commodities and about how to trade them seriously consider Commodity and Futures Training.


Market Direction

What are the candlestick signals revealing about this market trend? The market is in an overbought condition but the market is healthy. Although this may sound like a contradictory analysis, the information provided in the charts allows an investor to make a refined analysis. Statistically, the Japanese Rice traders have discovered that a trend that has moved with eight or more positive closes is due for a correction. The last time the S&P 500 had more than 10 positive closes in a row was back in 1995. It has only done this a handful of times in the markets history. Expect some profit-taking, because everybody is expecting some profit-taking. However, although the market is overbought, there has been good profit-taking on an intraday basis. This makes for a longer, more solid trend. There is not any significant exuberance occurring when it can be seen that profit-taking is occurring on a consistent basis.
Today’s trading revealed Hanging Man signals in all of the indexes. This obviously makes for market conditions to potentially show a reversal. Witnessing negative premarket futures would warrant closing out long positions that were demonstrating some weakness.

Traded Commodities, Dow
DOW

Traded Commodities, NASDAQ
NASDAQ

A major advantage for the candlestick investor is having the ability to identify both long and short potentials. The trading strategy becomes relatively simple during these market conditions. Long positions should be kept in place provided they are not showing confirmed sell signals. Confirmation requires a candlestick sell signal and a close below the T-line.

As long positions are closed out, the risk factor of rolling that money into additional long positions is relatively high. This is where the identification of strong short situations helps modify a portfolio exposure.
Simple scanning techniques reveal where strong selling is occurring. Adding a few short positions to the portfolio, even though a major cell signal has not occurred in the market indexes, acts as a good hedge. A good hedge is one that can produce profits even if market conditions don’t yet show the overall investor sentiment having change direction. As seen in our short recommendation on the BG chart, shorting the stock has high probabilities of produce a profit whether the market is going up or down. It provided an easy entry strategy today and still provides an easy entry strategy for tomorrow.

Traded Commodities, BG

BG

Each of the major signals have very simple rules that make them effective. One of the rules for a Doji is that a trend will move in the direction of how they open the price after a Doji. Add that to the recent analysis of this chart, a dark cloud signal ending the uptrend at the 200 day moving average, followed by a bearish engulfing signal on Friday made for very simple trade. If it opened lower today, it could be shorted. Today’s Doji also makes for an easy trade. If it opens lower tomorrow, it can be shorted immediately. Stochastics indicate more downside following the candlestick sell signals.

These same simple rules can be applied to very profitable commodity trading. Witnessing a sell signal as prices have moved a good distance away from the T-line make for a high probability short sale. As seen in our recent recommendation for shorting lean hogs, shorting after a Doji made the prospect of a test of the T-line very likely. A failure at the T-line would make the possibility of a downtrend continuing to the 50 day moving average or possibly lower. This is not rocket science analysis. This is merely utilizing the signals and confirming indicators that have produced consistent profits in the past.
Traded Commodities, Live Hogs
Lean Hogs April

Chat session tonight at 8 PM ET.

Good Investing,
The Candlestick Forum Team


This Week’s Specials

Candlestick Signals Educational Package

Click here for details

Website special reflects current newsletter. If you are reading an archived newsletter you will be directed to the Current Website Special.

Commodity Price Patterns

Although commodity prices may or may not repeat themselves commodity price patterns do. In fact, it is because history repeats itself that technical analysis tools work to predict the next move in a commodity price.

Certainly commodities traders have long had an intuitive sense about the commodities markets. However, it was not until Japanese rice traders developed Candlestick charting techniques in the days of the Samurai more than three centuries ago that there was an organized and teachable system for commodity trading. Today a beginning commodity trader can take commodity and futures training to learn about Candlestick trading tactics as well as modern technical analysis terms for the same Candlestick pattern formations that guided traders centuries ago.

The basic price of a commodity comes from the law of supply and demand. Inflation will make commodity prices higher in dollars even when a commodity such as gold will still buy the same amount of food or a house for the same weight that it did a century ago. Predicting changes in the basic price of a commodity is a matter of fundamental analysis. Following commodity price patterns is a matter of technical commodity analysis.

Commodities are prone to cyclical price changes. Copper futures, for example, will go down in price during an economic recession and up when traders see a recovery on the way. Corn futures may vary throughout the year as concerns about the next harvest prompt hedging by growers and buyers. These commodity price patterns are longer term, typically yearly. Commodity price patterns that emerge from the actions of thousands of traders develop over months, weeks, days, and even hours or minutes.

Trend trading of commodities is possible when the market comes to believe that the future price of a commodity and its commodity futures price will gradually go up or down. Traders will profit from buy and selling or short selling and buying commodity futures when successfully trading a trend. Doing this successfully requires that the trader follow the market and market news attentively, studies commodity price patterns, and compares current price patterns to technical analysis charts, whether they are of the modern variety or modern versions of Candlestick charts.

Just as the use of technical analysis to verify that a trend is likely to continue the trader will use technical methods to anticipate a market reversal. Although it is the basics of commodity production and the market for the commodity that ultimately decides price it is the combined actions of many traders that generate commodity price patterns. Being able to “see the forest for the trees” is an old expression for recognizing trends or the big picture. This is what Candlestick basics have done for centuries. Long before today’s statistical analysis methods were even dreamed of traders dutifully recorded commodity prices and came to recognize patterns that predicted the market’s next move. The old saying that using Candlesticks allows the trader to let the market tell him what the market will do is as true today as it was in the days of the Samurai.


Market Direction

A bounce or a reversal? How would you tell the difference? If you add all the indicators together, you get a much more clear picture of what is occurring in investor sentiment. Friday saw a bullish trading day. The Dow was up 130 points. This is not an insignificant bullish move. However, there are indicators that would confirm whether a reversal have occurred for a bounce had occurred. There were a number of indications that led to anticipating this was just a bounce in a downtrend. Although the NASDAQ formed a Piercing Signal right on the 200 day moving average, the Dow did not form a true signal. It was not a Bullish Harami because it opened lower than Thursday’s close. That might be splitting hairs, but there were other indications the markets had not reached bottom yet.

The stochastics are still heading in a downward direction. The bullish trading on Friday did not put a wrinkle in their trajectory. The NASDAQ had experienced some gap downs over the past few days in its formation of a bearish J-hook pattern. When we understand the significance of a gap down in price, it makes the trend analysis easier to evaluate. It would be very unusual to have the sellers gapping prices down, indicating a strong selling force, and then the markets reverse well before the stochastics indicate an oversold condition. The lack of strength in today’s follow-through revealed the Bulls had not yet taken over control of the trend. Continue to hold short positions and short funds until a strong reversal signal appears in the appropriate areas of the trend.

Commodity Price Patterns, NASDAQ
NASDAQ

Being able to analyze market trends provide important information when trading commodities. The weakness in the cattle market is due to the anticipation that if there is problems in the world economies, the higher cost meats are going to be less attractive to consumers. Note the rounding top, the Dumpling top formation in the feeder cattle chart. It can be seen that when there was bullish movements in the stock market Friday, the downtrend in price of Feeder Cattle became indecisive. Once the bearish trading came back into the equity markets, cattle prices sold off again.

Commodity Price Patterns, FC
FC

This weekend the Candlestick Forum presented a two day training on how to analyze and correctly position oneself in commodity trading. Candlestick signals and patterns work extremely well when trading commodities. The Japanese Rice traders made fortunes trading the most basic of all commodities, rice! Trading commodities has advantages. The perception that commodities are very risky becomes greatly diminished when applying candlestick signals to the trading program. There will be more commodity picks available in the members area. This may not be a daily occurrence due to the limited number of commodities. There are very simple procedures for establishing commodity trades that have a high probability of moving in the correct direction immediately. This greatly relieves the emotional anxiety of being in a commodity position.

Chat session tonight at 8 PM ET

Good Investing,
The Candlestick Forum Team


Current Website Specials

July 2010

2-Day- Training Webinars 

Candlestick Technical Analysis Webinar – July 10 & 11

 Options Training Webinar – July 31st & August 1st

Click here for details

Website special reflects current newsletter. If you are reading an archived newsletter you will be directed to Current Website Special.

Stock Investing System – Do You Have One In Place?

It sounds logical enough; an investor needs a good stock investing system. But then comes the obvious questions; what is a stock investing system and how do I establish a good one? First, a stock investing system is a system for evaluating stocks, identifying risk and profit objectives, and planning a long term investing strategy. Secondly, a good stock investing system will also include a stock trading system such as Japanese Candlesticks. While it is important to realize that even the best stock market investing strategy isn’t perfect, successful traders maintain that the discipline to follow their plan contributed to their success more than their trading philosophy. They know that the proof of a good plan is tested over time.

Adding to the success of a stock investing system are the stock market trading tools, specifically the tools used for stock technical analysis. When coupled with a system such as candlestick chart analysis, an investor can know that his or her trading plan contains the components necessary to establish a successful presence in the market. With all of this power available, an investor must still be able to recognize when they have made a mistake and recover successfully. A good stock investing system will include stop loss strategies so that an investor is prepared in the event that a particular investment goes bad. Preparing for exactly such a situation can be the difference between success in the market and complete failure.

Another valuable concept for the investor is portfolio diversification. A portfolio that has a broad variety of commodities, varying levels of risk, and diverse profit potential can be an excellent way to insulate an investment. This way, it is possible to speculate on a stock and use the rest of the portfolio as a hedge against a devastating loss. Such a practice is valuable in any stock market trading system.

How does the investor figure into a stock investing system? The investor is the centerpiece of every successful, or unsuccessful, trading plan! The market is a psychological adventure, with euphoria, boredom, joy, pain, greed and fear all attempting to alter the stock investing system of the investor. A wise trader is able to withstand the emotions of the market and stick to the stock trading plan. Avoiding investing in unknown markets and resisting the temptation to invest out of boredom are factors in avoiding potential problems.

While the market has many pitfalls, a good stock investing system can assist any investor who wishes to realize a profit trading in the market. When beginning investing in the stock market, it is immensely important to develop a plan to trade stocks, acquire the necessary stock market trading tools to create an edge, and learn from those who have gone through it all before. While the market is unpredictable, the principles and techniques needed to be successful are time tested and reliable. As with any event in life, a good stock investing system and the lessons learned by others will provide the best investment advice an investor can ever receive.

How To Invest In Stocks

When you are learning to invest in the stock market, you soon find out that the stock market can supply you with a lot of stocks every day. Many of them profess to be stock market movers, hot stocks related to new technology from the health care, homeland defense, nanotech, biotech, voip, or internet sectors.

Most of them seem attractive, but the truth is that quite a few of these investing and trading opportunities might not be as profitable as you think. That’s why it’s important to learn how to invest in stocks the right way, especially if you plan to invest in them on a daily or weekly basis.

When you learn how to trade stocks the right way using the basics of stock market investing, you will hopefully be able to consistently pull money out of the markets in a short period of time.

You don’t necessarily have to trade hot momentum stocks all the time. However, you can learn how to take advantage of them when you encounter the best opportunities for going long or for shorting them to make money when they are poised to fall down.

The truth is, leaning when to invest in stocks is not as important as learning how to invest in stocks. And how you invest in stocks should take into consideration what goals you are setting for that investment. For instance, are you investing for capital appreciation or for income through dividend paying stocks? Are your investments in the stock market for the combination of both capital appreciation and dividend income? Are you investing through a Mutual fund(s) or selecting your own individual stocks? Are you employing solid stock investing concepts?

Do you invest with a lump-sum dollar amount or dollar-cost average into your stock or Mutual fund positions (buying the same stock or Mutual fund at different prices over the years)? Is your investment dollar spread too thin and are all of those dollars working for your ROI (return on investment)? Do you pay commission fees to purchase a stock? Who do you use to help with investing?

Do you pay load fees in your Mutual funds? How large an amount does your Mutual fund charge you for ‘hidden fees’ such as management, operating, and marketing fees?

Learning how to invest in stocks is more important than when you invest in stocks and how you invest will determine your ROI.

A good stock market investing strategy incorporates a comprehensive a how-to plan that takes into consideration all of the factors above. Remember, every penny of your investment dollar should benefit you and your loved ones and no one else.