Stock Trading Methods, Do They Work?

Over the past 10 years, the number of stock trading methods that have been revealed on the Internet has exploded. Everybody promotes their stock trading methods that are reported to have been working. It seems surprising that these stock trading methods didn’t seem to be around before the internet showed up.

There are always the fantastic claims about the returns that these stock trading methods are producing. Yet you never find anybody that has been participating in these fantastic returns. That becomes another learning process in most investor’s investment education. The one basic rule, in regards to investing, is that when you find something that works consistently, continue to use it and try to improve upon it.

Candlestick analysis investing is most tested and proven investment methodology. It has been in existence for hundreds the years. The one predominant point that is demonstrated on the Candlestick Forum site is that the candlestick patterns put the probabilities of being in a correct trade highly in your favor. Are you going to get rich quick with candlestick signals? Are you going to make money on every single trade you do with candlesticks? Probably not! But you will have the opportunity to use a stock trading method as a framework for producing consistent profits. The common-sense rationale that is used for forming the signals allows you to develop investment strategies that can implement new computer-technology processes and/or establish optimal timing strategies for fundamental research recommendations.

When you learn how to utilize the candlestick signals correctly, you now have the knowledge that will improve your trading techniques for whatever trading entities you want to trade. You do not have to depend on canned programs that sometimes work and sometimes don’t work. You do not have to buy or sell stock recommendations blindly when a research analyst recommends a stock. The candlestick signals give you guidance as to what investors are actually doing at that point in time. There is something in the dynamics of Candlesticks. Learn them and your investments perceptions will be improved for the rest of your life.  Utilizing candlestick charts will greatly improve your analytical abilities


Market Direction

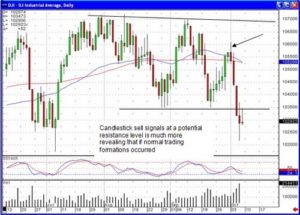
The NASDAQ had a hard time getting through the 50 day moving average. At the same time, Thursday, the DOW did a bearish engulfing signal. Thursday confirmed the selling after they’d tried to push it up through the 50 day moving average one more time in the Nasdaq. The lower open on Friday confirmed the selling, or the lack of buying at the 50 day moving average area. The stochastics also were starting to turnover in the overbought area.

Stock Trading Methods, NASDAQ

NASDAQ

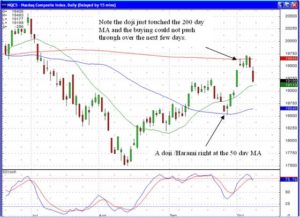
Note how the Doji just touched the 200 day moving average, showing weakness at an important level. Also notice how the Doji/Harami revealed the buying starting five days earlier. Again, this is to illustrate that when you see a Candlestick signal at an important technical level, this acts as an additional confirmation that something important has occurred at those levels when combined with a Candlestick signal.

As you have seen in the “morning comments” and more specifically in the member “market comments”, it has been recommended for the past few days to be taking profits in the weak “long” positions and start adding to the short positions. This was nothing more than witnessing potential candlesticks sell signals occurring at important resistance levels. Over the past few days, a portfolio would have been shifting from being predominantly long, equally balanced, and then predominantly short. This makes moving with the trends an easy process.

Trading Commodities – Is It For You?

As with every other type of investing, trading commodities forces the investor to understand the relationship between knowledge and success. There is an old saying that if you completely understand a problem it is nearly solved; this is very true when you are trading commodities. While it is true there are many people that succeed at commodities trading, the typical investor will lose money. Most investors do not accomplish the things necessary to be successful and failure is the only other option. Your investing is a business that requires training, experience and plenty of digging through facts and information, things that occur in most successful businesses.

The Potential of Trading Commodities

Trading commodities has is viewed by some as being much riskier than investing in the stock market. While there is risk, the truth is an investor can raise or lower that level of risk. If your approach to your trades is conservative, you accept reasonable returns and you take the approach that this is a business, then the probability of success in commodity trading rises dramatically.

Trading commodities has its risks but the rewards can be very nice as well. One example of rewards in commodity trading is a man who is said to have borrowed less than $2,000 and amassed a $200 million fortune in ten years. While these results are extraordinary and not everyone can expect the level of successful trading he achieved, it is possible for you to make money trading commodities.

What is Involved When Trading Commodities?

Trading commodities is unlike investing in the stock market or bonds. When you are trading commodities, you don’t actually own anything. You are speculating on the future direction of the price for the commodity you are trading. The terms “buy” and “sell” merely suggest the direction you think future prices will take.

Trading commodities allows those who are involved with a particular commodity to lock in the price to avoid devastating changes later. A drilling company may sell oil futures if it believes that crude oil prices are going to fall in the future; in turn a refinery might buy futures if prices appear ready to rise. No matter which direction the prices move after that, both the drilling company and the refinery are guaranteed their price. The investor is the one who looks for changes in the commodities markets and attempts to gain advantages by buying or selling for a profit.

Is Substantial Risk Unavoidable Trading Commodities?

There is a potential of tremendous risk when trading commodities but reducing that risk can be easier than you may think. Some of the things that can be done when investing in the futures markets to limit risk include:

  1. Being Conservative – Deciding to follow a conservative approach can limit your risk; avoiding greed and fear can go a long way to improving your chances for success. Those who follow an aggressive trading pattern expose themselves to much higher risk.
  2. Doing Your Research – Knowing your commodity and the conditions that move it will help you to avoid changes that put your positions in danger.
  3. Learning Techniques for Avoiding Loss – There are techniques you can use to help minimize loss. For example, instead of accepting a loss by taking or making a delivery, an investor can offset the position before the delivery date. If the commodity eventually makes the right move, the investor has improved his or her position.
  4. Having a trading system – Using a system like Japanese Candlesticks to track commodities and predict their future movements is not only a conservative move but a profitable one as well. Candlesticks originated in the commodities markets in Japan hundreds of years ago and it is perfect for trading commodities today.

Conclusion

While not everyone will want to start trading commodities, it is still potentially very profitable. The danger is that the risks can be limitless to an uninformed, undisciplined investor. The good news is that if you create a set of solid trading rules and educate yourself on the markets and techniques required trading commodities can be a very rewarding and exciting adventure.

Commodity Price

Commodity Price Introduction

When looking at commodity trading and each commodity price, it can be very confusing at first. Most of the trading works by investors buying and selling futures contracts, instead of trading directly in commodities.  Futures trading is very similar to trading stocks and bonds. The only difference is that the futures contracts have an expiration date unlike stocks and bonds. The main component when discussing commodities is the commodity prices and the quotes associated with each. There are a lot of commodities that can be traded, a few of which include gold, coffee, live cattle, natural gas and corn. Depending on the type of commodity you are trading, you will find that you must trade on a specific exchange and that each commodity has a different commodity price. They are not all traded on the same commodity exchanges.

Gold is a commodity that most new traders begin trading in due to its historical track record regarding its commodity price. It is very accessible, and has very few troubles in the commodities markets. Coffee is referred to as a soft commodity when compared to metal, energy, grain and the commodity price for coffee is quoted in cents per pound.  Live cattle futures are traded on one of the oldest exchanges in the United States, the Chicago Mercantile Exchange (CME), and the commodity price is established in cents per hundredweight. When commodity investing, that natural gas is noted as dollars per million on the New York Mercantile Exchange (NYMEX). Corn is also another commodity frequently traded and is known to have the longest history in commodities.

Commodity prices have gone through the roof recently and are one of the fastest growing market sectors of the financial markets. When trading commodities, there are a slew of them to choose from. In addition to the few mentioned above, other commodities include wheat, soy meal, sugar, steel, copper, platinum, crude oil, soy beans, oats, and gasoline. When commodity trading, you should aim to buy low and sell high, or sell high and buy low. You must also understand the concept of commodity trading hedgers. Hedgers aim to guarantee each commodity price in order to lock in profits or to avoid excessive losses. There is also the concept of commodity trading speculators.  They are on the opposite end of the hedger and they have no business interest in the commodities. They simply bet on whether or not the price of the commodities will go up or down. It requires very little margin, but it can lead to very big losses as well. If you plan to trade commodities, it is very important that you have a good credit standing when you go to apply for a commodity trading account.  It is more important than when trading commodities, than it is when trading stocks.

The above is just a quick introduction to the commodity price and various commodities trading concepts. If you are seriously interested in getting involved in this financial market, there is a wealth of free knowledge available to you on the internet. It is important, to however, invest in some sort of commodity training classes, e-books, etc, before you get started. 

Commodity Market

The commodity market is where raw or primary products are exchanged through the buying and selling of futures contracts. This market originally began with the buying and selling of agricultural products such as wheat, corn, cattle and pigs. Other foods such as soybeans were only added recently in most of the commodities markets whereas agricultural products were widely traded in the 19th century. In order for a specific type of commodity to establish itself in this market, there has to be a broad consensus on the different variations in the product that make it acceptable for various purposes.

Commodities trading online occurs when traders trade futures contracts for goods, but the traders don’t have to physically deliver the good to the consumer. The contract means that the investors instead will determine if the commodity price will appreciate in the future, or depreciate in the future. If the trader thinks the price will appreciate he will buy a future contract for the commodity, and conversely if the trader thinks the price will depreciate, he or she will sell the future contract to avoid losing money. The main requirement in the commodity market is that the trader must deposit enough capital though a brokerage firm to ensure that he or she is able to pay for potential losses if they are unsuccessful in their trade.

The commodities exchange is highly regulated and the trading is done in the “pit”, meaning that the transactions are handled by licensed commodity brokers. These brokers bring together buyers and sellers and aim to identify your investment shortcomings in order to help overcome those drawbacks.

Unlike in the old days, you don’t actually visit the commodity market in order to do business, but you instead go though a broker who takes your order to exchange for you. Your broker can either be a live person you speak with on the phone to place your orders, or it can be an online broker, or electronic commodity trading over the internet. The best known markets in the United States for trading commodities are located in New York, Chicago, Kansas City, and Minneapolis.

Many investors utilize Japanese candlestick signals in order to develop a highly profitable commodity trading system. Commodities are actually easier to trade than stocks when using candlestick signals because there are fewer outside influences to affect commodity prices. Continue to learn about how candlestick analysis can help you to trade commodities successfully. 


Market Direction

The inherent credibility built into candlestick’s can be readily seen in days like today. It is a very simple analysis. Candlestick patterns are recognized for the inordinate strength provided in price moves. The Japanese rice traders witnessed patterns throughout the centuries that were created with very specific parameters. Just as they were able to analyze what investor sentiment was doing in individual signals, they were also able to explain the investor sentiment that created price patterns. Patterns are produced based upon the accumulation of buying or selling pressures that result in anticipated price moves. That in itself is a very strong element for producing  large profits.

When the market trends can be identified, price patterns can produce much larger profits than a normal price trend.
Additionally, the buying forces that are building up in a bullish pattern are less likely to disappear when general market conditions suddenly turn in the other direction. As witnessed in today’s market, numerous Candlestick Forum recommendations continued to trade positive, or at least held up well, in a very hard selling market. It is not unusual to have a bullish portfolio finish a day net positive during a very bearish market day. If not net positive, at least very close to breakeven for the day. The pre-market futures today indicated some potential profit-taking. Many times, this puts an investor in a position of having to decide whether to take profits in specific positions. This always leaves the nagging question, “is this position merely pulling back due to profit-taking, or should I close the position?”

Candlestick formations often help answer that question.

A bullish trending position may open lower when pre-market futures indicate  strong selling. However, the candlestick formation  provides a much more clear picture of what is occurring after the price opens. If the price starts moving up after the open, the bullish candle is very clearly visible. What does it tell us when a price opens lower, then starts showing a bullish candle? Very simple, it reveals there is continued buying although it opened lower. This is very important information when having to make a decision as to whether to liquidate a trade based upon weakness.

Commodity Market, HK

HK

Commodity Market, CHK

CHK

Candlestick patterns make it very simple to anticipate what should be occurring next in that pattern. The Candlestick Forums recommendation on GERN was based on a very simple pattern analysis. Yesterday the price formed a Doji/Harami after just touching the tee line. This was a set up for a possible Jay-hook pattern. After the price opened and started trading down today, a very simple entry strategy could be implemented. If the price came back up through today’s open, essentially going positive, this would be further confirmation a Jay-hook pattern was developing. This position was bought during the day as the price came back up through the open price in despite of the fact the markets were still selling off extremely hard. The pattern identification was the result of the predetermining factors for creating a Jay-hook pattern; a very strong price move. After a couple of days of pullback, supporting at the tee line and producing a potential candlestick reversal signal, it was very easy to establish an entry point based upon a high probability results if the price eventually went positive.

Commodity Market, GERN

GERN

Other positions in the portfolio have the same potential on a big bearish day in the indexes if they were established based upon a pattern set up. Learn how and why candlestick patterns are created. Having this knowledge allows for positioning a portfolio to continue to do reasonably well even with the markets moving unexpectedly  in the opposite direction. This is not difficult information. The Japanese rice traders merely incorporated commonsense investment perspectives in easy-to-visualize graphic formations. Applying that knowledge to fundamental research or strictly technical trading allows an investor to understand why  prices move as they do.

Chat session tonight 8 PM ET — Everybody is welcome, bring your friends. Invite those people you think would be a good investment associates as you are trading during the day or week. Tonight session will concentrate on recognizing which patterns are setting up for the best potential trades.

Good investing,

The Candlestick Forum Team


Candlestick Precision

This Week’s Special

Setting Entry and Exit Points
E-book Profitable Entry & Exit Strategies

Click here to purchase

Website special reflects current newsletter. If you are reading an archived newsletter you will be directed to Current Website Special.

Futures

This market is an auction market in which participants buy and sell commodities and/or futures contracts. They buy and sell on a specified upcoming date. In other words this market requires a financial contract that obligates a buyer to purchase an asset and a seller to sell an asset at as a financial instrument or physical commodity at a predetermined upcoming date and price. Some contacts may call for the physical delivery of the asset, while other contracts are settled in cash. In fact, the likelihood of physical delivery of a commodity is extremely low.

In this market an investor can hedge or speculate on the price movement of the underlying asset. For instance, hedging is to make an investment to reduce the risk of adverse price movements in an asset. An example is to own stock and then sell a contract stating that you will sell your stock at a set price. You then are able to avoid market fluctuations.

This type of contract is standardized and the upcoming date of delivery is called the delivery date or the final settlement date. The official price of the contract at the end of the day’s trading session on the exchange is called the settlement price for that day of business.

This type of contract gives the holder the obligation to make or take delivery under the terms of the contract, whereas options trading, grants the buyer the right, but not the obligation to establish a position previously held by the seller of the option.  For example, if you were long in a contract, you could go short the same type of contract to offset your position. This would serve as your exit position just like selling a stock in the equity markets would close a trade.

The owner of an options contract may exercise the contract, but both parties of a futures contract must fulfill the contract on the settlement date. As stated above, the seller delivers the underlying asset to the buyer, or if it is a cash-settled contract, the cash is transferred from the future trader who sustained a loss to the one who made the profit. In order to exit the commitment prior to the settlement date, the holder of the position must offset their position by either selling a long position or buying back (covering) a short position, thus effectively closing out the position and contract obligations.

There is a lot more to this market and every investor should do their homework before trading commodities. Continue to research and find a trading strategy that works for you.


Market Direction

The holidays usually do not provide a major direction for the markets. Most traders are gone. The simple techniques provided by candlestick signals reveal the same information in lethargic markets as they do in active markets. The market is currently moving sideways. There does not seem to be any urgency to buy, yet no urgency to sell. This has been the market conditions for most of 2008. There has been many weeks/months for the market did not have any tradable trend. However, 2008 was a relatively profitable year. Although there were times when the markets were not moving, when the markets did move, some huge profits were made. This is why it is important to let the markets tell you what the markets are doing.

Futures DOW 2008

DOW  2008

There were numerous periods where the Dow just went sideways, making it difficult to make money either long or short. Unlike the trends we saw in late 2006 going into 2007. Being able to analyze the market trends allowed for exploiting profits by being positioned correctly
 
Futures DOW 2009

DOW 2009

One of the main functions of candlestick analysis is to discover what patterns are occurring. This becomes extremely important in how to trade the market. The power of candlestick signals is incorporated in the ability to analyze what investor sentiment is producing. There will be some big profits to be made in 2009. Where are they going to be? That we do not know! But taking advantage of the information that is built into candlestick signals will allow us to place funds in the markets at the right places at the right times.

Chat session tonight for members only 8 PM ET

Good investing,

The Candlestick Forum Team


Online Training Sessions with Stephen Bigalow


Click here for details

Group size is limited; Sessions fill quickly – Pre-register early

Traders

Traders in Commodities

Traders who trade commodities so do for many reasons. One reason is that commodities provide the opportunity for investors to make huge profits in a relatively short period of time. Also, futures trading as it relates to commodities, is not as complicated as trading stocks. There are only about forty markets to speculate on when trading futures compared to trading stocks where there are literally thousands of stocks to choose from. Additionally, futures are very easy for investors to buy and sell and there is the potential for profit whether or not prices go up or down. Not to mention the fact that commission fees are much lower than the commission fees when trading stock.

Futures trading involves the speculation of whether or not the price of a commodity will rise or fall. It is not like buying stocks and bonds in which you physically own something. Investors will, for example, speculate on the price of soybeans. If the trader thought that the prices of soybeans was going to rise, then he or she would purchase a soybeans futures contract. On the contrary if the investor thought the price of soybeans was going to fall, then he or she would sell their soybean futures contract.

Another plus to trading commodities is that you can begin trading with very small purchases. Of course the smaller the trade, the smaller the profit, but there is also a lower risk with smaller trades. This is an advantage because it allows traders to get up to speed in the futures markets before they begin to place larger trades. Additionally, may investors will implement a stop loss order in order to minimize risk. This stop loss will automatically happen when the set price is reached. Then the commodities previously purchased are sold automatically to prevent from a larger loss.

For those investors interested in this type of investing there are certain fundamentals that must be understood. Growth and inflation are the most important factors to take into consideration. The prices of the futures markets are based on the predictions of what the futures market will do. Therefore future predictions of growth and inflation are crucial to commodities trading so that investors can accurately predict what is likely to happen. Inflation and growth are far more important than historical data when commodity investing.

In addition to the fundamentals, traders must also understand the technical indicators used to spot trends before prices become unprofitable. They should also become familiar with concepts such as market value, supply and demand, and trading behavior. Market value is important to understand because it has to deal with price fluctuations and trend reversals. Supply and demand is a familiar concept to many however commodity trading requires that investors research all factors that come into play with supply and demand. Trading behavior is also very important no matter the type of trading whether it is stocks, bonds, stock options, or commodities. It deals with the psychology of trading and how self-awareness or lack there of in regards to individual trading behavior affects every day trading decisions made by investors.

Continue to research the futures market and decide if it is the market for you. Be sure that you fully understand the concepts discussed above, that you implement a trading plan, and that you develop and maintain the discipline to stick with your plan.


Market Direction

Candlestick signals reveal the truth! No matter what the rhetoric is being reported on specific topics/stocks, candlestick signals reveal the true sentiment that is conveyed by investors. When you see record-breaking earnings reported by a company and a candlestick sell signal appears, that reveals the true sentiment of what investors were expecting or anticipating. When you see politicians reporting one thing, and the market responding in a different manner, that reveals investor sentiment is reacting to what is really occurring. When the Dow was trading down 200 to 300 points on a day when the signing of the mortgage bailout bill was supposed to occur, that was an immediate indication that something was not right. Did the markets already know that there were not enough votes to pass the bill? If you are controlling billions of dollars of investment funds, you probably have the research capabilities to know the true prognosis of how many votes are going to be voting for and against the Bill. When money is on the line, the smart money will know what the truth is well before the average investor on the street. The benefit the candlestick investor has is being able to see what is occurring with people that actually buy or sell based upon the information they have.

Candlestick signals provide a huge advantage. It allows for a visual confirmation of what buyers and sellers are actually doing. Candlestick patterns provide a broader road map to indicate what is occurring in investor sentiment as time moves on. A pattern can be the accumulation of individual candlestick signals. It is very important to remember that each signal is the result of investor reaction that occurs over and over. That information can be extrapolated into accurately projecting what is occurring during a price trend or a pattern. Because each signal incorporates common sense analysis, that common sense can be applied to bigger price moves. As discussed in the previous newsletter, the Dow is in the process of forming a Dumpling Top. The ‘result’ of the Dumpling Top is in progress currently. A large price decline is usually the result after a Dumpling Top has been identified.

Traders in Commodities, Dow

DOW

Large profits can be made with confidence when the results of investor actions can be identified. The Candlestick Forum Online Training seminar concentrates on ‘what’ produces excessive profits in the markets. This boils down to knowing what signals and patterns to recognize and understanding the ramifications. The most powerful element of investing is committing funds where the probabilities are greatly in your favor. Fortunately, candlestick analysis is the implementation of visual common sense graphic depictions. You do not have to be a great fundamental analyst. You do not have to understand the results of political involvement in the equity markets. All that information is provided by candlestick charts. Wouldn’t you like to be able to visually evaluate price movements with a high degree of accuracy? That is what you will get from two days of candlestick training.

Many investors go through a lifetime of following the practices of Wall Street. Most people learn too late that Wall Street does not instruct people how to make money. Wall Street is established for making money through the mechanics of investing your funds. Wouldn’t you like to know why prices move as they do? It is very simple once you understand the information conveyed in candlestick analysis. This coming weekend, October 4 and 5, you have the opportunity of gaining extensive insights into the movements of investment prices. It is not based upon “secret” trading methods that are just now being revealed. You will learn the simple common sense techniques that the Japanese rice traders proved to be extremely profitable over the past four centuries. Take time to learn what the most proven trading method has to reveal. Whether you are a day trader, swing trader, or long-term investor, candlestick analysis allows you to understand where the high probability profitable investment situations are developing. This is not rocket science. These methods were developed by simple rice traders. The result was that the simple rice traders became legendarily wealthy. Investor sentiment has not changed over the past four centuries and will not change over the next four centuries. The human mind works with reoccurring habits. Fear creates panic. Greed creates exuberance. When you can identify those factors with simple graphics signals, you now control your own investment destiny. Join us this weekend. It’s well worth your while. Click here to sign up.

Chat session tonight at 8 PM ET for members. – We will discuss what created the dumpling top and what could result immediately from actions or non-actions of Congress that could produce extremely large profits.

Good investing,

The Candlestick Forum Team


Candlestick Precision

This Week’s Special

Setting Entry and Exit Points

PLUS video-companion printout
and if you buy now

BONUS E-Book Profitable Entry & Exit Strategies. .

Click here for details

Website special reflects current newsletter. If you are reading an archived newsletter you will be directed to Current Website Special.
 

Candlestick Signals, The Ultimate Technical Analysis Tools

What is the main purpose of technical analysis? It is the visual evaluation of chart patterns that reveal high profit situations. Candlestick signals provide the ultimate technical analysis tools for identifying price reversals.

Understanding how to use the Candlestick signals effectively allows an investor to master the markets. Technical analysis tools should be easy to use and have a high-probability expected result.

Using Candlestick signals with other technical analysis tools dramatically enhances trend analysis capabilities. Where other technical analysis tools provide a format for anticipating what ‘might’ be a price reversal area, the Candlestick signals provide the information that demonstrates exactly what is going on at those levels. The results of hundreds of years of actual use make Candlestick signals one of the most effective technical analysis tools.

The news media can be your first source of where to apply technical analysis tools. The Candlestick signals identify the result of investor sentiment. As has been seen for the past two months, Crude Oil prices were the main concern. Of course, high gasoline prices were going to be a big damper on the American economy. The media was reminding us of that fact over and over. Now there is a new fear! Natural Gas prices! Heating our homes through a cold winter is going to deplete the American family’s budget.

The media has now targeted the next fear factor. However, having the ability to analyze the price trends of other factors that may cause positive or negative sentiment in the equities market becomes a valuable technical analysis tool. The Candlestick signals can be utilized for analyzing any trading entity that involves fear and greed.

Candlestick Signals, Technical Analysis, Natural Gas

Natural Gas


Market Direction

The immense advantage that Candlestick signals provide is the capability to visually witness what a trend might be doing at important technical levels.

The evaluation of what the Dow might be doing becomes much easier to visualize when applying Candlestick signals to other technical analysis tools. As seen, the Bullish Harami stopped the downtrend right at the previous lows of late August. Stochastics were in the oversold area starting to curl back up. What would have been the logical target? The 10,700 level that seems to be the resistance area, creating a trend channel.

Candlestick Signals, Technical Analysis, Dow

The Dow

However, the moving averages were the first target. Prior to reaching the level of the moving averages, they may have been evaluated as being a possible congestion area. Viewing the moving averages back through mid-August, they revealed some congestion at those levels but the trend eventually moved through them. The Candlestick signals allow the investor to actually see what is occurring when the moving averages are tested. In the case of the Dow, a small Hanging Man signal was followed by a Bearish Engulfing signal. These were reversal signals. This is stated to point out that there could have been some selling or congestion on the moving averages where the formations were not actual signals. The fact that Candlestick “sell” signals formed at these levels provides a completely different analysis. The expectation of a reversal at the moving averages becomes that much more anticipated than if non-signal selling days had occurred at the moving averages.

The same could be seen in the NASDAQ chart. As the NASDAQ came back up to the 50 day moving average, it formed a Shooting Star. Not only was this a potential sell signal, but the fact that it gapped up slightly and then formed a Candlestick ‘sell’ signal was that much more of a forewarning that the 50 day moving average was going to act as resistance. This becomes further confirmed the

Understanding Commodities Markets

With a rich history and an exciting future, trading in the commodities markets will continue to be very popular. For those who are already involved in commodity trading, it can be an exciting adventure. For those who are thinking about getting in, now is a great time to learn how to invest. For both the newcomer and the experienced trader, a little understanding about commodities markets is always helpful.

Commodities Markets In The US

Today’s commodities markets in the United States trace their origins to futures trading in Chicago, IL in the early 1800s. Because of its location at the base of the Great Lakes and its close proximity to the farms of the Midwest, Chicago was a natural center for transportation, distribution and trading commodities. Overages and shortages of agricultural products caused extreme changes in price. An exchange was needed that would bring together a market to find potential buyers and sellers of a commodity instead of making people bear the burden of finding their own. In 1848, the Chicago Board of Trade (CBOT), the world’s first futures market was formed. Trading was originally in futures and the first contract was written on March 13, 1851.

General Futures Exchange Information

Unlike in the past, you will not actually go to the commodities markets to do business with the futures exchanges. You will invest through your broker who will take your commodity orders to the exchange floor for you. Your contact with a broker can either come from telephone contact to relay orders or electronic commodities trading in the Internet. While there are futures exchanges throughout the world, the best known markets in the US are in Minneapolis, Kansas City, New York and Chicago.

Regardless of which method is used, the basic concept is the same; the investor submits his or her futures options market order and based on the information contained in the futures contract, a purchase or a sale is made on behalf of the investor by a commodity broker. As you probably remember, this legally binding agreement gives the purchaser the right, not the obligation, to buy or sell the underlying asset. While the commodities themselves might be different, the commodities markets are the same.

Commodities Markets

While the world of the Internet has eliminated some of the magic of the commodities markets, the actually floor trading is still fascinating. Most commodities markets are divided into pits where the brokers stand facing the center. Each is dedicated to commodities trading that are specific for that pit. For example, the Chicago Board of Trade has large pits for soybeans, T-bonds and corn futures in addition to many others. The COMEX in New York is home to more that one futures exchange. There you will likely find pits for such commodities as heating oil, gold, cotton, coffee and orange juice.

Another consistent feature of commodities markets is that like trading in the stock market, the people that are on the floor must be members of that particular exchange.  By paying dues and assessments, these members help to support the exchange.  For non-members, it is necessary to find a member broker to do your commodity investing.
The commodity market provides the place to trade and has all of the related support facilities, such as phones and price-reporting and dissemination systems.  The commodity market does not set prices or buy and sell for itself.  It does, however, have an extensive operation for monitoring the actions of those involved to ensure to the US government that strict trading rules exist and are being followed.

Conclusion

From their humble beginnings in Chicago in the 1800s, commodities markets have become sophisticated places for successful traders to invest in futures and options. Combined with online futures trading, commodities markets are prepared to take investors from the past into the future.

Candlestick Charts Provide a Huge Advantage to Technical Analysis

Candlestick charts provide huge amounts of information.

Candlestick charts allow an investor to develop trading strategies that maximize profit potential. Unlike bar chart that illustrate what price movements did during a specific time frame, candlestick charts reveal ‘how’ that price moved. Candlestick charts demonstrate what investor sentiment was doing during the time frame and how it did it. This additional information creates a huge advantage for the candlestick investor. Although a price may have been up on the day, the candlestick chart will reveal whether a specific candlestick signal had been formed.

This information becomes valuable for projecting a reversal or a continuation of a trend.  The simple logic that is built into candlestick charts makes the evaluation for trade entry and exit strategies much easier to execute.  For example, a candlestick chart that reveals a price that closed higher on the day in an overbought condition may not have any relevance to somebody that does not  recognize a candlestick signal. However, if that price, during that day, had been much higher but closed near the lower end of the trading range, it may still appear as a positive day to somebody using bar charts or just reading the results of the day from the Wall Street Journal. Utilizing a  candlestick chart would reveal a different story.  A Shooting Star signal would have formed, providing a completely different scenario.

When the major signals appear  on candlestick charts, an investor can prepare for when they get in and out of trades with a much more clear analysis.  Being able to execute trades at an early stage of a reversal keeps an  investor from having to  execute less favorable trades when a trend is already in motion, trying to sell when the buyers are stepping away.  Candlestick charts produce the evaluation graphics that allow an investor to make decisions instantly.

Market Direction

What are the markets telling us? Both the Dow and the NASDAQ have been in the overbought conditions for the past few weeks.  The Dow has now reached the obvious resistance level at the 10,700 level.  The past three days of trading have demonstrated spinning tops.  This indicates indecision occurring at an important technical level.

Stochastics are now in the process of turning down.  As of yet, the selling has been indecisive.  Two scenarios can be put forth upon seeing this type of market condition.  The spinning tops could be illustrating the prelude to a pullback.  That will be confirmed by a long bearish candle in the next day or so. This would give a clear indication that the spinning tops were a reversal action. If the next few days show more spinning tops, doji, or other indecisive trading formations, without confirming signals, hold off on your trade.

Stock Trading Plan – Big Profits With Candlestick Signals

Every investor should have a stock trading plan, especially going into a new year of investing. The development of the next year’s stock trading plan should include the evaluation of the previous year. Specific sectors moved very well during 2005. The energy stocks for example. Analyzing what sectors or industries could have strong moves in the coming year is like shooting in the dark. However, simple sectors scans utilizing candlestick signals reveal which sectors/industries appear to be bottoming out and starting an upward trend. Assuming that some sectors will perform well after other sectors have performed well provides a smaller universe for watching for candlestick buy signals. It can be easily assumed that if mail order catalog companies or online companies are seeing dramatic increases in sales, then the transportation/delivery industry could be expected to perform better.The candlestick charts reveal when new dynamics enter a sector.

When developing a successful stock trading plan, some mild preplanning should be put in place. Although the candlestick signals will identify specific sectors that are starting to perform well, having some anticipation of what those sectors might be helps confirm establishing positions in those sectors when the signals do appear. Always keep in mind that prices move based upon the perception of changes in fundamentals. Currently, confidence is coming back into the electronics industries. This may fall in line with the concept that technology is starting to advance at a very rapid pace.

The most successful stock trading program for 2006 may be a two faceted approach. Candlestick signals can be utilized for identifying the sectors that will make the biggest moves this coming year. Also, they will identify the individual stocks that announce product advances which may not only dramatically change their own fundamental capabilities, but may also alter the dynamics of a whole industry.

Market Direction

The bullish signal that made itself evident on the first day of trading this year has produced very strong profits in the portfolio. Having the ability to visually witness what investor intentions were from the first day of trading created an opportunity to be investing aggressively, the portfolio positioned all to the long side. Knowing the truisms found in candlestick analysis has produced some very large gains in positions. The longer a trend continues, the more confident the average investor will exhibit. Where do most investors buy? They get more confident at the top. Does this imply that the top is getting close? Not necessarily, but the effects of continued confidence can be seen from candlestick chart patterns that revealed the buyers coming in early and continuing their buying. That can be clearly witnessed in a couple of our recommendations.

DTPI has been in a slow and steady uptrend for over a month before it was finally discovered by an analyst to recommend it. Candlestick signals alerted investors to start buying, if they did not get in at the $6.50 level, at the $7.50 level or the $8.00 level. CRYP was identified as a buy in mid-December and created another buy signal at the first of January. IIJI is another chart pattern that is revealing strong potential to the upside, a fry pan bottom forming off the 50 day moving average.

Stock Trading Plan, DTPI

DTPI

Stock Trading Plan, CRYP

CRYP

Stock Trading Plan, IIJI

IIJI

Will candlestick signals always find the best trade situation? They will greatly improve your chances of gaining big profits when you learn them and always apply them with your stock trading plan!