Stock Market Home Study Course – Trading the Two Crows Candlestick Pattern

An investor looking for a stock market home study course is looking for investment training that is simple to understand and easy to implement. Many a stock market home study course does not fulfill that criterion. Investors do not have a firm grip on the information being conveyed. Further expensive training courses are required. A stock market home study course that is simple to understand is the training course for learning candlestick signals. Candlestick signals provide one very simple element. They are  visually easy to recognize. The main facet for a stock market home study course should be being able to implement the investment training to successful investing without a multitude of additional courses. Candlestick signals and candlestick analysis utilizes common sense investment practices put into a graphic depiction.

The Japanese Rice traders have produced a number of reversal signals that have proven themselves successful over the past for centuries. The results of the signals are statistically proven. Not by computer back testing, but with actual profitable results through the centuries. A stock market home study course should provide a proven trading program that is  not still in the experimentation process. Candlestick signals provide investors with a very clear visual format for when a price reversal is occurring. Utilizing this information becomes a simple visual analysis.

Another element of a stock market home study course should be its application in all market conditions. Candlestick analysis not only provides a trading method for finding individual stocks, it provides an analysis process for projecting the directions on the markets. The information  conveyed through the proper use of candlestick signals  produces a training platform that allows an investor to exploit profits from all market conditions. The value of any stock market home study course is directly related to the effectiveness of the information provided. Candlestick signals provide high probability investment situations. Learn how to use the signals correctly and you will understand how the professional investors think. You’ll be able to exploit profits from the reoccurring emotional trading where most investors lose money.

There are 12 major candlestick signals. Learning those signals well will provide more investment knowledge than most investors will understand in their lifetimes. The remaining candlestick signals are not so important that they need to have a lot of time and effort spent on learning what they mean. However, being able to recognize the signals allows an investor to come back to a reference and get more information on what that signal is conveying. The Two Crows Pattern is part of our trading articles for Candlestick Secondary Signals. While these signals are considered ‘secondary’ it does not negate the effectiveness of their strong trading potential. They are called ‘secondary’ because they do not appear as frequently as The Major Candlestick Signals.

Two Crows Candlestick Pattern

TWO CROWS PATTERN

Description

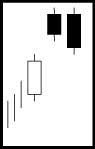
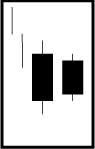
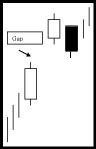
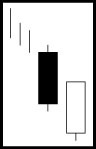
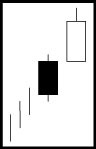
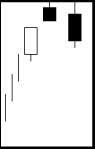
The Two Crows Pattern is a 3-day pattern. It is only a top-reversal pattern. Like the Upside Gap, the Two Crows is a gap pattern, created between the long white candle at the top of an uptrend and the small balck candle at the second day. The black candles gaps open and pulls back before the end of the day. Even though it has pulled back, it did not fill the gap. The third day opens in the body of the small black candle. The Bears maintain the control and move it lower. They are able to fill the gap and close the price within the white candle body. The gap being filled so quickly eliminates any expectations from the bulls.

Criteria

  1. A long white candle continues the uptrend.
  2. The real body of the next day is black while gapping up and not filling the gap.
  3. The third day opens within the second day’s body and closes within the white candle’s body. This produces a black candle that filled in the gap.

Signal Enhancements

  1. If the third day were to close more than halfway down the white candle, it would form an Evening Star Pattern.

Pattern Psychology

After a strong uptrend has been in effect, the atmosphere is bullish. The price gap opens but cannot hold the gains. Before the end of the day, the bears step in and take the price back down. However, the gap up from the white candle was not filled. The next day, the price opens slightly higher, within the body of the previous black candle. The bulls aren’t as boisterous and cannot keep the momentum going. Prices head lower and closes in the white candle range. The gap up from the bullish exuberance of the previous day is very quickly wiped away. The further the third day closes into the white candle body, the more bearish the implications.

Options Trading Plan – Mapping Out A Successful Future

Do you know the way to San Jose? The writer of this song seemed to be a little confused about where he was going. The same problem occurs in the commodities trading when investors decide to begin options trading without an options trading plan. It takes a great map to complete a long journey; this is also true in the options market when your trading rules help you to create a successful options trading plan.

What Is An Options Trading Plan?

An options trading plan is similar to a stock trading plan; it lays out the “terms and conditions” for making options trades. By establishing your options trading plan before you enter the market, you can unemotionally identify the types of investment strategies that you will employ and the trades that you will implement. Doing this before you begin trading will protect you from the emotions that will grab you in the heat of the moment. Why is this important? It makes no difference if your trading is going well or poorly, there is a tendency to react emotionally. Emotions are a great thing normally, but they are of little help when you are making major money decisions with your investments. Some things you might want to include in your options trading plan are:

  • Initial Investment – This is important not only from the prospective of your options trading plan, but from a personal one as well. The good news is that options trading can be started with a very small amount of investment. While it is safer to start with the largest possible pool of risk capital, successful trading can occur with a small amount due to the limited risk nature of most options trading. For example if an investor starts out only buying calls, the potential of gains is hypothetically limitless while the possibility of loss is limited to the premium you paid for the call.
  • Risk Capital – This rule is similar to investing in the stock market; your initial investment shouldn’t only be considered the amount you are willing to invest but the amount you are able to lose. This is the reason it is called “risk capital”. Risk capital is a sum of money you can financially bear to lose jeopardizing your standard of living. Not only should you be able to lose this money, you feel comfortable investing it as well. Think of your trading account as a business investment. It’s a fact of life that many businesses fail. If you aren’t afraid of losing your money you are more likely to make sound options trading plans.
  • Step by Step Plans – Each trader needs a well-defined strategy in their options trading plan pertaining to the actual buying and selling decisions. Some people are very disciplined and able to remember the general principles of defensive investing while others need a plan for every scenario possible. It is better to define everything so that you have a quick guide if you are unsure or confused. Also you should be honest with yourself and evaluate your tendencies. This is not a character assassination; this is your chance to make a commodity trading plan that protects your investment, so be thorough and honest.
  • Stop loss plans – While options and futures trading can have very limited risk, it always has risk. It’s doubtful that you want to think about losing money but now is the time to consider it. There are techniques that you can include in your options trading plan such as selling short that you need to understand before entering the market. These techniques will become part of your stop loss strategy so you need to understand them completely.
  • Technical analysis – This is the backbone of any options trading plan. Through charting and research, an investor has the best view of which direction a stock is heading and why. Committing to a trading system like Japanese Candlesticks is invaluable to accomplishing your technical analysis due to its powerful charting principles.

Conclusion

These rules outline the things that are important in an options trading plan and everything else that you include must recognize these principles. With this options trading education, you are establishing your options trading plan so that you can be both educated and successful in options trading.

Hot Stock Market Picks Are Better Identified When Using Candlesticks Signals

What is every investor looking for? Hot stock market picks!!! Everybody wants to find the stock that is going to make them wealthy. Hot stock market picks is the Golden Goose that all investors try to find. Is there a system for finding hot stock market picks? Not really, but one of the best investment tools for finding the hot stock market picks is candlestick signals. The signals do not necessarily identify  hot stock market picks, they simply put  investors into positions that have a high probability of producing big-profit moves.

Candlestick signals identify where money is flowing into and out of stocks/sectors. Being able to identify and understand the investor psychology that creates the candlestick signals produces a huge advantage. It allows an investor to participate in stock investments that have an extremely high probability of moving in the right direction. The signals are created by common sense investment practices. Trying to identify  hot stock market picks is a long shot. However, utilizing candlestick signals dramatically increases the probabilities of being in a strong price move. The signals have been developed through hundreds of years of visual analysis. When investor sentiment starts turning, the Japanese Rice traders identified the signals that illustrated the change.

The point of investing is to put investment funds into situations that have the highest probabilities of making money. Will there be failed trades? Of course, and the candlestick signals reveal when to get out of those trades very quickly. Will candlestick signals put investors into  hot stock market picks? The candlestick signals do not identify the hot stock market picks, they put investors funds into trading patterns that increase the probabilities of participating in big price moves when they occur. Utilizing the signals correctly will dramatically improve the probabilities of being in the right place at the right time. Use to your advantage. Learn the 12 major signals well and you’ll understand why prices move. Be aware of the secondary signals because they can also produce the evaluation of whether to get in or stay in positions.

Upside Gap Two Crows

Trading the Upside Gap Two Crows Pattern

Description

The Upside Gap Two Crows is a three-day pattern. The upside-gap is created between the long white candle at the top of an uptrend and the small black candle of the second day. The black candle gaps open and pulls back before the end of the day. Even though it has pulled back, it did not fill the gap. The third day opens above where the first black candle opened. It can not hold at these levels and pulls back before the end of the day. Closing lower than the previous day, it has engulfed the small black candle’s body. However, it still did not close the gap from the white candle.

Criteria

  1. A long white candle continues the uptrend.
  2. The real body of the next day is black while gapping up and not filling the gap.
  3. The third day opens higher than the second day’s open and closes below the second day’s close. This produces a black candle that completely engulfs the small black candle.
  4. The close of the third day is still above the close of the last white candle.

Pattern Psychology

After a strong uptrend has been in effect, the atmosphere is bullish. The price gaps open but cannot hold the gains. Before the end of the day, the bears step in and take the price back down. However, the gap up from the white candle was not filled. The next day, the bulls try again; they open the price higher than the open of the previous day. Again, they cannot hold the price up. It backs off and closes lower than the previous day. This now has taken all the steam out of the bulls. At this point, you will want to see the bears really stepping in the next day to confirm the reversal. (This pattern is not as bearish as the Two Crow Pattern)

The Hanging Man Signal

Learning how the stock market works for novices is a difficult process. The first  thing an investor should learn is the basics of why prices move.  Unfortunately, the new investor can be overwhelmed with stock trading advice.  Most of that advice does not teach an investor how to  utilize human emotions.  The candlestick signals, especially the 12 major signals, involve the visual elements produced by human emotions.  Being able to correctly analyze what these emotions are doing at specific points of a trend becomes a valuable tool for successful investing Learning how the stock market works for novices is an endeavor that most investors never master.  Learning how the stock market works for novices involves controlling one’s emotions.  Candlestick signals are a great benefit for the beginning investor as well as the experienced trader.  The information conveyed in the major candlestick signals is the visual depiction of investor sentiment.  Most investors sentiment unfortunately involves the extremes of human emotions, fear and greed. Learning how the stock market works for novices is an educational process.

The information incorporated into a major candlestick signal provides a huge advantage for those investors just learning how to play the stock market. Learning how the stock market works for novices should be made is simple as possible.  The results of simple visual analysis permits an investor to take advantage of high probability situations.  The major signals are created by the aspects of human emotions being put into trading decisions.  Investor psychology produces reoccurring thought processes as investors go through different stresses of a price trend.  The 12 major signals are a very important tool when learning how to play the stock market.  Understanding the investment psychology that creates each signal is an important element for understanding how professional investors think. One of the most important facets for learning how a stock market works for novices is knowing how to put the probabilities in your favor.  The candlestick signals create a format that does just that.  Hundreds of years of observations have resulted in reversal signals that are easy to identify.  When learning how the stock market works for novices, it is very important to find indicators that have a high probability of producing profits and a low probability of producing losses. This may be stating the obvious.  However, the utilization of candlestick signals is being done by a very small percentage of the investment population.  Use the major signals to start profiting from your investment decisions immediately.

The Hanging Man  produces some very important attributes when analyzing a potential reversal.  It is considered one of the 12 major signals.  Learn how to use a Hanging Man signal correctly. The probabilities of being in a correct trade when utilizing this signal becomes extremely high.

Hanging Man Candlestick Pattern

HANGING MAN

Description

The Hanging  Man  is also comprised of one candle. It is easily identified by the presence of a small body with a shadow at least two times greater than the body. It is found at the top of an up trend.  The Japanese named this pattern because it looks like a head with the feet dangling down.

Criteria

  1. The upper shadow should be at least two times the length of the body.
  2. The real body is at the upper end of the trading range. The color of the body is not important although a black body should have slightly more bearish implications.
  3. There should be no upper shadow or a very small upper shadow.
  4. The following day needs to confirm the Hanging Man signal with a black candle or   better yet, a gap down with a lower close.

Signal Enhancements

  1. The longer the lower shadow, the higher the potential of a reversal occurring.
  2. A gap up from the previous days close sets up for a stronger reversal move provided the day after the Hanging Man signal trades lower.
  3. Large volume on the signal day increases the chances that a blowoff day has occurred although it is not a necessity.

Pattern Psychology

After a strong up-trend has been in effect, the atmosphere is bullish. The price opens higher but starts to move lower. The bears take control. But before the end of the day, the bulls step in and take the price back up to the higher end of the trading range, creating a small body for the day. This could indicate that the bulls still have control if analyzing a Western bar chart. However, the long lower shadow represents that sellers had started stepping in at these levels. Even though the bulls may have been able to keep the price positive by the end of the day, the evidence of the selling was apparent. A lower open or a black candle the next day reinforces the fact that selling is going on.

When identifying the Hanging Man signal under the correct conditions, with stochastics in the overbought conditions, at the top of an uptrend, provides the information needed for identifying the possibility of a trend reversal.  When learning to play the stock market, being able to put all the probabilities in ones favor is very important.  When will an uptrend reverse?  When indications start appearing that demonstrate that the sellers are starting to take control!  The Hanging Man signal provides the elements that indicate the sellers stepping into a trend. Use this information to your advantage.

The educational process for learning to invest correctly is greatly enhanced when utilizing candlestick charts.  The information conveyed in candlestick signals is easily analyzed through candlestick formations.  Learning how to invest in the stock market becomes much easier when it can be visually analyzed. The candlestick patterns portray high probability investment situations. The candlestick investor gains huge advantages by seeing what investor sentiment is doing right now.

Training Tutorials

The Major Signals Educational Package  has over 8 Hours of training for trading Candlestick Signals or The Hanging Man individual training video available for Quick Download.

Candlestick Forum Flash Cards   These unique Flash Cards will allow you to be “trading like the Pro’s” in no time.

Return to Candlestick Explanation of the Major Signals

Currency Trading Made Easy With Candlestick Signals

Currency trading has recently gotten a new spurt of popularity with the advent of Forex trading. Currency trading has a much different dynamic than stock market trading. The major advantage of currency trading is that once a long-term trend takes hold, the trend will move in the same direction for long periods of time, for weeks and months. Candlestick signals work very effectively in currency trading. The same  investor sentiment found in stock trading is also found in the candlestick signals when analyzing currency trading.

Being able to analyze the direction of a currency dramatically improves Forex trading results. Forex trading can be broken down into very simple analytical features. The candlestick signals easily identify the direction of a specific currency trend. Due to the simple nature of candlestick analysis, being a completely visual process, the evaluation of the different currencies can easily be applied to a Forex trade. Currency trading is nothing more than exploiting the information that the candlestick signals reveal. If the dollar is moving up, and the British pound is trading down as can be identified with the candlestick signals, the Forex trade set up is very simple.

Use the information that is provided by the candlestick signals. Currency trading is a very simple process once understanding what the Japanese Rice traders projected for investor sentiment. This same  investor sentiment works on all trading entities. Understanding and identifying candlestick reversal or continuation signals helps pinpoint the optimal times to buy and sell. Understanding the investor sentiment that creates the candlestick formations allows an investor to project the direction of specific currencies against each other.

Join us each week in our live internet stock chat as we continue our free training on Trading with Japanese Candlesticks. This week’s article introduces the “In Neck Line” a Bearish Continuation Pattern.

In Neck Line
IN NECK LINE
(iri kubi)

Description

The In Neck pattern is almost a Meeting Line pattern. I t has the same description as the On Neck pattern except that it closes at or slightly above the previous day’s close. Confirmation is suggested. The In Neck Line indicates some short covering, but not a change in trend direction.
 
Criteria

  1. A long black candle forms in a downtrend
  2. The next day gaps down from the previous day’s close; however, the body is usually smaller than one seen in the Meeting Line pattern.
  3. The second day closes at the close or just slightly above the close of the previous day.

Pattern Psychology

This is the same scenario as the On Neck pattern. After a market has been moving in a downward direction, a long black candles enhances the downtrend. The next day opens lower, a small gap down, but the trend is halted by a move back up to the previous day’s low. The buyers in this up move should be uncomfortable that there was not more strength in the up move. The sellers step back in the next day to continue the downtrend.

Back to Continuation Patterns

Candlestick Forum Flash Cards   These unique Flash Cards will allow you to be “trading like the Pro’s” in no time.

Stock Market Investing Guide Should Incorporate Candlestick Signals

What is the best stock market investing guide? An investment method that has common sense investor intelligence built in. This is exactly what the candlestick signals provide. Most investors do not have a stock market investing guide. They will try anything that promotes high profit results. They move from one technique to the next not ever finding an investing technique that works. What should be used as a stock market investing guide? A technique that is proven. A technique that can be easily learned.

A technique that once you have learned it, can be applied to any trading market or any market conditions.
Candlestick signals are the cumulative knowledge of everybody that is buying and selling a trading entity in a specific time frame. The Japanese Rice traders not only identified the change of investor sentiment in a trend, being able to pinpoint the reversals of a trend, they also learned what the investor sentiment was doing to create that reversal. This information becomes very powerful for the investor. If an investor has a stock market investing guide that not only illustrates when to buy and when to sell, but also educates the investor as to why they are buying and selling, this provides the knowledge to successfully trade any market.

Learn how to use candlestick signals correctly. Having the ability to understand why the signals work creates the investment knowledge to give an investor full utilization of their investment abilities. The major signals have powerful implications. The secondary signals also provide valuable information. Using the signals as a stock market investing guide will provide a comprehensive investment format. An investor can apply candlestick signals as the basis for any other trading technique. Learning the candlestick signals allows the investor to gain insights into market trends that are not available with any other trading techniques.

This week’s signal – Trading the Belt Hold Pattern – Reversal Signal

Belt Hold Candlestick Pattern

BELT HOLD

The Belt Hold  lines are formed by single candlesticks. The Bullish Belt Hold is a long white candle that has gapped down in a downtrend. From it’s opening point, it moved higher for the rest of the day. This is called a White Opening Shaven Bottom or White Opening Maruboza. The bearish Belt Hold is just the opposite. It is formed with a severe gap away from the existing uptrend. It opens at it’s high and immediately backs off for the rest of the day. It is known as a Black Opening Shaven head or Black Opening Maruboza. Yorikiri, a sumo wrestling term, means pushing your opponent out of the ring while holding onto his belt. The longer the body of the Belt Hold, the more significant the reversal.
 
Criteria

  1. The  candlestick body should be the opposite color of  the prevailing trend.
  2. It significantly gaps open, continuing the trend.
  3. The real body of the candlestick has no shadow at the open end. The open is the high or low of that trend.
  4. The length of the body should be a long body. The greater the length, the more significant the reversal signal.

Signal Enhancements

  1. The longer the body, the more significant the reversal pattern.

Pattern Psychology

After a strong trend has been in effect, the trend is further promoted by a gap open, usually a large gap. The opening price becomes the point where the price immediately moves back in the direction of the previous close. This makes the opening price the high or the low for the trend. This causes concern. Investors start to cover shorts or selling outright. This starts to accentuate the move, thus reversing the existing trend.

Candlestick Forum Flash Cards   These unique Flash Cards will allow you to be “trading like the Pro’s” in no time.

Return to Candlestick Explanation of the Major Signals

Predicting Stock Market Trends

Why is it so difficult to predict stock market trends? Just look at two of the ‘indicators’ some investors use for predicting stock market trends.

Some people put their faith in the “January Barometer”. A theory that the movement of the S&P 500 during the month of January sets the stock market trends for the year. If the S&P 500 is up at the end of January compared to the beginning of the month, expect the stock market to rise during the rest of the year.

Another prediction of stock market trends is based upon the Super Bowl indicator. An ‘urban legend”; claiming that if the winning team is from the AFC there will be a down market and if the winning team is from the NFC expect an up market.

Now if this isn’t proof that stock market trends are based upon human behavior, I don’t know what is. Stock market trends are nothing more than the shifting of investor optimism. Since investor optimism is an expression of human emotion, it makes sense that we find clues in stock market trends by observing candlestick patterns.

Japanese Candlesticks is the best technical indicator for predicting stock market trends. The Candlestick Forum helps investors recognize stock market trends by explaining how human weakness creates conditions resulting in predictable patterns. Candlestick signals visually illustrate investor sentiment, as the Homing Pigeon reversal pattern below.

Homing Pigeon

HOMING PIGEON

Description

The Homing Pigeon is the same as the Harami, except for the color of the second day’s body. The pattern is composed of a two-candle formation in a down trending market. Both candles are the same color as the current trend. The first body of the pattern is a long body, the second body is smaller. The open and the close of the second day occurs inside the open and the close of the previous day. Its presence indicates that the trend is over.

Criteria

  1. The body of the first candle is black; the body of the second candle is black.
  2. The downtrend has been evident for a good period. A long black candle occurs at the end of the trend.
  3. The second day opens higher than the close of the previous day and closes lower than the open but above the closing price of the prior day.
  4. Unlike the Western Inside Day, just the body needs to remain in the previous day’s body; where as the Inside Day requires both the body and the shadows to remain inside the previous day’s body.
  5. For a reversal signal, further confirmation is required to indicate that the trend is moving up.

Signal Enhancements

The higher the second candle closes up on the first black candle, the more convincing that a reversal has occurred.

Pattern Psychology

After a strong downtrend has been in effect and after a long black candle, the bulls open the price higher than the previous close. The shorts get concerned and start covering. The price finishes lower for the day but not as low as the previous day. This is enough support to have the short sellers take notice that the trend has been violated. A strong day after that would convince everybody that the trend was reversing. Usually the volume is above the recent norm due to the unwinding of short positions.

 Candlestick Forum Flash Cards  

These unique Flash Cards will allow you to be “trading like the Pro’s” in no time.

Return to Candlestick Explanations

Ninja Trader Partners with Stephen Bigalow and Candlestick Forum

Ninjatrader

NinjaTrader is the preferred active trader platform for traders worldwide including our clients.  We are pleased to offer NinjaTrader to our clients for many reasons but one great reason is that you can get started with NinjaTrader for Free!  Why pay hundreds of dollars per month for products with less functionality when with NinjaTrader all you need is access to a real-time or historical data feed. 

You can also connect NinjaTrader to Kinetick, our preferred market data service, for free End-of-Day data!  Download NinjaTrader Now

NinjaTrader provides superior order entry options!
If you are using the wrong trading platform, order submission and trade management can be a timely and error prone process.  Since 2003, NinjaTrader has pioneered easy to use yet powerful order entry and trade management functionality to overcome the limitations of other trading platforms helping our clients better achieve their trading goals!

The innovative NinjaTrader SuperDOM and Chart Trader set the benchmark for order entry screens and is one reason we recommend it to our clients.   Considered the industry’s best order entry screens they provide traders with ease of operation, clear trade visualization and fast entry to capitalize on today’s markets. 

Dom

SuperDOM

Easy to see trade visualization
Single click order entry, modification  and cancellation
Can be use with Advanced Trade Management (ATM) module

Chart Trader

Chart Trader
Easy to see trade visualization on the chart
Single click order entry, modification and cancellation from the chart
Can be used with Advanced Trade Management (ATM) module

Chart Trader

NinjaTrader is the industry leader in trade management features!

Advanced Trade Management (ATM) is NinjaTrader’s signature order management technology that lets you pre-define personal trade management strategies including; multiple profit targets and stop loss orders, one-cancels-other (OCO) orders, auto-breakeven stops, trailing stops and much more.  This feature can significantly enhance trade performance by automatically submitting all entry/exit orders within milliseconds!  This feature alone tends to cover the cost of the platform while simultaneously lowering your stress level by eliminating the “deer in the headlights” feeling commonly associated with manually managing multiple exit orders in fast moving markets.

ATM entry box

Easily specify multi-stage exit parameters
Single check box to create an auto break even stop
Highly configurable and easy to use auto-trail stop

ATM Strategy

Utilize NinjaTrader’s comprehensive market analytics tools to help find trading opportunities!

Regardless of what markets you trade, what style of trader you are or if you require real time or end of day analytics, the NinjaTrader trading platform provides you the tools to analyze the markets and your trading ideas in a flexible, customizable and user-friendly manner that helps you trade better.

Charting

  • Powerful market visualization
  • Multi-time frame and multi-instrument analysis
  • Over 100 pre-built customizable indicators plus 100s of optional 3rd party indictors

Chart for Ninjatrader

Other Analysis Tools

  • Trade performance tool
  • Market Analyzer
  • Strategy analyzer

Automate and customize your trading!

Take your trading to the next level through custom development and trade automation!   NinjaTrader provides you with the ability to automate your trading strategies whether they were developed natively using NinjaScript® or in an external application such as TradeStation.

Automated and Custom Trading

  • Develop or purchase automated trading strategies
  • Analyze automated trading strategies
  •  Execute automated trading strategies
  • Process Trading signals from external applications
  • Create or purchase 3rd party custom charting indicators

Choice of Market Data Services and Broker Connectivity Options

NinjaTrader is a broker independent trading platform so you have choice on where you can execute your trades. NinjaTrader supports all leading independent market data service providers including Kinetick, our preferred market data service. Paper trade and do your analysis with real time data without having to pay a single penny for software!

NinjaTrader is committed to providing Education and Support

Our team is technically familiar with NinjaTrader and provides basic client assistance.  The NinjaTrader team however is deeply versed in all aspects of platform operation and can be easily accessed through email or their support forum.  Their dedicated team of twenty plus client support specialist are at the ready should you ever need platform assistance.  In addition, NinjaTrader provides daily educational webinars and a complete context sensitive online user’s manual interlaced with many product videos to minimize your platform learning curve.

Education and Support

  • Free daily NinjaTrader training webinars
  • Media rich help guide
  • Video library
  • Active user community

Download NinjaTrader Now


Selling Puts – Bullish Options Trading Strategy

Selling a put is very similar to a covered call, only with a slightly different perspective. When you write a covered call you are speculating that the stock will go up or stay the same. With a covered call, you must own the stock, so your risk is losing money to a falling stock. In order to make money with a covered call, you need for the stock to go up, or even sideways. Learning the technique of selling puts is a valuable step in becoming a successful trader.

Selling a put, however, does not require you to own the stock in advance. This is the beauty of playing the stock market by selling puts. You can sell puts on margin; although it is necessary to research the margin requirements carefully. For put selling, margin requirements vary from broker to broker. When you sell puts, the “premium” collected for the trade is deposited into your account on the day your trade is entered into.

There are a number of different reasons why you might want to sell a put on a stock. As mentioned earlier, with a covered call, it is necessary for the stock to go up or sideways to realize a profit. When selling a put, it is possible to make money investing in stock several different ways, including when the stock is going down.

These ways are:

  1. If the stock goes up, your put expires and you earn the premium.
  2. If the stock stays flat, your put would also expire, leaving you to earn the premium.
  3. If the stock drops less than the difference of the selling price and the put, you would again earn the premium.
  4. If the stock shows a weakness that you consider temporary, you can “buy back with a roll out”. This means that you buy back your option, and then sell the put for the next month. This essentially buys you extra time for your stock to move positively. The entire process would move out one month and the same parameters. This is a key benefit in being able to perform stock technical analysis. By learning how to read stock charts, an investor is better able to predict unfavorable movements in a stock and react.
  5. Finally, you can use marginable stocks in your portfolio to sell puts on additional stock which you can purchase below the current market price.

Once again, while there are a number of ways to earn money selling puts, and two primary ways to lose money. First, if you hold a weak stock past its strike price and sell, you actually create a situation where you lose on your investment. Second, is that someone will “put” the stock to you at the put price. If your stock drops below the put price, minus premium, and someone puts the stock to you, you will lose money. This can be avoided with a “buy back with a roll out” or a simple buy back on your option. As you might expect, a sound investor takes care to close positions before being put to minimize the risk; this is a basic concept of learning to invest in the stock market.

Selling puts is a great way to accumulate stocks for a discounted price. This is a strategy that can potentially be used with your IRA to form a plan for long term investing. Many IRA underwriting companies may not allow you to do this; the IRS and SEC have deemed such a practice to be a suitable way to invest in your IRA.

Return to main Options Trading Category

Continuation Patterns Found In Candlestick Charting

Most Candlestick signals are reversal patterns; however, there are periods of trends that represent rest. The Japanese insight is, “there are times to buy, times to sell, and times to rest.” Once a pattern is recognized, it is suggesting a direction for future price movements. Continuation patterns found in candlestick charting help with the decision-making process. Whatever the pattern, a decision has to be made–even if the decision is to do nothing.

Learning the continuation patterns found in candlestick charting has important features. In some cases, differences between reversal patterns and the continuation of a trend can be subtle. Candlestick Charting provides the knowledge of how minor price variations can affect the direction of a trend can lead to enhancements of profits. As the candlestick charts are studied, recognizing the differences will greatly alter investment strategies.

For easier reference, continuation patterns found in candlestick charts have a section of their own. Each week we will select a continuation pattern and break it down into detail with the description, pattern criteria, and pattern psychology from the list below.

UPSIDE TASUKI GAP

Upside Tasuki Gap

Pattern Description with criteria and Pattern Psychology

DOWNSIDE TASUKI GAP

Downside Tasuki Gap

Pattern Description with criteria and Pattern Psychology

ON NECK LINE

On Neck Line

Pattern Description with criteria and Pattern Psychology

IN NECK LINE

In Neck Line

Pattern Description with criteria and Pattern Psychology

THRUSTING

Thrusting

Pattern Description with criteria and Pattern Psychology

FALLING THREE METHOD

Falling Three Method

Pattern Description with criteria and Pattern Psychology

RISING THREE METHOD

Rising Three Method

Pattern Description with criteria and Pattern Psychology

SIDE-BY-SIDE WHITE LINES

Side by Side White Candles

Pattern Description with criteria and Pattern Psychology

SEPARATING LINES

Separating Lines

Pattern Description with criteria and Pattern Psychology

MAT HOLD

Mat Hold

Pattern Description with criteria and Pattern Psychology

THREE-LINE STRIKE

Three Line Strike Small

Pattern Description with criteria and Pattern Psychology

UPSIDE GAP THREE METHOD

Upside Gap Three Method

Pattern Description with criteria and Pattern Psychology