Diversifying a Stock Portfolio

What is meant by diversifying a stock portfolio? Why do it? How does an investor diversify? Diversifying a stock portfolio is an investment strategy where the investor chooses investments that react differently to varying conditions in the stock market and market sectors. Investors diversify their investments to reduce investment risk. A basic method of diversifying a stock portfolio is to choose five stocks in five different market sectors. Ideally the various market sectors and the stocks react differently at the various points in the business cycle.

By choosing stocks with different characteristics, diversifying a stock portfolio spreads out the risk of investing. Ideally the investor chooses stocks in such a way that when one stock, such as a manufacturing company is hurt by higher interest rates, and drops in stock price, another, a bank charging higher interest rates, will see the price of its stock shares go up. In diversifying a stock portfolio the point is not just to pick stocks that will balance each other but picking stocks in more than one potential area of growth and profit. Buying stocks in computer technology, biotech, big oil, consumer goods, and financials not only reduces the investor’s risk of a huge loss if one company has problems but it offers opportunity for growth in a wider arena.

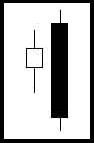
Diversifying a stock portfolio can be fairly simple and it can be immensely complicated with lots of charts, formulas, and the like. A good rule of thumb for beginning investing in the stock market is to keep it simple. A good practice is to buy stock in no more than one company to start with. In fact, smart stock market investing for a beginner would be to pick one stock at a time and stop at five. Diversifying is to reduce risk but fundamental analysis, value investing, and using tools such as Candlestick basics to find currently low prices in good stocks are necessary to find the best individual stocks.

Unless the investor is a professional who devotes all of his or her day to investing and stock trading there is only so much time to devote to following stocks in a portfolio. Five stocks is typically a sufficient number for diversifying a stock portfolio and not too many to keep track of with tools such as Candlestick analysis at least once a week. Five stocks are usually not too many for keeping up with the stock market news as it applies to each stock and its sector of the stock market. More complicated stock portfolio diversification has its place with institutional investors managing huge portfolios. For the beginner, keeping it simple is the best choice.

Diversifying a stock portfolio need not be limited to picking five different stocks. The investor can also choose to invest in the futures market, the commodity market, and foreign currency trading as well as basic stocks and bonds. As with all investing and trading, success has to do with an adequate knowledge base, well practiced, attention to detail, and sufficient time in the work day to accomplish what needs to be done. Although there is potentially no limit to how much an investor can manage portfolio diversification (and life) there always comes a point where keeping it basic and simple works as well or better than excessive variety and detail.


Market Direction

When the markets start moving in a whipsaw motion, where is the best place to have your funds? In cash! The purpose for using any analytical tool is to gain an advantage. The advantage of candlestick analysis is being able to assess what is occurring in investor sentiment. The utilization of that information is what puts the probabilities greatly in the candlestick investor’s favor. However, in market conditions, as we have seen over the past three days, has made it very difficult to analyze what is occurring in investor sentiment. When that is the case, there is no investment advantage. Put the money in cash for a few days until the market trends can be better analyzed.

Currently the Dow is still trading below the 50 day moving average but it closed just above the T-line. This produced a strong hammer type signal today. The NASDAQ formed a belt hold type signal today. Although both indexes are trading below the 50 day moving average, the volatile buying and selling of the past few days still provides indications of a J-hook pattern setting up.

Diversifying a Stock Portfolio, Dow

DOW

Diversifying a Stock Portfolio, NASDAQ

NASDAQ

What   does the whipsaw action do to the portfolio? Using the Japanese Rice traders philosophy that you do what the market is telling you to do, it can create small losses by being in and out of the market based upon getting stopped out. However, this is exactly the function of using candlestick signals and logical stop loss placement. There will be times when the market moves erratically. There is no way to analyze ahead of time for that type of market action. It has to be anticipated there will be times when positions will get whipsawed. Fortunately, the whipsaw action of the market can be a set up for another strong price move. The small losses produced during the whipsaw actions will be well made up for by being prepared for the next market move.

As is illustrated in both the Dow and the NASDAQ charts, the ‘open’ of tomorrow’s trading will be very important for the analysis of the market trends. Lower opens will still indicate resistance at the 50 day moving average. A strong open would indicate a J-hook pattern is in progress. Whichever way the market opens, it  will be a very clear signal for which direction to be investing. This analysis is made easy utilizing the if/then aspects of candlestick signals.
Chat session tonight at 8 PM ETTina Logan will be the guest speaker. Her emphasis tonight will be on utilizing the information built into double bottoms.

Good Investing,

The Candlestick Forum Team

Agricultural Commodities

Trading agricultural commodities is the province of agricultural producers and the likes of multinational grain companies. It is also the province of traders speculating on movements in the agricultural commodities markets. Both groups trading commodities rely upon fundamental analysis of the commodity in question and engage in technical analysis using technical analysis tools such as Candlestick chart formations in order to judge when to stay with a market trend and when to expect a market reversal. The world needs food but growing conditions, food transport and storage, and diversion of food stuffs into energy all affect availability and, therefore, commodity price. This mixture of facts and conditions drives pricing in the futures markets in agricultural commodities. Whether you are interested in trading corn futures or live cattle Commodities and Futures Training will be a good place to start.

The Traders

When you start commodity trading you will be up against the likes of traders working for companies like Cargill and Archer Daniels Midland. These multinational food companies know the fundamentals of the agricultural commodities markets as it is their business. They will, in fact, know fundamentals before you do. Although their advantage may only be minutes or even seconds they will cause market movement to which you will have to react. They are typically the drivers of the commodities markets in wheat, corn, soybeans and other products. You will be in the pack with other traders doing Candlestick analysis to predict market reaction to the trades made by the big money.

Why They Trade

There are two types of traders in agricultural commodities. There are the producers and the buyers who are hedging commodities and their investment risk. There are traders looking to profit on market movement. Farm cooperatives growing sugar beets and sugar producers who buy sugar beets or cane each buy or sell commodities futures contacts to lock in price at a future date. Because these folks know the market in their commodity they may well also trade for profit but their primary motive is to maintain a stable price for their product. The trader speculates on market movement and market reversal in looking to profit. The producers and buyers want a stable market. The pure trader would like to see lots of market volatility.

Why You Trade and Market Participation

When a farm cooperative has locked in what they consider a fair price for their sugar beets, corn, soy beans, etc. they will probably go back to the work of farming. Thus their strategy will be to make a single or single set of trades. When they are done trading volume in a commodity may go down if the producers and buyers are satisfied. Traders who are not in the business of the commodity may well keep tracking the commodity looking for market movement based upon news about the weather, new buyers, etc.

Deep Pockets, Strategy, and Cows on Your Lawn

Buying calls and buying puts on agricultural commodities is entirely possible. Typically the trader buys and the large company sells. Selling calls and puts is typically more profitable over time but can be costly on a single bad trade. Having deep pockets allows the big guys to do this while you leverage smaller holdings for potential large profit. You really want to get out of your futures position in agricultural commodities if you are not a producer or buyer. They will not come to your house and leave cows on your lawn but they will ask you to produce cows to sell or come and get them unless you exit your contract before expiration.

Market Direction

Utilizing candlestick signals allows an investor to start with a format where the probabilities can constantly be improved. This current uptrend clearly illustrates how  using candlestick signals and other obvious analytical tools keeps an investor from being whipsawed in and out of positions. The basic rule, that a sustained uptrend requires a compelling reversal signal to indicate a trend reversal, has made this uptrend very profitable. Although there have been times that it appeared that investor sentiment may have changed, the simple combination of a candlestick sell signal AND a close below the tee line has not occurred.

Thursday’s trading produced a trading day that might have scared people out of the market, especially with the early trading well below the tee line. The obvious evaluation factor has been the trend moving up, consistently closing above the tee line. Take advantage of the information built into each candlestick daily formation. That information allows for decently accurate trend analysis. As long as the markets do not close below the T-line, the uptrend remains in progress. This may sound very simplistic but that is the result of the common sense aspects of candlestick analysis.

FCapril26
DOW

The tee line also becomes an excellent buying factor. There are candlestick patterns that can execute a trade immediately based upon a candlestick signal and a breach above the tee line. Today, May Feeder Cattle was bought based upon an Inverted Hammer signal on Friday. A positive open produced three results. First was the confirmation of the Inverted Hammer signal. Second, the positive open would be confirming trading above the tee line. Third, it would be setting up the possibility of another J. hook pattern.

Agricultural Commodities, May Feeder Cattle

May Feeder Cattle

The more indicators that can be put into alignment, the higher the probability of being in a correct trade at the correct time. Whether you are a beginning investor or a seasoned trader, candlestick signals work extremely well on their own or being applied to existing trading programs.

I mention how candlesticks improve the visual aspect of already successful trading programs because of my experience presenting candlestick analysis this weekend to the annual conference of the AAPTA. This association consists of some of the most high-powered names associated with technical analysis. John Murphy, Greg Morris, Bloomberg associates and many other nationally known technical analysts attended this conference. I felt my presentation on candlesticks was like teaching at a first grade level to college students. However, the feedback revealed that many there had not been exposed to candlestick signals in the manner which I had presented it. They could see how the information built into the signals and patterns could greatly improve what they were doing.
It was also very impressive to be associating with people that were very unselfish with the sharing of their knowledge. On top of that, everybody was very nice and a pleasure/fun to be with. Do not be surprised to see some new elements of technical analysis built into the member recommendations in the near future.

Chat session tonight at 8 PM ET.

Good Investing,
The Candlestick Forum Team


This Week’s Special

 E-Book Blowout – Over $269 in eBooks for only $129 PLUS Bonus product valued at $129 FREE!

Click here for details

Website special reflects current newsletter. If you are reading an archived newsletter you will be directed to Current Website Special.

Futures Trading – Balancing Risk and Reward

There is a paradox in futures trading; “get-rich” trading usually leads to poverty. While it is true there are many people that do get rich in futures trading, the norm is to lose. Because most investors don’t do the things necessary to be successful, they find failure is the only other alternative. This is a practice that requires training, experience and plenty of technical analysis. But, then, doesn’t all successful investing?

The Risks of Futures Trading

First, let’s back things up a bit; while futures trading can be very risky, the rewards can be very nice as well. Richard Dennis, a famed commodities trader, was able to parlay $1,600 of borrowed money into $200 million over ten years. While his results are truly extraordinary not everyone can expect the level of successful trading he achieved, there is good news for every investor; you can make money in futures trading. Now that we have made this statement, we can talk about futures trading.

Futures trading has a bad reputation as being filled with risk and, while there is risk, the truth is that futures trading is only as risky as a trader makes it. This is not the lottery or a trip to the casino; if you take a conservative approach, look for a reasonable return and make this a business, then the probability of success in commodity trading is very good.

What is Futures Trading?

Futures trading is different that investing in the stock market or bonds since you don’t actually own anything; in futures trading, you are speculating on the future direction of the price in the commodity you are trading. This is like a bet on future price direction. The terms “buy” and “sell” merely indicate the direction you expect future prices will take. He or she must only deposit sufficient capital with a brokerage firm to insure that he will be able to pay the losses if his trades lose money.

Futures trading is a sort of insurance plan for those who are trading and investing. A farmer may sell futures on his wheat crop if he thinks the price will go down before the harvest; conversely, a bread manufacturer may buy futures if they think the price of wheat is going to rise before the harvest. Regardless of the price movement, both are guaranteed their price. The final component of the equation is the investor in futures trading who looks for changes in the futures markets and seeks to gain advantages by buying or selling at a profit.

What are Futures Markets?

In addition to agriculture, there are a number of different futures markets. Among these markets are:

  • Currency trading such as the US dollar, the British pound and the Japanese yen
  • Interest rate futures on financial transactions and bonds
  • Energy Futures on oil and gas
  • Food sector on items such as coffee, sugar and orange juice
  • Metals such as gold and silver

Each futures market has producers and consumers who need to hedge their risk from future price changes. The speculators, who do not actually deal in the physical commodities, are there to provide liquidity. This maintains an orderly market where price changes from one trade to the next are small.

Is Substantial Risk Inevitable in Futures Trading?

Minimizing risk in futures trading is easy; instead of taking delivery or making delivery, the speculator merely offsets his position at some time before the date set for future delivery. If price has moved in the right direction, he will profit. If not, he will lose. Greed and fear are the enemies of futures trading and the cause of most big losses.
Futures trading is not for everyone; it possesses risks that are limitless to an uninformed, undisciplined investor. With solid trading rules and an understanding of the markets and techniques required, futures trading can be a very rewarding endeavor.

Stock Prices – How Do You React To Fluctuations?

Movers and Shakers – Influencing Stock Prices

Anyone knows who has invested in, or even watched, the stock market knows that there are a number of factors that cause stock prices to change; performance of a company, publicity for a company, news that affects the industry and numerous other factors can change stock prices either up or down. While there are a number of different factors that change stock prices, they are in one of three categories: fundamentals, sector changes or market swings. Successful traders will work to understand these influences and this understanding will help decide whether the movement says buy, sell or wait.

Fundamentals

Economic fundamentals clearly have the most direct influence on changes in stock prices. While stock chart patterns indicate that profits and revenues are on a steady upward climb and have no indication of peaking, investors will bid up a company, causing the stock prices to change as they rise to reflect the activity. In contrast, if the trends of struggling stocks show the stock as being flat or declining, it is logical to look for stock prices to change in a negative direction.

Both concepts are examples of fundamental analysis and how fundamentals can change stock prices. Other changes can occur that, subtly and in more complex manners, will affect the stock prices as well, though maybe not in such an immediately detectable way. Such factors can be increased debt, poor acquisitions, and so on that can create a long-term change in stock prices. The conclusion is that changes in the underlying business can directly change stock prices.

Sector Changes

When there are changes in a particular industry or business sector, stock prices will change to positively or negatively reflect the changes. For long term investing, it is wise to remember that some sectors are cyclical in nature and that there will be changes in stock prices that tend to be repetitive. Such a pattern can actually help investors to initiate successful trades if they are able to chart this cycle and respond appropriately.

Another factor that can change stock prices for an entire sector is when a particular industry becomes extremely popular or extremely negative. An example of both situations is the phenomenon of the Internet. Just as quickly as the sector took its companies and their stock prices soaring upward with stock price breakouts, most of them came crashing back to reality when the sector fell.

Market Swings

The old saying is, ?What goes up must come down.? As pleasant or painful as it can be, this tends to also be true of changes in the stock market. When the market is trending upward, most stock prices will change to adjust to this movement. Unfortunately, the same is also true when the market is moving downward. This becomes an opportunity for a savvy investor to use his or her stock trading system. With a system like Japanese Candlesticks, a trader can best anticipate the trends and identify times to make purchases and sales based on a stock investing system that has proven successful for more than 300 years.

Conclusion

A change in fundamentals may be an opportunity to buy more shares of a growing company or it may signal the time to sell if the changes are for the worse. A change in the sector is usually temporary so most long-term investors will ride out dips due to these factors. Assuming that there are no detectable changes in the company?s fundamental and technical analysis, a trader might be more inclined to follow his regular stock trading plan and stock charting techniques to capitalize on the highs and lows of the stock market.


Market Direction

The sideways trading of the past few days is not unusual during the holiday vacation period. The Nasdaq has been moving sideways for the past 3 to 4 weeks. The 50 day moving average is coming up to meet the trading area. With the stochastics in the Nasdaq getting towards the oversold area, the probability of the 50 moving average acting as support looks good. After the steady uptrend in the markets for the past four months, the flat trading appears to be a resting stage.

The advantage of the slow steady uptrend is that the profit taking has been occurring along the way. This should modify any massive tax shifting of portfolios at the end of the year. The major advantage of a sideways general market condition is what the candlestick signals are revealing. There will be positive stock/sector moves during a sideways market. There will be other stocks/sectors showing strong short signals. The effects of the signals will not be influenced by the general market when there is not a definite trend influence. The signals pinpoint where the buying and selling is occurring. This allows the candlestick investor to exploit the price moves at the right times in specific stocks.

Knowing what the signals represent, as far as investor sentiment, puts the candlestick investor in a strong position. What is the high probability expectation after a major signal? As illustrated in the ESCL chart, the candlestick signal provides very valuable information that most investors will not interrupt. The Kicker signal, forming off a major moving average, has very powerful implications. Strong dynamics are created from the Kicker signal. ESCL, after a Kicker signal, shows that there is a new perception about the stock price. This is more evident after a long period of flat, indecisive trading.

Stock Prices, ESCL
ESCL

The breakout from a flat trading area is usually produced by an announcement that completely alters the future of that company. A break out, in the form of a Kicker signal, is that much more compelling. Would you buy a stock after it has had an 80% move in one day? Most investors won’t. But if you know what to expect after a candlestick breakout move, an 80% price move does not act as a mental deterrent, it becomes a stimulant/signal. The ability to analyze the information conveyed in candlestick signals then allows an investor to exploit profits from a strong price move that most investors would shy away from.

Stock Prices, IPO

IFO

If the eyes become acclimated to recognizing high profit trades, the candlestick investor to participate in big price moves from the initial move. RBAK was brought to everybody’s attention in the Candlestick Forum chat room. The chat room produces a double advantage. Investors learned how to use candlestick signals correctly having a constant flow of knowledge when analyzing live trades. Additionally, many eyes watching for high profit candlestick signal trade potentials produces a source of good trades that most investors might have missed. Do all trades move from $16.50 to $26 in two weeks? Not always, but having the ability to recognize a high potential trade puts the probabilities in the investors favor that they are in a situation that could create big returns.

Stock Prices, RBAK
RBAK

The point of investing is placing funds in investment situations that have good investment probabilities. The graphic formations of candlestick signals are the result of hundreds of years of ‘actual’ statistical analysis.

Breakouts are created like any other candlestick formation. It is the accumulation of investor sentiment during a specific time frame. That time frame may be condensed to a one day or two day time period. Who are the investors that are buying a stock at five dollars and selling 30 days later at $21? The investors that understand what the breakout signals illustrate. This is not difficult to understand. The information compiled into candlestick signals is knowledge that has been analyzed for the past few centuries. Utilize that information for your own portfolio success. Click here for the Candlestick Forum Break-Out training CD.

Investment cruise

This coming April 2007, Mr. Bigalow will be one of three or four speakers on an investment cruise. These cruises are extremely beneficial to investors that would like to learn a number of investment techniques. Being exposed to a number of investment techniques all at one time creates huge advantages. It allows investors to combine investment techniques into the mode of investing that is most comfortable for them. Watch for of the dates and details of this cruise. They are not only educational but extremely fun. This is an opportunity to gain a concentrated education on investment techniques that are working successfully.

Chat session

The chat session tonight will be at 8 p.m. ET. Everybody is welcome. This will be the last chat session until after the first of the year. Click here for instructions on how to join the stock chat.

Good investing

The Candlestick Forum Staff


New Year Specials – 20% Off all Quick-Download Videos and E-Books – Buy Now before Offer Ends!

Profitable Candlestick Trading” and “High Profit Candlestick Patterns

Options Trading

Options trading provides a unique investment vehicle to even the beginner investing in the stock market and provides many advantages including leverage, limited risk, insurance and profits in bear markets.

Leverage

Leverage is the ability to “buy in bulk”. First, remember that in options trading you are not actually buying or selling anything. This is an agreement between two investors if a transfer of assets actually takes place. Also take note that when someone buys an option they pay an amount known as a “premium” to the seller; this premium is the cost of the option.

That being said, leverage in options trading occurs when purchasing options. In the US , options are traded with a contract multiplier of 100; this is the number of shares per option traded. With this contract multiplier, even small investors are able to trade a large exposure, or leverage, on a small amount of capital. Successful trading in this manner can be quite profitable.

Limited Risk

This is another tremendous asset of options trading. Whether you are learning how to invest in the stock market or you currently have limited funds to invest, options trading offers a perfect vehicle for your trading. When you are trading options, you have a great advantage over traditional stock trading because you can take a view on the market direction with limited risk while at the same time having unlimited profit potential. This is because option buyers have the right, not the obligation, to exercise the contract for the underlying at the exercise price. If the price is not right at the time of expiration, the buyer will forfeit his/her right and simply let the contract expire worthless.
Let’s have a little option trading education. We have decided to buy an option on MEW Industries with the following information:

  • Company: MEW Industries
  • Option Type: Call Option
  • Position: Long
  • Strike Price: $20
  • September 8th

At the time of the trade, MEW Industries was trading at $25; the Call Option was trading at $6.50. This is known as the premium and it is the amount we paid for the right to possess this option. Therefore if we take into account the premium and the strike price, we will break even at $26.50; anything less would be a loss and anything more would be a profit. The beauty of options trading in the stock market is that if the stock price falls, we can simply allow the option to expire and lose only the premium. While this can be expensive, it is far better than being forced to buy one hundred shares $15 stock for $26.50 each!

Unlimited Profit Potential

Now you should be able to see how this type of options trading strategy gives you the best of both worlds; both limiting your risk and at the same time leaving you open to make unlimited profit if the market rallies.
Not all option strategies have this payoff benefit. Only if you are buying options can you limit your risk. For option sellers, this is the reverse – they have unlimited risk with limited profit potential. While this sounds very bad, once you understand the options available to you and how to use them, you can limit even the unlimited risk of selling strangle! (if you don’t know this options trading strategy, click the link)

Insurance

There is another way in options trading to protect yourself and your stock portfolio; this technique can give the investor who is uncomfortable with exposing himself or herself to risk some insurance. Options such as a Put Hedge can insulate an investment even during bearish periods.

A put hedge is the stock option trading strategy of buying puts during a bearish market to protect stock shares that, while the trader is reluctant to sell, are vulnerable to a decline in the market. Successful traders utilize strategies such as a put hedge to insulate their portfolios from loss in a bearish market. This method also has the potential of unlimited profits, while at the same time limiting the potential loss by the investor.

Conclusion

Options trading is a valuable and unique way of learning to trade in the stock market as well as making consistent profits without tremendous outlays of capital. While there is risk with options trading, it is usually limited and it has the ability to make you quite the successful trader.

Options Markets – Deciding On Your Investment Options

When formulating a trading plan for options, it is important to think about what approach you want to take in the options markets before you trade. It is important to develop an investment philosophy that reflects the strategy you have for your trading.

Understanding Options Markets Trading

Understanding the options markets is a product of understanding options trading. Options are an agreement between two parties where one agrees to sell a stock to the other party within a specific time period and for a specific price. Ownership as commonly defined does not apply since you don’t need to own a stock in order to implement a position.

A stock order, whether it is a “call” (an agreement to purchase) or a “put” (an agreement to sell), gives the holder the right to trade options. The holder is able to simply let the options order expire without investing further or go ahead and purchase the stock as agreed.

Preparing To Enter The Options Market

With an understanding of options the next step before entering the options market is to solidify your trading rules or your trading plan. These rules should include:

    1. Verification – This is a critical part of the process. You wouldn’t want to drive a car that wasn’t inspected prior to you getting behind the wheel; the same principle is true with your trading plan.
    2. Strict Guidelines – Your trading plan must be specific and precise. Having a tested, reliable trading plan we give you something solid when you hit a losing period.
    3. Testing – you can successfully test your trading plan via paper trading on the Internet. Without testing, your trading plan is left to chance. Does it work or fail? Testing will give you the confidence you need to be a successful trader.

Basic Options Market Orders
The final step is to enter the options market and start trading. There are two basic kinds of options market orders, “Calls” and “Puts”. Calls are contracts made by a buyer offering the conditions under which he or she will buy a particular stock. Puts are contracts offered by sellers outlining the conditions under which he or she will sell a particular stock. Each contract consists of the following information:

  • Purchase Item – This is the stock
  • Strike Price – This is the price that is the target for the contract
  • Expiration Date – The day on which the investment timing is no longer binding
  • Quantity – Usually in groups of 100

These items are included whether the options market order is a Call or a Put. When buying a call, if the terms are not met, the contract is not binding. In addition, if the terms are met but the options market conditions have changed to make the deal unfavorable the buyer can simply let the contract expire and if desired, purchase the stock from the open options market.

Improving Your Odds In The Options Market

There is one more thing you can do to increase your odds of success in the options markets. By implementing a trading system like Japanese Candlesticks you will add a powerful charting system for your options markets investing. Candlesticks was invented over 300 years ago as a method for trading in the rice markets of ancient Japan. The system has become an amazing tool for today’s options markets. With the charting abilities you will gain from Japanese Candlesticks you can literally give you a clear view of the directions of options before they even move. Added to your trading plan, Candlesticks can help you to be a successful trader in the options markets.

Buy Commodity Futures

Traders buy commodity futures in the expectation that the spot price on the commodity contract settlement date will be higher than the contract price. The trader will rarely accept delivery when they buy commodity futures. They will sell an equal quantity of the commodity, thus exiting the contract. The only ones who will actually deliver or take delivery of commodities are the producers and their customers. These traders are hedging when they buy commodity futures or sell them. For example gold mining company may sell gold futures and an oil refiner may buy oil futures in order to lock in a competitive price for the next months or years. It is possible to buy commodity futures on oil and other energy products several years into the future. Trading commodities requires a basic knowledge of the commodity in question and ongoing fundamental and technical analysis in order to competently anticipate commodity price trends. To learn how to buy commodity futures engaging in Commodity and Futures Training is wise. The use of very visual technical analysis tools such as Candlestick chart analysis can lead to profitable trades in the commodities markets.

Hedging commodities by producers and their customers goes back to the beginning of Candlestick basics in ancient Japan when rice traders learned to let the market tell them what the market would do. The traders who developed Candlestick charting learned that market history repeats itself. This repetition of Candlestick pattern formations allows traders today to buy commodity futures with an accurate sense of where the market is going next and how to engage in profitable commodity trading. When producers and customers hedge they are guaranteeing themselves a set price at a future date. This is a form of insurance and means of managing investment risk. The constant buying and selling of commodity futures by the main players in the commodities markets provides a baseline liquidity and stability to commodity trading. The addition of traders speculating on market activity adds to market volume and liquidity making technical analysis more accurate and typically makes Candlestick trading tactics even more successful.

Those who buy commodity futures are buying contracts for large quantities of live cattle, gold bullion, crude oil, and other commodities. However, the commodity market offers the trader leverage so that he or she need not provide the money to pay for the entire contract. To buy commodity futures the trader will typically pay several percent of the contract price. The leverage in buying commodities can lead to substantial returns on investment. The leverage can also lead to losses exceeding initial investment. Because of the potential market volatility in trading commodities the trader is well advised to stay in close touch with his or her investment. When a trader decides to buy commodity futures the trader is not obliged to keep the contract until the settlement date. If Candlestick analysis predicts that commodity futures prices will move in a profitable direction the trader can be ready to sell an equal contract and exit his or her position with a profit. If, as can happen, a technical analysis tool such as Candlestick chart formations predicts an unprofitable market move the trader will be able to exit the position before experiencing substantial losses.


Market Direction

Candlestick analysis utilizes the information built into candlestick signals along with other indicators. Being able to analyze multiple indicators helps the investor see whether there has been a change of investor sentiment that is meaningful. The three predominant indicators should be candlestick signal itself, the direction of the stochastics, and the trading in relation to the tee line. Although the Dow traded indecisively today, with some elements of bullish participation, the stochastics were still heading toward the oversold condition and the trading remained below the tee line. The positive trading during the afternoon ‘might’  have caused the bears to cover short positions. However, the overall trend did not show any change in investor sentiment. If bearish, the positive trading in the markets during the late afternoon might have been uncomfortable but nothing that would have instigated reversing positions.

Buy Commodity Futures, DOW

DOW
The use of the tee line, along with candlestick signals, produces high probability trade results. As illustrated in the July Wheat chart, the past two weeks of trading consisted mostly of indecisive Doji days. This revealed the possibility of two trend potential’s. Either this was a resting stage during uptrend or the trend was about  to reverse. Although that may seem like an obvious analysis, the function of the tee line makes the trend direction much easier to diagnose. The lower open today was confirming the series of Doji’s to the downside. Friday’s close below the tee line made the trade decision extremely easy. A lower open on Monday would warrant immediately shorting  of July wheat. The T line adds an excessive amount of credibility to the visual information conveyed by the signals. A trader is able to establish a short position was much more speed and confidence.

Buy Commodity Futures, July Wheat

July Wheat

The visual aspects of candlestick analysis allows an investor to very quickly evaluate what is occurring in investor sentiment. The speed in which a trend can be analyzed allows the candlestick investor to enter trades at  more opportune times. Where other trading techniques would require another day or two of confirmation, the candlestick signals provide valuable information immediately. Most investors learn how to invest with the wrong perspectives. This is due to normal human nature anticipating what price movements ‘should’ do. Reality shows that price movements usually move opposite of the normal investment thinking. This often debilitates an investor’s ability to make profits for many years, until they learn through hard knocks how prices actually move. Fortunately, the common sense investment practices built into candlestick signals allows an investor to correct their misguided thinking process. Learning how the candlestick signals are formed is a powerful training process that develops the correct insights into mastering profitable trading. This is not rocket science! This is merely learning the common sense investment principles through a graphic formation.

Chat session tonight 8 PM ET
Good Investing,
The Candlestick Forum Team


Current Website Specials

2-Day- Training Webinars 

Candlestick Technical Analysis Webinar

 Options Training Webinar

           Perfect for Beginners to Advanced Traders
Learn how to pick market-beating stocks.

Click here for details

Website special reflects current newsletter. If you are reading an archived newsletter you will be directed to Current Website Special

Stock Charts With Rising Trend Patterns – The Upside Tasuki Gap

Stock charts work equally well applied to individual stocks or to the major indices. Stock charts with Rising Trends indicate whether investor sentiment in the current market is Bullish or Bearish. On individual stock charts with rising trends, the Candlestick Signals help analysts spot the trend. Technical analysis is a skill that improves with practice. Candlestick stock charts quickly advance the learning curve for interpreting patterns. The Candlestick Forum provides weekly newsletters with specific stock charts of interest in the current market. We encourage you to signup for our free newsletter and join us each Thursday for our free stock chat.  These stock chat sessions, with Stephen W. Bigalow, review current market conditions and specific stock charts showing high profit potential trades.
This article focuses on identifying the UPSIDE TASUKI GAP, a Bullish Continuation Pattern. If you are new to trading, you will also want to review the 12 Major Candlestick Signals and Secondary Candlestick Signals.

Upside Tasuki Gap

UPSIDE TASUKI GAP

(uwa banare tasuki)

Description

The Upside Tasuki Gap is found in a rising trend. A White candles forms after gapping up from the previous white candle, as shown in the above illustration. The next day opens lower and closes lower than the previous day. If the gap is not filled, the Bulls have maintained control. If the gap was filled, then the bullish momentum has come to an end. If the gap is not filled, it is time to go long. The definition of a Tasuki is a ‘sash that holds up one’s sleeve.’

Criteria

  1. An uptrend is in progress. A gap occurs between two candles of the same color.
  2. The color of the first tow candles is the same as the prevailing trend.
  3. The third day, an opposite color candlestick opens within the previous candle and closes below the previous open.
  4. The third day close does not fill the gap between the two white candles.
  5. The last two candles, opposite colors, are usually about the same in size.

Pattern Psychology

Explaining the Tasuki Gap is simple. The Japanese place significance on gaps. When one appears in the middle of the trend and is not able to fill itself on weakness the next day, the strength is still in the uptrend. The pullback day is now construed as being a profit-taking day.

Back to Continuation Patterns

Stock Market Data Analyzed Easily Using the Bearish Engulfing Signal

Most investors get confused with the massive amounts of stock market data. Especially for new investors, trying to decipher which stock market data is the most important is an  impossible hurdle. Candlestick signals dramatically reduce the time for importing important stock market data.  The information built into the signals is the accumulation of observations from Japanese Rice traders over the centuries.  How do you know which stock market data is pertinent?  The information that is used consistently for centuries is an obvious clue.  The 12 major candlestick signals make for very high probability research.  The information conveyed in each major signal has viable results.

What becomes the most important element when utilizing stock market data?  The results the  information has produced in the past.  Understanding how to evaluate what each of the major candlestick signals reveals is very important.  The Bearish Engulfing signal is one of the 12 major signals.  It provides a very clear representation of what is going on in investor sentiment.  Where most stock market data is numeric, the candlestick signals provide that same information in a graphic form. Most stock market data requires evaluation.  This evaluation often involves complicated formulas.  The candlestick signals are very basic visual analytical tools.  The Bearish Engulfing signal visually illustrates that there has been a dramatic change in investor sentiment.  Candlesticks were developed specifically to add more information to chart analysis.

A simple description of  the Bearish Engulfing signal reveals why the signal works very well as a candlestick sell signal.  This is the stock market data that an investor should be using for both technical analysis as well as fundamental analysis. The information conveyed in this signal creates an extremely high probability that the buying is over.  It also reveals an opportunity for establishing a good short position.

Bearish Engulfing Pattern

Bearish Engulfing Pattern

Description

The Bearish Engulfing pattern is a major reversal pattern comprised of two opposite colored bodies. The Bearish Engulfing Pattern  is formed after an up trend. It opens higher than the previous day’s close and closes lower than the previous day’s open. Thus, the black candle completely engulfs the previous day’s white candle. Engulfing can include either the open or the close be equal to the open or close of the previous day, but not both.

Criteria

  1. The body of the second day completely engulfs the body of the first day. Shadows are not a consideration.
  2. Prices have been in a definable uptrend, even if it has been short term.
  3. The body of the second candle is opposite color of the first candle, the first candle being the color of the previous trend. The exception to this rule is when the engulfed body is a Doji or an extremely small body.

Signal Enhancements

  1. A large body engulfing a small body. The previous day was showing the trend was running out of steam. The large body shows that the new direction has started with good force.
  2. When the engulfing pattern occurs after a fast spike up, there will be less supply of stock to slow down the reversal move. A fast move makes a stock price over-extended and increases the potential for profit taking and a meaningful pullback.
  3. Large volume on the engulfing day increases the chances that a blow off day has occurred.
  4. The engulfing body engulfing more than one previous body demonstrates power in the reversal.
  5. If the engulfing body engulfs the body and the shadows of the previous day, the reversal has a greater  probability of working.
  6. The greater the open gaps up from the previous close, the greater the probability of a strong reversal.

Pattern Psychology

After an uptrend has been in effect, the price opens higher than where it closed the previous day. Before the end of the day, the sellers have taken over and moved the price below where it opened the day before. The emotional psychology of the trend has now been reversed.

Whether day trading, swing trading, or long-term investing, the major signals work effectively in any time frame. Candlestick charts become a very fast and easy analysis of what is going on in a price trend. The same analysis can be done on market indexes, sectors/industries, or individual stocks or commodities. Candlestick charts have recently come into vogue.  Over the past decade, the years of candlestick charts has exploded.  Unfortunately, most investors do not know how to use them correctly.  Learn the major signals and you’ll have control over your own financial future.

Stock market data is useless if it is not interpreted correctly. Candlestick stock charts allow an investor to evaluate a trend almost instantly.  When learning the stock market, use an investment technique that is well proven.  Candlestick analysis fits that description.

Candlestick Trading Tactics

Candlestick trading tactics make investing a much simpler process than most investment advisors care to admit. The basis of candlestick trading tactics stem from the fact that signals have been identified for hundreds of years to work successfully. Most investment programs are variations of indicators that work reasonably well. Candlestick signals have one specific element. They are the results of all investors buying and selling a trading entity during a specific time frame. This makes candlestick trading tactics an easy process to implement. Computers concurrently generate statistical analysis in the matter of seconds. That same statistical analysis for candlestick signals was derived through hundreds of years of actual use.

What makes the signals compelling investment tools is the fact that Japanese Rice traders not only used the signals for successful investing, their success made them legendarily wealthy. The trading tactics incorporated with the use of candlestick signals are ready has the aspect of successful probabilities. The Candlestick Forum has put many of these signals and patterns into a portfolio trading tactic program. The signals allow investors to successfully utilize the reversal signals for online stock investing. The strategies utilized for successful investing from candlestick analysis dramatically improves an investor’s stock market education.

Successful trading tactics require a clear evaluation of price trends. The most successful stock trading system involves the implementation of the consistent and successfully use of a trading program that puts the probabilities in the investors favor. Candlestick signals provide that format. The result of stock trend analysis can also be easily integrated with option trading with candlesticks. Putting the probabilities dramatically in the investors favor should be the basis of any investment program. Candlestick signals are in important part of trend analysis. The Candlestick Forum provides a multitude of informational techniques that permits an investor to create successful candlestick trading tactics.