2018 Stock Market Holidays

   UP Arrow GREEN      
Stock Market Holiday Calendars and  FREE E-BOOK
12 SIGNALS TO MASTER ANY MARKET
WHEN YOU SIGN UP FOR OUR NEWSLETTER
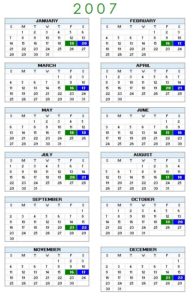
2018 Stock Market Holidays Date
New Year’s Day January 1, 2018
Martin Luther King, Jr. Day January 15, 2018
Washington’s Birthday/Presidents’ Day Febuary 19, 2018
Good Friday March 30, 2018
Memorial Day May 28, 2018
Independence Day July 4, 2018
Labor Day September 3, 2018
Thanksgiving Day** November 22, 2018
Christmas December 25, 2018
**The NYSE Trading Floor closes early (1PM ET) on
Friday the day after Thanksgiving

Remember, the professional money managers often vacation around scheduled exchange holidays.
They may also close positions several days before, causing lighter volume around the stock market holidays.


Finding Stock Entry Signals with Japanese Candlesticks

Learning the psychology behind accurate stock entry signals will truly alter your investment aptitude. You will start looking for “buy” signals in oversold stocks. You will start anticipating when to take profits in overbought stock positions. Remember, you are not being shown “secrets” of the investment world. You will be learning a trading program concept that will educate you on how the common investor thinks, then turn that thinking into huge profits. And you will learn how to do it without having to experience all the learning bumps that I did.

Coming around full circle, thinking what I would be thinking if I was reading all of this, is the same question that I would pose to all the other magnificently sounding investment programs that are on the market, “If this trading program is so great, why are you exposing it to everybody else?”

The One Major Drawback to Japanese Candlesticks.

Through the years it became apparent to me that the Candlestick trading signals were truly profitable trading indicators. So accurate that this system should be catching on like wildfire. However, the more I became convinced that the Candlestick methodology outperformed all other technical methods, the more I was surprised that very few people knew about its benefits. Very few. It was hard to find anybody who could intelligently converse about the signals. I can count on one hand the number of people that I could talk Candlestick trading with over the past ten years. And most of them had published books on the subject. The problem was that there was nobody to analyze my analysis, to confirm or reject what I saw in a signal formation. Essentially nobody knew how the Candlesticks worked and how positively effective they were.

It became apparent that this lack of knowledge would be detrimental in trying to establish a hedge fund using the Japanese Candlestick trading method. Convincing investors to invest in a fund that produces extraordinary returns, using Japanese Candlesticks, not a sophisticated sounding trading method, would be an uphill battle if trying to market to an uninformed public.

The truth of the matter is that teaching thousands of investors to utilize Candlestick investing will never affect any investments that the Candlestick Forum would be participating in. Each investor has their own specific areas of investment interest. Large cap stocks, bonds, grains, currencies, meats, options, and dozens of other investment vehicles will be the object of their investments. Even thousands of new Candlestick investors out in the investment arena would be a drop in the bucket compared to the many millions of investors in the world.

Take advantage of this candlestick investing knowledge. It will not take weeks or months to verify whether the signals work. They will prove themselves instantly. If you always keep in mind that the signals are the result of a change in investor sentiment, your road to extracting great amounts of profits from the markets will occur very quickly.

An Overview of Options Orders

Options orders are defined simply as an agreement between two investors where one party agrees to deliver something in the stock market to another party within a specific time period and for a specific price. The standard concept of ownership does not exist because you don’t need to own a particular stock in order to implement a position. Have you purchased a position and now you are interested in short selling that option? In the stock market you would have to borrow the stock to do it; in options trading only need to understand that there is no ownership and no problem making the transaction.

An options order or stock order, whether it is a “call” (an agreement to purchase) or a “put” (an agreement to sell), gives the holder the right to trade options; in addition, the holder is entitled to simply let the options order expire without investing further. Options orders can be low-risk ways to make money in the stock market because many times you can exit an option order that is unfavorable for only the price of the premium.

Types of Options Orders

Options orders cover in a number of different scenarios, offering the investor the ability to buy or sell and setting conditions for the transactions. The following are some of the options orders that are available:

  • Buying Calls – Buying a Call is a bullish options order on an underlying stock value. The investor has the opportunity to speculate on the rise of the stock’s value for the term of the contract with a predetermined risk. Most investors will look to sell their contract at a profit, while others may intend to exercise their right and purchase the underlying shares.
  • Buying Puts – Buying Puts is a bearish, somewhat speculative options order in which the investor anticipates that a stock will decrease in price during a set period of time. The trader realizes a profit when the stock and its underlying put option decrease in price during a set amount of time.
  • Selling Puts – When you sell puts, you are selling someone the right to sell you the underlying asset at a fixed price, on or before the expiration date of the option order. You can use this options order when you are bullish on the market and feel that it isn’t likely to go down in the short term, you can sell puts on a quality asset that you would like to own at a discount.
  • Selling Covered Calls – Selling a covered call is an options order where investors are willing to pay for the right to take a stock if it reaches a much higher price. It is an excellent strategy to implement while waiting for a stock to reach your identified sell point.
  • Put Hedge – A Put Hedge is an options order comprised of buying puts during a bearish market to protect stock shares that, while the trader is reluctant to sell, are vulnerable to a decline in the market. Successful traders utilize strategies such as Put Hedges to insulate their portfolios from loss in a bearish market. This method also has the potential of unlimited profits, while at the same time limiting the potential loss by the investor.
  • Calendar Spread – A Calendar Spread is an options order that involves selling an option with a date that is close to expiring against the purchase of another option, of the same strike price, that has a later expiration date.
  • Selling Bear Calls – Basically, this options order strategy is to buy out-of-the-money call options and sell in-the-money call options on the same stock with the same expiration date. The plan is that the in-the-money stock closes lower than its strike price at its expiration date, and then the trader realizes maximum profits from Selling Bear Calls.
  • Selling Strangle – This options order involves selling an out-of-the-money call option and an out-of-the-money put option with different strike prices on the same asset with the same expiration date.
  • Selling Straddle – Similar to Selling Strangle, this options order is a technique that involves selling a call option and a put option on the same asset with the same strike price and expiration date.
  • Selling Covered Calls – Selling a covered call means that there are investors willing to pay for the right to take a stock if it reaches a much higher price. By selling covered calls, you are able to accumulate income passively over time by collecting the premiums on your options.
  • Buying Strangle – A strangle buy is implemented by purchasing a call option and a put option on the same asset with the same strike price and expiration date.
  • Buying Straddle – A buy straddle is implemented by purchasing a call option and a put option on the same asset with the same strike price and expiration date. This is a desirable move because the risk is limited to losing the premium paid but its reward is unlimited.
  • Buying Calls – Buying a Call is a decidedly Bullish position on an underlying stock value. The investor has the opportunity to participate in the rise of the stock’s value for the term of the contract with a predetermined risk. Most investors will look to sell their contract at a profit, while others may intend to exercise their right and purchase the underlying shares.

Conclusion

There are quite a few more options orders available for your use; discussing your options orders with your broker can help to identify those that are available to you. Whether you are looking to capitalize on an upward movement of a stock or make defensive profits in a bear market, options are an excellent way to make money investing in the stock market.

RSS Articles – Continued

Stocks to Buy – Stocks to Buy When Long-Term Investing
Selling Shares – Selling Shares
Buy Shares – Buy Shares
Stock Trading Strategy – Stock Trading Strategy for Day Traders
Learn the Stock Market – Learn the Stock Market Basics
Trading for Dummies – Trading for Dummies in the Forex Market
How to Invest Stocks – How to Invest Stocks
Investing Basics – Investing Basics for Beginners
Blog Articles – May 2009
Investing for Beginners
Investing Tips
Investing 101
Stock Share
Charting Stock
Stock Markets
Buy Stock Online
Brokerage Firms
Trading After Hours

Currency Foreign Exchange – Currency Foreign Exchange
Basic Stock Information – Going Back to The Basics
Growth Stocks – Growth Stocks
Stock Investor – What is a Penny Stock Investor?
S&P 500 – S&P 500
Margin Trading – Margin Trading
Buy Stocks Online – Buy Stocks Online
Blog Articles – April 2009
Stocks and Shares
Stock Information
Stock Market Index
Bonds and Stocks
Trading Broker
Stock Advice
Stock Market for Beginners

Stock Shares – Basics of Stock Shares
Charting – Charting
Stock Market Trading – Stock Market Trading Tools
Fibonacci Trading – Fibonacci Trading
Short Sell – Short Sell
Trading Education – Trading Education
Shorting Stocks – Shorting Stocks
Futures and Options – Futures and Options
Trading Tools – Candlestick Charts
Blog Articles – March 2009
Trading Currencies
Short Selling
Day trading
Volume Trading
Spread Trading
Stock Trend
Market Timing
Price Stock
Investing Stock

Trading Analysis – Types of Technical Trading Analysis
Elliot Wave – The Elliot Wave Theory
Harami – Harami
Short Term Trading – Short Term Trading
Forex Strategies – Forex Strategies
Options Trader – Options Trader
Make Money Trading – Make Money Trading
Forex Trading Strategies – Forex Trading Strategies
Blog Articles – February 2009
Day Trade
Practice Trading
Options Strategies
Stock Market Prices
Stock Option Trading
Buying Shares
Forex Analysis
Forex Account

Commodity Market – Commodity Market
Buy Currency – Buy Currency in Pairs
Forex Online – Forex Online
Forex Candlestick – Forex Candlestick
Psychology of Investing – Psychology of Investing
Buy Stocks – Buy Stocks
Investment Management – Investment Management
Blog Articles – January 2009
Dividends
Shares
Stock Market
Trading Psychology
Online Forex
SSF
Futures Market
Online Forex Currency Trading

Futures – Futures Market
Options Investing – Introduction to Options Investing
Trading Online Stock – Trading Online Stock
Invest – Invest Online with Japanese Candlesticks
Online Trades – Online Trades in the Stock Market
Brokerage – What is a Brokerage Firm?
Stock Trades – Penny Stock Trades
Online Stock Investor – Fundamental vs. Technical Analysis
Blog Articles – December 2008
Swing Traders
Online Stock
Stock Price
Online Stock Trades
Trading Online
NASDAQ

Buying Stocks and Shares – Buying Stocks and Shares
Buying Stocks Online – Buying Stocks Online
Futures Education – Futures Education
Candlestick Charting Techniques – Candlestick Charting Techniques
Stock Trading Tips – Stock Trading Tips
Investment Knowledge – What is your Stock Investment Knowledge?
Blog Articles – November 2008
Stock Trading Terms
Alternative investments
Technical Analysis Charts
After Hours Trading
Stock Market Investment Basics
Moving Average
Buying Stocks on Margin
Short Selling Stocks
Trend Stock Trading

Trading Shares Online – Trading Shares Online
Hedging Strategy – How to Determine Your Hedging Strategy
Option Investing – Option Investing
Trading Futures Contracts – Trading Futures Contracts
Stock Price Volatility – Stock Price Volatility
Commodities Tips – Commodities Tips for New Investors
Commodities Trading Online – Introduction to Commodities Trading Online
Trading Commodities Online – Trading Commodities Online
Blog Articles – October 2008
Why Trade Currencies
Forex Introduction
Stock Trading Online for the Beginner Investor
Commodities Traders
Commodities Exchange
Paper Trading
Stock Trading Rules
Stop Orders
Candlestick Stock Charts

Stock Day Trading – Stock Day Trading Tips
Trend Trading – Trend Trading
Traders – Traders in Commodities
Technical Analysis of Stock – Technical Analysis of Stock
Stock Traders – Types of Stock Traders
Trading Strategies – Trading Strategies for Playing the Stock Market
Online Stock Broker – Online Stock Broker
Trading Stocks Online – Trading Stocks Online with Japanese Candlesticks
Candlestick Pattern – Candlestick Pattern Reversals
Blog Articles – September 2008
FX
Online Brokers
Online Day Trading
Stock Trading Education
Trade Stocks
Technical Indicators
Temporary Short-Selling Rules

Day Trader – What is a Day Trader?
Trading on the Stock Market – Momentum Trading on the Stocl Market
Stock Picks – Stock Picks for Penny Stocks
Stock Option – What is a Stock Option
Short Term Stock Trading – Short Term Stock Trading
Trading Shares – Trading Shares in the Stock Market
Learn Online Stock Trading – Learn Online Stock Trading
Stock Market Day Trading – Stock Market Day Trading Strategies
Penny Stock Trading – Penny Stock Trading
Blog Articles – August 2008
Learn Stock Trading
Stock Market Trading Strategies
Technical Stock Trading
Professional Stock Trading
Japanese Candlestick Charting
Trading Strategy
Stock Trading Charts
Stocks
Currency Market

Stock Trading Terminology – Quick Look at Stock Trading Terminology for Beginner Investors
Stock Trading Strategies – Stop Trading Strategies
Trading in the Stock Market – Trading in the Stock Market Using Technical Analysis
Day Trading Stocks – Day Trading Stocks
Doji Candlestick – Doji Candlestick
Trading Stocks for Beginners – Quick Introduction to Stock Trading
Investment Firms – Investment Firms Online
Blog Articles – July 2008
REIT Stocks
Best Stocks
Trading Stock On Line
Candlestick Patterns
Bullish

Buy Bonds – How Do I Buy Bonds
Stock Options Trading – Stocks vs. Stock Options
How To Invest Money – How To Invest Money in The Stock Market
Online Trade – Methods Used to Profit from an Online Trade
Hot Penny Stocks – Hot Penny Stocks
Learn How The Stock Market Works – Learn How The Stock Market Works
Blog Articles – June 2008
Investment Strategy
Stock Market Investment
Investment Online
Invest Money
Australian Stock Market
Corporate Bonds
American Mutual Funds
Investment Opportunity

Forex System – Forex System
Best Penny Stocks – Best Penny Stocks
Fibonacci Trading Techniques – Understanding Fibonacci Indicators in Technical Analysis
Forex System – Forex System
What Are Mutual Funds? – What Are Mutual Funds?
Forex Market Education – Forex Trading Education
Stock Market Education – Stock Market Education
Trend Analysis – Trend Analysis
Investing in Bonds – Investing in Bonds
Trade Mutual Funds Online – Learn the Basics to Trade Mutual Funds Online
Blog Articles – May 2008
Buy Gold
Market Analysis
Investment Software
Forex Trading Platform
Online Investing Education
Best Mutual Funds
Forex Online Training
Investment Manager
Forex Charts

Stock Market Basics – Stock Market Basics Revisited
Online Stock Market Trading – Online Stock Market Trading Using Japanese Candlesticks
Stock Trading Software – What Are The Advantages?
Technical Analysis – Technical Analysis and Japanese Candlesticks
Investment Timing – Improving Your Results With Candlestick Trading
Investment Options – Investment Options Can All Be Enhanced With Japanese Candlesticks
Learn How to Invest – Learn How To Invest Using Japanese Candlesticks
Stock Investing for Beginners – Made Easy With Candlestick Signals
Stock Market For Dummies – Made Easy With Candlestick Signals
Learn Forex – How to Learn Forex Trading
Setting Stop Loss Orders – Also Called ‘Stop Market Order’ or ‘Stop Orders’
Forex Currency – Forex Currency Trading
How to Pick Stocks – How to Pick Stocks When Penny Stock Investing
Over The Counter Stocks – Over The Counter Stocks
Top Mutual Funds – Finding The Top Mutual Funds
Learn Online Investing – Learning Online Investing
Mutual Funds –  Mutual Funds
Blog Articles – April 2008
Foreign Currency Exchange
Money Market Mutual Funds
Online Trading Course
Foreign Currency
No Loan Mutual Funds
List of Penny Stocks
Trade Forex
On Line Stock Trading
Forex Training

Investment Opportunities – Investment Opportunities in the Stock Market
Real Estate Investment Trusts – What are Real Investment Trusts
How To Buy Stocks – How to Buy Stocks
Online Investing – Online Investing Tips for the New Investor
Trading Stock – Trading Stock
Currencies Trading – Currencies Trading Introduction
Exchange Traded Funds – Exchange Traded Funds
Option Investing – Option Investing
Foreign Currencies – Foreign Currencies
Learn About Forex Currency Trading – Learn About Forex Currency Trading
Commodity Futures – Commodity Futures Overview
Investment Advisors – Get the Best Advice and Return on Your Investments
Investment Clubs – Interested in Joining or Creating Investment Clubs
Forex Exchange – Forex Exchange Market
Investment Analyst – What is an Investment Analyst
Retirement Investment – Retirement Investment
Portfolio Manager – What is a Portfolio Manager
Investing Money – Investing Money
Gold Stocks – Investing in Gold Stocks
FX Trading – FX Trading
China Stock Market – 2007 China Stock Market Recap
Commodity Price – Commodity Price Introduction
Forex Broker – Choosing a Forex Broker
Bond Investing – Bond Investing for New Investors
Online Trading – Introduction to Online Trading
Trade Currency – What Does it Mean to Trade Currency
Stock Investing – Stock Investing Information to Get You Started
NYSE – New York Stock Exchange
Commodity Manager – Watching Futures Like A Commodity Manager
Basic Stock Information – Going Back to The Basics
Stock Market News – Do You Take Advantage of This
Children and the Stock Market – When Should They Learn to Invest
The Stock Market – What Are My Choices?
Investing Mistakes – Investing Mistakes and How to Minimize Them
Portfolio Diversification – Portfolio Diversification and Risk Management
Stock Market Investments – Interested in Learning About Stock Market Investments?
Online Trading – An Introduction to Online Trading
Trade Currency – What Does it Mean?
Stock Investing – Stock Investing Information to Get You Started
NYSE – New York Stock Exchange
Stock Market Investing – A Quick Look at Stock Market Investing
High Dividend Stocks – Stocks That Produce a High Yield
Blog Articles – December 2007
Stock Market Charts
Online Discount Brokers
Forex Trading Strategy
Trading Futures
Investing in Gold
Investing in Mutual Funds
Online Option Trading
Forex Currency Trading

Day Trading Stock Online – A Quick Introduction
Stock Market Analysis – There Are Two Types
Stock Exchange – An Institution That Hosts a Market
Open Market – Learn to Invest
Shareholders – Owning Stock
Discount Broker – Choosing the Right One
Bear Markets – The Great Depression
Dividend Paying Stocks – Screening
Blog Articles – November 2007
London Stock Exchange
Trading Stock online
Retained Earnings
Joint Stock Company
Stocks and Bonds
Bonds in Their Basic Form
Stock Picking
Portfolio Management
Online Stock Trading Game
Asset Protection 

Better Investing – The Ogg Report
Cheap Stocks – What Makes it Cheap?
Gold Investing – A Standard for Monetary Exchange
Mutual Fund Investing – Need Help with Investing?
Investing For Dummies – 8 Helpful Tips
Online Stock Trading – Online Stock Trading
Stock Charts – Why Use Them?
Blog Articles – October 2007
Trading Stocks
Forex Traders
Investing Strategy
Penny Stock Investing
Dividend Stocks
Investing Advice
American Stock Exchange
London Stock Exchange

Back to Recent RSS Feeds
 

Options Expiration Calendar

Options Expiration Calendar 2007

Trade Day Indicator   Last Trading day for stock options

Expiration Date Indicator    Actual expiration date for stock options

Trading the Upside Gap Three Method

Description

The Upside Gap Three Method is a simplistic pattern, similar to the Upside Tasuki Gap, occurring in a strong trending market. In an uptrend, a gap occurs between two white candles. The final day opens within the top white body and closes in the lower white body, filling the gap between them.

Upside Gap Three Method

Upside Gap Three Method

 Criteria

  1. In an uptrend, two white candles form, having the second one gapping above the first.
  2. The third day opens lower, int he body of the top white candle and closes int he body of the first white candle.

Pattern Psychology

A market has been moving in a direction,t hen a gap appears between two white candles. Gaps have significance in that they eventually have to be filled. The fact that it becomes filled immediately leads investors to think that the pullback is just a profit taking pullback. The trend should resume immediately after the gap filling is satisfied.

Back to Continuation Patterns

Defining Futures Orders

Futures orders have a simple definition but a wide variety of possibilities. Not unlike options trading in the stock market, futures orders cover a number of different trading scenarios.

Market Orders

This is the most basic of futures orders. It is the same for either buying or selling; once the order reaches the trading pit, it is executed for the best price available.

  1. Limit Orders – A limit order is a futures order used for buying or selling when a certain price is reached. A limit order to buy is placed below the current market price and a limit order to sell is placed above the current market price. When the target price is reached, a market order is executed to buy or sell based on the limit order.
  2. Stop Orders – Stop orders are used in futures markets as protective techniques for either buying or selling. Three purposes of stop orders are:

    1. Reducing losses on long or short positions
    2. Opening new long or short positions
    3. Protecting a profit on an existing long or short position

    A buy stop order is placed above the market and a sell stop order is implemented below the market.

  1. Market If Touched – This futures order is the direct opposite of a stop order. Sell Market If Touched orders are only executed if the price is above the market while but buy Market If Touched orders are only executed if the target price is below the market when implemented. An MIT order is usually used to enter the market or initiate a trade. In commodities trading, an MIT order is similar to a limit order in that a specific price is placed on the order. However, an MIT order becomes a market order once the limit price is touched or passed through. An execution may be at, above, or below the originally specified price. An MIT order will not be executed if the market fails to touch the MIT specified price.
  2. Stop Limit Order – A stop limit order is a futures order that lists two prices and is an attempt to gain more control over the price at which your stop is filled. The first part of the order is written like a regular stop order. The second part of the order specifies a limit price. This indicates that once your stop is triggered, you do not wish to be filled beyond the limit price. Stop limit orders should usually not be used in commodity trading when trying to exit a position.
  3. Market On Opening – This is a futures order that is to be executed within the opening range of trading.
  4. Market On Close – This is the opposite of a Market On Opening. This futures order is given to execute a trade in the closing seconds at the best available price.
  5. Fill Or Kill – Fill Or Kills are futures orders used by customers wishing an immediate fill, but at a specified price. A floor broker will likely bid the order two or three times and immediately return either a fill or an unable.
  6. Spread – An investor is likely to use a Spread to take advantage of the differences in two prices. For this futures order, a long and short position will both be taken hoping to exploit the difference in price. For example, buy 15 October Corn Futures , sell 15 November Corn Futures plus 2 to the November sell side.  This spread order means to sell the spread when the November corn is 2 points higher than the October corn.

Conclusion

In addition to these futures orders, there are additional orders that some but not all markets recognize.  It is important to discuss your futures orders with your broker so that you are aware of the available orders.  If you are trading oil futures your broker can tell you whether you can implement Spreads or if Fill Or Kill is unavailable in your particular market.  Knowing the terms involved with futures orders will help you to be a more successful trader in the futures market.

Reading Stock Charts – The ‘Stick Sandwich’

Reading a stock chart can be overwhelming at first glance. Candlestick Signals and patterns make reading a stock chart quick and easy. A brief look at Stock Investing Basics with Candlesticks, shows the visual comparison between reading stock charts with Candlesticks versus Bar Charts.

Individuals new to trading the stock market have a number of decisions to make regarding their chart preferences. Choosing Candlestick Charts, versus ‘Bar charts,’ makes for a quicker  evaluation of price trends. Reading a stock chart in the ‘Bar’ format makes it very difficult to interpret impending price reversals. Identifying stock chart reversals, continuations, and consolidation is paramount when reading a stock chart. Even professional  investors are taking courses to trade with Japanese Candlesticks. That should tell you the importance of using candlesticks for reading stock charts.

Candlestick charting provides a quick graphic depiction easily learned by new investors. Bar charts illustrate what price movements did during a specific time frame. Reading a stock chart, displayed with candlesticks, reveals HOW and WHY the price moved. Fundamentals do not make price moves. Investor perception determines the underlying price and Candlestick Signals clearly demonstrate investor sentiment. This provides valuable insight when reading a stock chart. The ability to evaluate trades with profitable entry and exit strategies will make-or-break your portfolio. Reading a stock chart accurately is the first step for investor education. Our website is designed to help all investors learn to read Candlestick Signals and Candlestick Chart Patterns. Pages are in a printer-friendly format to allow you to print the illustration and trading criteria for quick reference during your trading day.

Be sure to begin your training with our Free Resources Section on The Major Candlestick Signals.

Stick Sandwich
STICK SANDWICH

Description

The Stick Sandwich looks somewhat like an ice cream sandwich. it consists of two dark candles with a white candle in between. The closing prices of the two black candles are equal. This demonstrates an obvious support price. The probability of a reversal in the trend is high from this area.
 
Criteria

  1. A downtrend is concluded with a large black candle followed by a white candle. The white candle opens above the black candle’s close, and closes above the black candle’s open.
  2. The final day completely engulfs the white candle and closes at the same level as the previous black candle.

Pattern Psychology
The Bears have been in control for awhile. At the end of the downtrend, the last black candle is followed by a large white candle. The white candle opens higher than the close of the last black candle. It trades up for the rest of the day, closing above where the previous day opened. This action makes apparent to the Bears that the downtrend may be coming to an end. The next day opens higher but trades down for the rest of the day. It cannot close lower than the previous low close of two days prior. The shorts take notice and start covering upon any buying strength over the next couple of days.
 
Training Tutorial

Candlestickforum Flash Cards  These unique Flash Cards

Stock Investing Basics of Japanese Candlesticks

Candlestick trading analysis does not require knowing intricate formulas or ratios. Candlestick analysis does not require massive amounts of education to effectively utilize the signals. The stock investing basics of Japanese Candlesticks result in clear and easy to identify patterns that demonstrate highly accurate turns in investor sentiment. The average investor does not have to be dependent on the investment professional, a professional whose recommendation does not always have your interest at the forefront. Whether totally unfamiliar with investment concepts or very sophisticated in investment experience, the Japanese Candlestick trading formations are easily utilized. The signals and patterns are easy to see. Candlestick Profits - Bar Chart Comparision
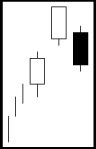
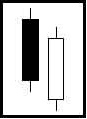
As illustrated, a stock price closing higher than where it opened will produce a white candle. A stock price closing lower than where it opened creates a black candle. The boxes formed are called “the body”. The extremes of the daily price movement, represented by lines extending from the body, are called “shadows or tails.”
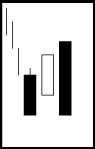
A stock price closing where it opened or very close to where it opened is called a ‘doji.”

A hollow candle forms when the stock closes higher than its opening price.

A solid (or filled) candle forms when the stock closes lower than its opening price.

Memorizing the Japanese Candlesticks names and descriptions of the candlestick trading formations is not necessary for successful trading. Reading about the Japanese Candlesticks signals is interesting and it aids in remembering them.

The Candlestick Forum is the foremost aid in learning how to use the Japanese Candlestick trading signals correctly. Stephen W. Bigalow has studied, analyzed and developed simple methods for profiting from the signals. His published book, PROFITABLE CANDLESTICK TRADING: PINPOINTING MARKET OPPORTUNITIES TO MAXIMIZE PROFITS, incorporates the common sense, logical disciplines that most investors are aware of but ignore.

For more information on the book that will revolutionize your investment perceptions: Profitable Candlestick Trading: Pinpointing Market Opportunities to Maximize Profits and “High Profit Candlestick Patterns: Turning Investor Sentiment into Profits” released December 2005.

Throughout history, investors have acted in the same manner through all market conditions. Investment behavior is a function of the market conditions. The Candlestick Forum helps investors recognize those market conditions, explains how human weakness creates those conditions and instructs the investor to take command of those weaknesses. The Japanese viewed patterns developing over a number of centuries. The patterns produced predictable results. Learning the patterns is a simple process. Utilizing the underlying knowledge built into the signal formation provides an immense advantage for amassing wealth.

You now have the forum to learn how to direct your own investment results. This website is established for the continuation of the learning process. Any services that you utilize from The Candlestick Forum’s expertise can always be confirmed and reinforced through constant contact with the Candlestick Forum’s staff.

Becoming proficient at any trading method requires constant exposure to training and practice. The Candlestick Forum staff acts as a constant source of signal analysis confirmation as well as an educational taskmaster to keep subscribers alert to highly profitable trade situations.

Learn the intricacies that make the signals so powerfully effective. The Candlestick Forum’s library of E-books provide detailed insights into mastering the Candlestick methodology in-depth. Over a decade of learning procedures have been developed into a fast and easy method for becoming profitably proficient. Discover the potency a price move produces when knowing the psychology behind a reversal formation. Cultivate inordinate profits from a portfolio by exercising simple stop-loss methods made obvious by the Candlestick formations.
Discover the knowledge filled e-books that describe how to make huge profits from candlestick signals.

The magnitude of your profit potential is limited only to the level of leverage you want to partake. The Candlestick Forum’s e-books provide clear descriptions of how to use options, futures, commodities and margin in conjunction with reversal patterns. Consistent use of high probability trades can produce massive returns. The compounding effect of well designed, high profit potential trading programs turn singles into home run returns. Become educated in trading practices that eliminate destructive emotional intervention.

Take advantage of the benefits that Japanese Candlestick trading provides. Opportunities are easily identified, Somebody will take advantage of the information the signals provide. Once you learn the valuable benefits revealed by Candlestick formations, the rewards will be overwhelming.

Candlestick Images and Explanations

The Added Power of Candlestick Formations

Training Tutorial

Candlestickforum Flash Cards  These unique Flash Cards will allow you to be “trading like the Pro’s” in no time.
 

Stock Market Tips Make Investing a Hit or Miss Proposition. The Candlestick Signals Produce High Probability Situations.

Stock market tips are usually the demise of most investors. The dream of most investors is to find the stock market tips that are going to make them wealthy.  Unfortunately, that does not happen.  Depending upon stock market tips will lead most investors into a demoralizing method of investing.  Consider the factors that surround stock market tips.  The information is usually relatively old by the time it reaches the ordinary investor.  If the stock market tips are coming from an acclaimed guru of a stock market, it has probably been well positioned into accounts before the general public is made aware of the recommendation.

What you do when executing stock market tips?  That should be the first question.  Most stock market tips emphasize getting into the position as quickly as possible.  Whatever great things are going to happen in the stock price are going to happen soon.  Stock market tips  are not representative of an intelligent investment strategy.  Investing involves implementing a program where an investor can continue to improve return results.  Candlestick signals provide the format for establishing consistent investment returns.

The major problem that comes from putting funds into everybody’s stock market tips is very simple to understand.  If that particular investment situation does not perform as expected, the investor is right back where they started.  They do not have a viable investment strategy.  Candlestick signals, on the other hand, are based upon high probability situations.  Establishing a position based upon one of the major candlestick signals allows an investor to evaluate when to get into a position and when to get out of a position.

The signals are the result of many centuries of observations. If the statistical results of the major candlestick signals were not proven, we would not be looking at them today.  The psychology built into a major signal is simple common sense investment philosophy.  As demonstrated in the piercing signal, the Japanese Rice traders have a high expectation of what the result should be.  Having this knowledge makes investment programs very easy to implement.

Piercing Pattern

PIERCING PATTERN

Description

The Piercing Pattern is composed of a two-candle formation in a down-trending market. The first candle is black, a continuation of the existing trend. The second candle is formed by opening below the low of the previous day. It closes more than midway up the black candle, near or at the high for the day.

Criteria

  1. The body of the first candle is black; the body of the second candle is white.
  2. The downtrend has been evident for a good period. A long black candle occurs at the end of the trend.
  3. The second day opens lower than the trading of the prior day.
  4. The white candle closes more than halfway up the black candle.

Signal Enhancements

  1. The longer the black candle and the white candle, the more forceful the reversal.
  2. The greater the gap down from the previous days close, the more pronounced the reversal.
  3. The higher the white candle closes into the black candle, the stronger the reversal.
  4. Large volume during these two trading days is a significant confirmation.

Pattern Psychology

After a strong downtrend has been in effect, the atmosphere is bearish. Fear becomes more predominant. The prices gap down. The bears may even push the prices down further. However, before the end of the day, the bulls step in and dramatically turn prices around. They finish near the high of the day. The move has almost negated the price decline of the previous day. This now has the bears concerned. More buying the next day will confirm the move.

Being able to utilize information that has been used successfully in the past is a much more viable investment strategy than taking shots in the dark.  Keep in mind, when you are given privileged information about stock market tips, where you are in the food chain. Are you one of those privileged few that gets top-notch pertinent information on a timely manner, or you one of the masses that feed into a frenzy and allow the smart money to make the profits?

Training Tutorial

The Piercing Pattern

Remarkable results have been observed with this signal. This 35 minute video provides a clear understanding of what this signal indicates and how to trade it for profit.

Candlestick Forum Flash Cards   These unique Flash Cards will allow you to be “trading like the Pro’s” in no time.

Return to Candlestick Explanation of the Major Signals