Commodity Trading Course Not Required with Candlestick Signals

commodity trading course is not needed when utilizing candlestick signals. What can be taught in a commodity trading course? An investor only needs to understand what makes commodity prices move up or down. Candlestick signals clearly demonstrate when prices are going higher, or going lower. A commodity trading course can not provide a platform for analyzing what prices are going to do. What makes commodity prices move? Supply and demand! A commodity trading course will not be able to produce the insights to trade successfully. Candlestick signals produce the format for detecting changes in investor sentiment.

Where do investors learn how to trade commodities? There is not a commodity trading course available in institutions of higher learning. An investor needs a platform for detecting when to buy and when to sell. The Japanese Rice traders developed the most basic and accurate method for producing high profits in commodity trading. They traded the most basic of commodities, Rice. The information that is conveyed in a candlestick signal is much more important than trying to analyze the fundamental conditions of a commodity price. The big money, ‘smart money,’ can be seen establishing their positions based upon what the candlestick signal formations reveal.

Utilize the simple information that is conveyed in a candlestick signal. Each signal has been analyzed for hundreds of years. Not only does that analysis include visual recognition of a reversal in a commodity price trend, the Japanese Rice traders were able to evaluate what the investor sentiment was doing to create the reversal signal. Learn to use the candlestick signals correctly and understand the information that each signal provides and you will have a huge investment advantage. This is not difficult analysis. Each candlestick signal illustrates what investors were thinking at important reversal points. When this knowledge can be seen in a graphic formation, the probabilities of being in the correct trade at the correct time increases dramatically.

This week’s featured Candlestick Pattern –

Breakaway Bearish and Bullish

The Breakaway Pattern

Description

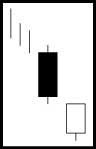
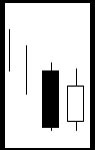
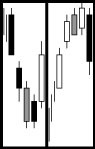
If  a trend has been evident, the breakaway pattern, whether bullish or bearish initially indicates the acceleration of that trend. The pattern starts with a long candle representing the current trend. The next candle gaps away from the long candle with the color of that candle the same as the long candle. The third day can be either color. It will not show a change in the trend. The fourth day continues the trend, having the same color as the trend. The fifth day reverses the trend. It opens slightly opposite of the way the trend has been running. From there, it continues in the same direction to where it closes in the gap area.
 
Criteria

  1. The first day is a long-body day  has the color of the existing trend.
  2. The second day gaps away from the previous close. It has the same color as the first day candle.
  3. Day three and four have closes that continue the trend.
  4. The last day is an opposite color day that closes in the gap area between day one and day two.

Pattern Psychology

After a trend, usually in an overbought or oversold area,  a  long candle forms. The next day they gap the price further. That day has the same color as the trend. For the next two days, the bulls and/or bears keep the trend going in the same direction, but with less conviction. The final day, the move goes opposite the existing trend with enough force to close in the gap area between day one and day two. This day completely erases the move of the previous three days.

Your One-Stop Shop for Japanese Candlesticks

The Candlestick Forum strives to be the top stock market educational site for Japanese Candlestick Trading. We offer a large database of free resources to enhance your trading abilities. Be sure to check out all the categories with free information on technical stock analysis. New to the stock market? Begin your stock market investing education here!

The Free Resources area is designed to allow you to easily find all the Japanese Candlestick Patterns by Major SignalsSecondary Signals, and Continuation Patterns. Additionally, each category lists a link to the specific signal or pattern and provides the image and trading criteria in a printable format. Learn stock market investing quick and easy!


Our Home Page covers Candlestick Investing for Commodity Trading, Day Trading, Futures Trading, Long Term Investing, Swing Trading, and Option Trading.


Take a sneak peek in  Membership Benefits to see what goes on behind the paid section of our website.


Learning the stock market just got easier. Join Stephen W. Bigalow for weekly stock chat sessions. See the stock charts and learn stock market investing with Japanese Candlesticks. The stock market for beginners can be overwhelming. Investing in the stock market involves technical analysis of stock charts. More individual investors are turning to candlestick charts for day trading and long term market analysis.  Join Stephen Bigalow each week for  free market analysis through Stock Chat. Weekly sessions include audio/video presentations on candlestick technical trading and includes a 30 minute question and answer session. Recorded archives are available for review for individuals unable to join live due to time conflicts.


DAILY STOCK MARKET COMMENTS – Read Mr. Bigalow’s daily market comments. 


The Candlestick Commentary Newsletter is personally written by Stephen W. Bigalow, recognized by many in the trading community as the “professional’s professional”. Registration is easy! Simply fill in your email address in the space provided on the lower left-hand side of this page. Register today – You do not want to miss the invaluable market insight provided by Stephen Bigalow. (scroll down and enter email address in the ‘Subscribe’ field on lower left)

Free Stock Market Newsletters – topics include:

MARKET COMMENTS

The publication utilizes the capabilities of the Candlestick signals to quickly analyze all investment vehicles. Stephen W. Bigalow’s years of Candlestick analysis experience produces an easy to read, concise evaluation of market direction. Accurate evaluations are assessed to the Dow, the Nasdaq, S&P, bonds, metals, currencies, all market entities that allow an investor to project future price movements. Having this knowledge presented in a clear format allows the investor to formulate concise decisions.

CANDLESTICK SIGNAL DESCRIPTIONS

Learn how the signals identify the big price moves. Read about the psychology behind a price move attributed to the strength of a signal. Each newsletter will include interesting and profitable elements of a signal formation. You get valuable insights into why a price move occurred. This acts as an excellent preparation for identifying the next big profit situation.

CURRENT EVENTS

Follow how situations in the news media can affect your profits, profits created by media reports causing panic selling and exuberant buying provide excellent profit taking opportunities. Stay apprised of government and business decisions.


Be sure to check our Events & Training Page where we cover any upcoming seminars or free speaking engagements.


Enter the Discussion Forum and enjoy a community of traders, helping each other! This is FREE and one of our most popular formats where fellow traders share hot tips and trading techniques. Always Open!


Stephen Bigalow is frequently asked to write articles for major trading magazines. You can read past publications for free in the Publications & Articles Page.


Search our Ask The Experts  Page where fellow traders post frequently asked questions.


The Candlestick Forum’s Preferred Trading Platform

Free Resources, Ninja Trader LogoFree resources, Kinetick Logo

NinjaTrader is the preferred active trader platform for traders worldwide including our clients.  We are pleased to offer NinjaTrader to our clients for many reasons but one great reason is that you can get started with NinjaTrader for Free!  Why pay hundreds of dollars per month for products with less functionality when with NinjaTrader all you need is access to a real-time or historical data feed.

You can also connect NinjaTrader to Kinetick, our preferred market data service, for free End-of-Day data!  Download NinjaTrader Now


Privacy Statement: We will never give away or sell your email address to anyone for any reason. It is for the sole purpose of sending you this newsletter free of charge. You are not put on any other mailing lists and you can unsubscribe at any time using the link at the bottom of each email sent.

Bear Put Spread – Bearish Options Trading Strategy

A Bear Put Spread is a stock option trading strategy employed when the market is volatile and moderately bearish. In such instances, an investor will look to make profitable trades that do not incur high risk. The Bear Put Spread method, also known as Vertical Bear Puts, is used by successful traders in such times to realize profits when the market is looking to the money of the investor.

The profit and loss strategy for a Bear Put Spread is very similar to a Bear Call Spread. The investment timing and stock market strategy for a Bear Put Spread is as follows. A trader will buy a put option on a particular stock that is out-of-the-money and will sell an out-of-the-money put on the same stock. For this method, both options should have the same expiration date. With a Bear Put Spread, the trader does not immediately realize the net premium when establishing the position as is the case with a Bear Call Spread. In a Bear Put Spread, the investor must wait until the expiration date to see any profit. While the trader doesn’t have money in hand, the profit potential is greater with a Bear Put Spread.

As noted above, the Bear Put Spread is more risky than a Bear Call Spread, but the potential for profit is greater than implanting the call spread. In a Bear Put Spread, if the stock price increases above the in-the-money (higher) put option strike price at the expiration date, then the investor has a maximum loss potential of the net debit. Conversely, the maximum profit potential involved in a Bear Put Spread occurs when the stock decreases below the out-of-the-money (lower) put option strike price. In a Bear Call Spread, the maximum profit potential is limited to the premium collected for the calls sold, less the cost of the premium paid for the calls that were purchased. Both strategies can be utilized in a bearish market, and care should be taken to understand the risk reward ratios for each strategy.

Successful trading includes such techniques as Bear Put Spreads. When an investor, through stock technical analysis, becomes aware of a bear market, it is imperative to modify his, or her, stock market trading system. A trader will find more opportunities for profitable trading in a bull market; a bear market typically requires a trader to be more conservative in order to minimize risks and find trades that, while lucrative, are less risky. A Bear Call Spread is a perfect example of such a conservative move to create profits.

stock trading plan is imperative during a bearish period of trading, and it is necessary for the investor to follow his / her plan faithfully. This requires solid stock market technical analysis, stop loss strategies, and utilization of a stock trading system such as Japanese Candlesticks. This system, which was utilized successfully for rice options trading in Japan in the 17th century, helps the investor to evaluate the data obtained through technical analysis. While a stock investing system such as Japanese Candlesticks is invaluable in any period, it is especially valuable in bearish times, since it assists the trader in drawing conclusions about the movements of the market at a time when it is most unpredictable.

A Bear Put Spread is one technique that an investor can use to make money during a bearish market or a market experiencing stock volatility. Through fundamental and technical analysis and learning how to read stock charts, a trader can focus on making money even when the market wants to take money from its investors.


Return to main Options Trading Category

Calendar Spread – Neutral Options Trading Strategy

When an investor is neutral on the market, (neither bullish nor bearish) and is looking to make additional profits from his, or her, portfolio, a Calendar Spread is another way to make money investing in stock. A Calendar Spread is an option spread where the strike prices are the same, but they have different expiration dates. These spreads are also referred to as horizontal spreads or time spreads.

A Calendar Spread involves selling an option with a date that is close to expiring against the purchase of another option, of the same strike price, that has a later expiration date. This stock option trading strategy is perfect for successful traders to add profit to a portfolio by purchasing long-term options that have a reduced cost. Calendar Spreads benefit from time decay because the option sold loses value more quickly than the new one purchased. If the investor’s prediction of a neutral market is correct, the value of the Calendar Spread increases. A Calendar Spread is profitable because it capitalizes on the time value differentials when there is a neutral market.

When the option that is near term expires, several actions are possible. If the investor’s stock market technical analysis still appears to be correct, the trader can hold the long position, if sufficient time remains on it, and sell another short term option against the long position. If there is concern that the market is ready to fall, the investor can close out the long position and take the profits. If the trader is dealing in calls and the indications are for a more bullish market, he / she, can simply continue to hold the long position and realize larger profits in the future. In any case, the cost incurred buying the long position was reduced, or eliminated, by the premiums collected from the option that was sold.

If implemented successfully, the risks involved in a Calendar Spread are minimal. The potential losses are limited to the net premium paid; this is the money spent for the option that was purchased minus the money received for the near term option sold. When implementing a Calendar Spread, it is best to attempt to purchase long term options that are undervalued.

One successful trading strategy in a Calendar Spread is to buy LEAPS (Long Term Equity Anticipation Securities) because they can be purchased much cheaper than actual stock. The risk in this is that if the underlying stock goes down in price, the LEAPS lose value as well. Therefore, a trader hopes that the near term option sold expires without value, and then the investor sells more options farther out and continues to collect premiums. This way, the trader is able to reduce the cost of the LEAPS or actually realize a profit in a successful trade.

As with any stock market strategy, it is important for an investor to review the trading plan and understand the potential risks and rewards from this strategy. A Calendar Spread is an excellent way for trader to make money investing in stock.

Return to main Options Trading Category

Technical Analysis of Stocks

The technical analysis of stocks is the method used by stock traders to evaluate securities through the analyzing of statistics generated by the stock market activity. The intrinsic value of a stock is not important to technical analysts but rather the patterns identifiable on stock charts are what are important. These patterns are important because they signify future activity of stocks. Technical analysis can include identifying chart patterns on stocks charts, or the use of technical indicators, and oscillators. In fact, many use a combination of both of these methods.

The study of stock technical analysis is based on three assumptions. These three assumptions include first, the fact that the market discounts everything. Second, stock price moves in trends, and third, history tends to repeat itself.
When we say that the market discounts everything, this means that the price of a companies stock reflects every possible thing that has ever or could affect that company. Fundamental analysis factors are included in this assumption, but not used when stock trading. They believe that a company’s fundamentals will be reflected in the pricing of that stock so they choose only to study the analysis of price movement.

The second assumption of the technical analysis of stocks is the assumption that price moves in trends. Price movements are believed to follow trends so this means that after a trend has been established, the future price movement is likely to follow the same direction as the trend than to be against it. Most technical analysis trading strategies are based on this assumption.

The third assumption made by technical analysts is the fact that history repeats itself. Many stock charts have been in use and continue to be in use for over 100 years. This gives credibility to this method of trading because price movements have proven to be repetitive in nature. What is interesting about this assumption is what it says about market psychology. Basically, it shows that individuals who participate in trading the stock market tend to react consistently to similar or recurring market stimuli.

The technical analysis of stocks is interesting because traders don’t care if a stock is undervalued. Technical analysts only care about past trading data and where the security might move in the future. This is one of the reasons that so many fundamental analysts view this type of analysis in a negative light.

Technical analysis is a very interesting and effective method used by many of the word’s top stock traders. There is so much to learn about this type of analysis and so many variations that fall under it as well. Continue to learn about fundamental and technical analysis and determine what works for you.


Market Direction

If you look at a chart of the Dow for the last three months, you can logically deduce that you would not have wanted to try to trade this type of market. It is absolutely sideways and it can be seen that candlestick formations did not produce any consistent trends. A bullish candle one day, a bearish candle the next day. That is what is clearly represented utilizing candlestick formations. How does this information benefit anybody when looking in hindsight? Price trends have consistent natures. After an extended indecisive trading period, what is usually expected? This answer is clearly illustrated when you see a flat series of Doji’s. Doji’s represent indecision. A series of Doji’s represent more indecision. However, there is a definite characteristic that can be found after investor sentiment has shown indecision. The next price move, whether bullish or bearish, will show excess  strength.

Knowing that information, simple analysis allows for a high degree of accuracy for projecting which direction that trend may move. As mentioned in previous newsletters, the last three months of trading have produced a Dumpling Top. This could be the prelude to a severe selloff. Investor sentiment is based upon the analysis of existing information/circumstances. Was the Dumpling Top the accumulative analysis, by the major research departments, that a financial crisis might be in the making? Could be, but because most of us do not have large research departments at our beck and call, analyzing the candlestick pattern becomes our tool. The fear, that sold the market off two weeks ago, was modified with the announcement of a potential bailout situation. Now that the bailout program seems to have been worked out, candlestick signals should produce a clear evaluation of what the market sentiment is doing currently.

As seen in the Dow chart, the big bullish Harami indicated the selling had stopped. The confirmation day moved right to the 50 day moving average. The next day made it obvious the 50 day moving average had acted as resistance the first time it was approached. But note what type of signal formation as been produced over the past three days. A Morning Star signal at the tee line. What happens when a major moving average is approached the first time and fails? It will usually have a pullback and then may test that level again. The fact that a Morning star signal has occurred at the tee line and stochastics are still in a slow upward direction provides some evidence that the 50 day moving average will be tested again. Usually the second test will breakthrough.

Technical Analysis of Stocks, DOW

DOW

The power conveyed by bullish signals not only reveal the direction of a price move but they have an added feature. A strong bullish signal indicates the Bulls are taking control. The stronger the signal is, the better the trend can be evaluated even when the market is selling off dramatically. The intrinsic force built into the signals usually result in, at worst, a moderate pullback when the market is selling off. As illustrated in the Petrohawk En ergy Corp. chart, the Kicker signal indicated excessively strong bullish sentiment. The following three days, when the markets were selling off severely, the price of HK held up reasonably well. The same result as illustrated in the VCI chart. A major advantage of candlestick analysis is seeing where the buying strength is coming into a trend and identifying the trend has not reversed when the markets in general are selling off hard. This produces the opportunity to take advantage of the next move once the markets reverse their downward move and start moving back up. Obviously, this is not rocket science. This is merely being able to interpret the relative strength of a price move based upon its reaction to general market moves after a candlestick buy signal has been identified.

Technical Analysis of Stocks, HK

HK
Technical Analysis of Stocks, VCI
VCI

The past three months have been relatively boring as far as investments have been concerned. Is the mortgage bailout situation good for the markets or bad for the markets? Each one of us may have our own opinion. But that opinion does not mean a hill of beans. It is the general consensus of the whole investment community that is the important factor. The candlestick signals will make it visually clear as to how the majority of investors have assessed what the mortgage bailout will do for the economy. Let the market tell you what the market is doing.
 
Free Chat session tonight at 8 PM ET – What can we expect from the results of today’s decisions? Click here for instructions.

Good investing,

The Candlestick Forum Team


Candlestick Precision

This Week’s Special – 50% OFF!!

Scanning Techniques to Higher Profits!
Once taught only to Steve’s private clients; Now available on CD.

Click here for details

Website special reflects current newsletter. If you are reading an archived newsletter you will be directed to Current Website Special.

Candlestick Charts Provide the Most Important Technical Analysis Tools

There are many important technical analysis tools tools – but The most important technical analysis tools are Japanese Candlestick Signals.

Ask yourself this question; How many important technical analysis tools have lasted  for centuries? Hmmm, let me think, Japanese Candlesticks? Well, it certainly isn’t the latest trading craze bombarding your email inbox. The Japanese did not realize they would provide future generations with the most important technical analysis tools for the 21st Century.

Japanese Candlestick charting dramatically accelerates learning important technical analysis required to interepret stock charts. The education process is easy and you can  be successfully trading in no time. Unlike confusing line charts, candlesticks provide a visual depiction for reversals, trends or continuation periods. Successful trading can begin with the 12 Major Signals alone!

Join us, as we educate investors around the world to trade using the most important technical analysis tools available. Learn the 12 Major Signals, the Reversal Signals, and Continuation Patterns. Don’t forget to join Stephen W. Bigalow every Thursday evening for his free stock chat sessions. 

This article introduces the “On Neck Line” a Bearish Continuation Pattern

On Neck Line Candlestick Signal

ON NECK LINE
(ate kubi)

Description

The On Neck Line pattern is almost a ‘meeting line pattern’, but the critical term is ‘almost’. The ON Neck pattern does not reach the previous day’s close; it only reaches the previous day’s low.

Criteria

  1. A long black candle forms in a downtrend.
  2. The next day gaps down from the previous day’s close; howver, the body is usally smaller than one seen in the meeting line pattern.
  3. The second day closes at the low of the previous day.

Pattern Psychology

After a market has been moving in a downward direction, a long black candle enhances the downtrend. The next day opens lower, a small gap down, but the trend is halted by a move back up to the previous day’s low. The buyers in this up move should be uncomfortable that there was not more strength in the up move. The sellers step back in the next day to continue the downtrend.

Back to Continuation Patterns

Candlestick Forum Flash Cards

These unique Flash Cards will allow you to be “trading like the Pro’s” in no time.

Candlestick Analysis Technician – Advanced Chartist

This course is designed for individuals already proficient in recognizing and utilizing Japanese Candlesticks for technical analysis of the markets.

Who should attend this event?

Serious traders looking to increase their proficiency in technical analysis. The Advanced Chartist workshop builds upon your knowledge base to take you to a higher level of expertise.

Registered Reps interested in furthering his/her understanding of technical analysis techniques for evaluating the overall market or individual security.

To assure the education process is reinforced and put into practice all seminar participants receive a 3-Month paid subscription as a Candlestick Forum Member.

Your Instructor for this workshop

Bigalow Bio Photo

Stephen W. Bigalow

Mr. Bigalow has over 27 years of investment experience, including eight years as a stockbroker with major Wall Street firms: Kidder, Peabody & Company; Cowen & Company; and Oppenheimer & Company.

He is the owner of the Candlestick Forum, LLC, an educational website to train the investing public on financial technical analysis.

Mr. Bigalow holds a Business & Economics Degree from Cornell University.

Candlestick trading books by Stephen Bigalow

Author of‘Profitable Candlestick Trading”, published by John Wiley & Sons in January 2002 and “High Profit Candlestick Patterns” published in 2005.

Contributor to professional trade publications such as;  Stocks & Commodities Magazine; Futures Magazine; Technical Analyst Magazine, and others.

Candlestick Analysis Technician – Advanced Chartist – Workshop Outline
Combining Candlesticks with other Technical Indicators

The professional investor makes sure to have as many probabilities in his favor when selecting exactly where to put limited capital. Combine candlesticks with other technical analysis, such as  Bollinger Bands, stochastics, moving averages, wave analysis, and Fibonacci retracement.

Advanced Pattern Recognition and Execution

Breakout Patterns – Knowing when to get on board and when to take profits

Cradle & Belt Hold Patterns – Easy-to-identify and foretells of a dramatic change about to take place

Fry Pan Bottom – the pent-up power created in this signal can produce very compelling profits.

Trading Gaps – Gaps represent enthusiasm to get into a position to the point that investors will pay prices away from any of the previous day’s trading range. Great for identifying panic selling at the bottom and exuberant buying at the top.

J-Hook Pattern – How to differentiate between profit taking and a full-scale reversal.

Technical Analysis Courses Should Utilize the Candlestick Signals

Technical analysis courses usually educate investors with masses of amounts of information. Technical analysis courses are usually directed towards providing numerous analytical techniques.  Unfortunately, many of these techniques are not crucial for pinpointing investment information. Most technical analysis courses instruct investors on watching indicators that other investors usually watch. The benefit of utilizing candlestick signals is being able to instantly evaluate what investor sentiment is doing at those levels that everybody else is watching.

The information that is built into candlestick signals reveal immediately what investment sentiment is doing.  If a candlestick buy signal occurs right on a major technical level, a level that many other investors are watching, the candlestick investor has the advantage of visually seeing the confirmation immediately of that level.  Other investors may require confirmation that comes in the form of additional buying.  That is a benefit to the candlestick investor.  They can get in before the rest of the technical investors get in.  There are many good technical analysis courses available. Click here to view training courses.   An investor that is planning to take technical analysis courses should learn candlestick signals before hand.  This knowledge will make any technical analysis courses much easier to comprehend.

The 12 major candlestick signals provide an immense amount of technical information. Learning the stock market becomes much easier when utilizing the correct analytical tools.  Applying the candlestick information to any information learned in technical and analysis courses will dramatically speed the positive results to investors accounts.  Learn each of the major signals.  The information that is conveyed in each one of the signals provides insights into price trends not found in most technical analysis courses.  The candlestick signals should be the basis of an investors analytical toolbox.

The Dark Cloud signal is a signal that tells an obvious reversal of a trend. It is name because it looks like a dark cloud over a nice bright sunny uptrend.

Dark Cloud

DARK CLOUD COVER

Description

The dark Cloud Cover is the bearish counterpart to the Piercing pattern. The first day of the pattern is a long white candle at the top end of a trend. The second day’s open is higher that the high of the previous day. It closes at least one-half way down the previous day candle, the further down the white candle, the more convincing the reversal. Remember that a close at or below the previous day’s open turns this pattern into a Bearish Engulfing pattern. Kabuse means to get covered or to hang over.

Criteria

  1. The body of the first candle is white, the body of the second candle is black.
  2. The up-trend has been evident for a good period. A long white candle occurs at
    the top of the trend.
  3. The second day opens higher than the trading of the prior day.
  4. The black candle closes more than half-way down the white candle.

Signal Enhancements

  1. The longer the white candle and the black candle, the more forceful the reversal.
  2. A higher the gap up from the previous days close, the more pronounced the reversal.
  3. The lower the black  candle closes into the white candle, the stronger the reversal.
  4. Large volume during these two trading days is a significant confirmation

Pattern Psychology

After a strong up-trend has been in effect, the atmosphere is bullish. Exuberance sets in. They gap the price up. The bears start to show up and push the price back down. It finally closes at or near the lows for the day. The close has negated most of the previous days gains. The bulls are now concerned. They obviously see that the uptrend may have stopped. This signal makes for a good short, with a stop being the high of the black candle day. Notice that if the Dark Cloud Cover were to close lower, below the open of the previous day, it becomes a Bearish Engulfing pattern. The Bearish Engulfing pattern has slightly stronger bearish implications.

Using candlesticks signals with other technical analysis greatly enhances the ability to recognize what the candlestick charts are revealing. Use of valuable information provided in the 12 major signals.  They will benefit you for the rest of your investment career.

Common Options Trading Terms

Ask Price

The price at which a seller is offering to sell an option or stock.

Assignment

The receipt of an exercise notice by an option writer (seller) that obligates him to sell (in the case of a call) or purchase (in the case of a put) the underlying security at the specified strike price.

At-the-money

An option is at-the-money if the strike price of the option is equal to the market price of the underlying security.

Automatic Exercise

A protection procedure whereby the Options Clearing Corporation attempts to protect the holder of an expiring in-the-money option by automatically exercising the option on behalf of the holder.

Bearish

An adjective describing an opinion or outlook that expects a decline in price, either by the general market or by an underlying stock, or both.

Bear Spread

An option strategy that makes its maximum profit when the underlying stock declines and has its maximum risk if the stock rises in price. The strategy can be implemented with either puts or calls. In either case, an option with a higher striking price is purchased and one with a lower striking price is sold, both options generally having the same expiration date.

Beta

A measure of how a stock’s movement correlates to the movement of the entire stock market. The Beta is not the same as volatility.

Bid Price

The price at which a buyer is willing to buy an option or stock.

Box Spread

A type of option arbitrage in which both a bull spread and a bear spread are established for a near-riskless position. One spread is established using put options and the other is established using calls. The spread may both be debit spreads (call bull spread vs. put bear spread) or both credit spreads ( call bear spread vs. put bull spread). Break-Even Point–the stock price (or prices) at which a particular strategy neither makes nor loses money. It generally pertains to the result at the expiration date of the options involved in the strategy. A “dynamic” break-even point is one that changes as time passes.

Bullish

Describing an opinion or outlook in which one expects a rise in price, either by the general market or by an individual security.

Bull Spread

An option strategy that achieves its maximum potential if the underlying security rises far enough, and has its maximum risk if the security falls far enough. An option with a lower striking price is bought and one with a higher striking price is sold, both generally having the same expiration date. Either puts or calls may be used for the strategy.

Butterfly Spread

An option strategy that has both limited risk and limited profit potential, constructed by combining a bull spread and a bear spread. Three striking prices are involved, with the lower two being utilized in one spread and the higher two in the opposite spread. The strategy can be established with either puts or calls; there are four different ways of combining options to construct the same basic position.

Call

An Option contract that gives the holder the right to buy the underlying security at a specified price for a certain, fixed period of time.

Cash-Based

Referring to an option or future that is settled in cash when exercised or assigned. No physical entity, either stock or commodity, is received or delivered.

Cash Settlement

The process by which the terms of an option contract are fulfilled through the payment or receipt in dollars of the amount by which the option is in-the-money as opposed to delivering or receiving the underlying stock.

CBOE

The Chicago Board Options Exchange; the first national exchange to trade listed stock options.

Class

A term used to refer to all put and call contracts on the same underlying security.

Closing Purchase

A transaction in which the purchaser’s intention is to reduce or eliminate a short position in a given series of options.

Closing Sale

A transaction in which the seller’s intention is to reduce or eliminate a long position in a given series of options.

Closing Transaction

A trade that reduced an investor’s position. Closing buy transactions reduce short positions and closing sell transactions reduce long positions.

Combination

Any position involving both put and call options that is not a straddle.

Cover

To buy back as a closing transaction an option that was initially written.

Covered

A written option is considered to be covered if the writer also has an opposing market position on a share-for-share basis in the underlying security.

Covered Call

An option strategy in which a call option is written against long stock on a share-for-share basis.

Covered Call Option Writing

A strategy in which one sells call options while simultaneously owning an equivalent position in the underlying security or strategy in which one sells put options and simultaneously is short an equivalent position in the underlying security.

Covered Put Write

A strategy in which one sells put options and simultaneously is short an equal number of shares of the underlying security.

Covered Straddle

An option strategy in which one call and one put with the same strike price and expiration are written against 100 shares of the underlying stock.

Cycle
The expiration dates applicable to various classes of options. There are three cycles: January/April/July/October, February/May/August/November, and March/June/September/ December.


Return to Options Trading Main Page

If you did not find the term you were looking for here, you might try the CBOE  Chicago Board Options Exchange. They have a broad selection of option terms and trading tools.

Stock Market Strategies Use Candlestick Formats for High Profits

How to Trade the Bullish Harami.

Most stock market strategies involve complicated approaches and formulas. Candlestick analysis provides a platform for making stock market strategies very simple to implement. Unfortunately, most investors put money into the markets without any concern for stock market strategies. This not only skews many investors investment perceptions, it also delays the process for how to learn to trade the stock market correctly. Stock market strategies should be incorporated into an investors learning process from the very beginning.

Candlestick signals provide the information that can put investors on the right track from the beginning. Taking advantage of the investor knowledge incorporated into candlestick signals allows an investor to eliminate bad habits. Stock market strategies should involve investment programs that put the probabilities of being in a correct trade in an investor’s favor. To simplify the process, if an investor merely learns the 12 major candlestick signals, the correct investor habits will be much easier to implement.

Successful stock market strategies involve investment practices that can be accounted for and constantly improve. The 12 major candlestick signals provide a framework for establishing a high probability trades. They also convey to an investor when the investor sentiment is not working properly. Most stock market strategies pay little attention to procedures on losing trades. The candlestick signals provide an expected result. When they do not occur, losses can be cut short . Funds can then be moved on to high probability situations.

Utilizing the 12 major signals establishes a knowledge base for what should happen in the future. Knowing the investor sentiment that developed the signals provides a much better insight for investors to determine successful trade situations. The Bullish Harami is an example of visual statistic analysis. Upon witnessing a bullish Harami at the end of a downtrend, an investor has a good idea of what to expect. This major signal becomes a vital information packed analytical tool.

HARAMI

BULLISH HARAMI

Bullish Harami

Description

The Harami is an often seen formation The pattern is composed of a two candle formation in a down-trending market. The body of the first candle is the same color as the current trend. The first body of the pattern is a long body, the second body is smaller. The open and the close occur inside the open and the close of the previous day. It’s presence indicates that the trend is over.

The Japanese definition for Harami is pregnant woman or body within. The first candle is black, a continuation of the existing trend. The second candle, the little belly sticking out, is usually white, but that is not always the case. The location and size of the second candle will influence the magnitude of the reversal.

Criteria

  1. The body of the first candle is black, the body of the second candle is white.
  2. The downtrend has been evident for a good period. A long black candle occurs at the end of the trend.
  3. The second day opens higher than the close of the previous day and closes lower than the open of the prior day
  4. Unlike the Western “Inside Day”, just the body needs to remain in the previous days body, where as the “Inside Day” requires both the body and the shadows to remain inside the previous days body.
    For a reversal signal, further confirmation is required to indicate that the trend is now moving up.

Signal Enhancements

  1. The longer the black candle and the white candle, the more forceful the reversal.
  2. The higher the white candle closes up on the black candle, the more convincing that a reversal has occurred despite the size of the white candle.

Pattern Psychology

After a strong down-trend has been in effect and after a selling day, the bulls open the price a higher than the previous close. The shorts get concerned and start covering. The price finishes higher for the day. This is enough support to have the short sellers take notice that the trend has been violated. A strong day the next day would convince everybody that the trend was reversing. Usually the volume is above the recent norm due to the unwinding of short positions.

Learning the 12 major signals makes the analysis of market trends and price trends very easy. They use of candlestick charts greatly enhances the speed in which somebody can analyze a trend correctly. The candlestick patterns are graphic statistical analysis. Japanese Rice traders have successfully use the signals for centuries. Learning how to invest in the stock market becomes much easier when you got the probabilities put in your favor.