The Doji is one of the most revealing signals in Candlestick trading. It clearly indicates that the bulls and the bears are at an equilibrium, a state of indecision. The Doji appearing at the end of an extended trend has significant implications. The trend may be ending. Just this fact alone creates a multitude of investment programs that produce inordinate profits. What is the best method for making big trading profits? Knowing the direction of a trading entity and the strength of that move. Candlestick analysis perfects that trading strategy. Candlestick formations reveal high probability profitable reversals. Hundreds of years of investing refinement has proven that point.
The Japanese say that whenever a Doji appears, always take notice. A well-founded rule of Candlestick followers is that when a Doji appears at the top of a trend, in an overbought area, sell immediately. Conversely, a Doji seen at the bottom of an extended downtrend requires buying signals the next day to confirm the reversal. Otherwise, the weight of the market could take the trend lower.
What could be better than knowing which way a market or a trading entity is going to move? One additional important element! How powerful is that new move going to be? A powerful indication that a strong trend is beginning is the appearance of a “window” or gap. Gaps (Ku) are called windows (Mado) in Japanese Candlestick analysis. A gap or window is one of the most misunderstood technical message. It is usually advised by a good percentage of investment advisors to not buy after a gap. This is very bad advice. The gaps will reveal powerful high profit trades. Candlestick signals, correlated with the appearance of a gap, provide valuable profit making set-ups.
The ramification of a gap pattern is an important aspect to Japanese Candlestick analysis. Some traders make a living trading strictly off of gaps. Dissecting the implications of a gap/window makes its appearance easy to understand. Once you understand why a gap occurs in different locations in a trend, taking advantage of what the gaps reveal becomes highly profitable. Where a gap occurs is important.
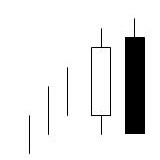
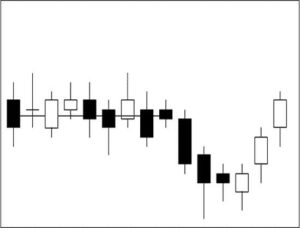
Consider what a window or gap represents. In a rising market, it illustrates prices opening higher than any of the previous day’s trading range. What does this mean in reality? During the non-market hours, something made owning this stock tremendously desirable. So desirable that the order imbalance opens the price well above the prior day’s body as well as the high of the previous day’s trading range (the same is true for a bearish indication, gapping down from the previous range). As seen in Figure 1, note the space between the high of the previous day and the low of the following day.
Gap Formation
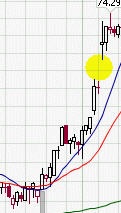
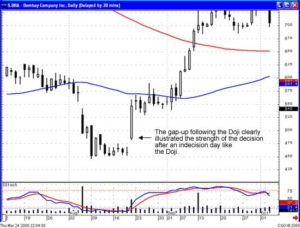
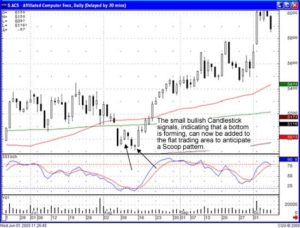
Witnessing a gap or window at the beginning of a new trend produces profitable opportunities. Seeing the gap formed at the beginning of the trend reveals that on a reversal of direction, the buyers have stepped in with a great amount of zeal. A common scenario is witnessing a prolonged downtrend. A Doji appears, indicating that the selling may have stopped. To verify that the downtrend has stopped, indication of buying the next day is required. This can be more pronounced if the next day has a “gap” up move.
Many investors are apprehensive about buying a stock that has popped up from the previous day’s close. A risky situation! Yet a Candlestick investor has been forewarned that the trend is going to change, using a signal as that alert. A gap up illustrates that the force of buying in the new upward trend is going to be strong. The enthusiasm shown by the buyers trying to get into the stock demonstrates that the new trend should have a strong move to it. Use that gap as a strength indicator.
Doji and Gaps at the Bottom
Knowing that a gap represents an enthusiasm for getting into or out of a stock position creates the forewarning that a strong profit potential has occurred. Where is the best place to see rampant enthusiasm when you are buying? At that point you are buying, near the bottom. Obviously, seeing a potential Candlestick buy signal at the bottom of an extended downtrend is a great place to buy. In keeping with the concepts taught in Candlestick analysis, we want to be buying stocks that are already oversold to reduce the downside risk. What is even better is the evidence that buyers are very anxious to get into the stock.
Note in Figure 2, XMM, Cross Media Marketing, after Doji/Harami’s, one on November 5th, another on December 18, 2001, that the gap up the next day clearly indicated that the trend had stopped. The resulting trades produced 28.5% and 49.3% respectively. Probabilities demonstrate that a gap up is going to preclude an advance in price under these circumstances. Unofficially, candlestick statistics illustrate an 80% and better probability that a trade will be successful when stochastics are oversold, a Candlestick buy signal appears, and prices gap up. (The Candlestick Trading Forum provides candlestick statistics that they represent as unofficial. Even though over fifteen years of observations and studies have been involved, no formal data gathering programs have been fully operated. However, currently the Candlestick Trading Forum is involved with two university studies to quantify signal results).
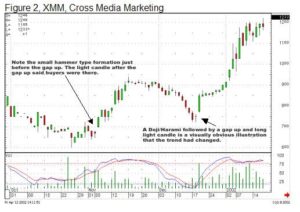
XXM Gap Trading
Having this statistic as part of an investors arsenal of knowledge creates opportunities to extract large gains out of the markets. The risk factor remains extremely low when participating in these trade set-ups.
Many investors are afraid to buy after a gap up. The rationale being that they don’t like paying up for a stock that may have already moved 3%, 5%, 10% already that day. But this rationale is unimportant to the Candlestick investor. Witnessing a Candlestick buy signal prior to the gap up provides a basis for aggressively buying the stock. If it is at the bottom of a trend, that 3%, 5%, 10% initial move may just be the beginning of a 25%, 30%, 40% move or a major trend that can last for months.
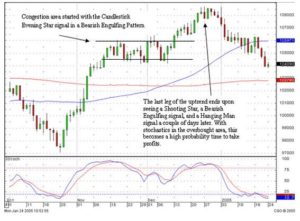
Doji and Gaps at the Top
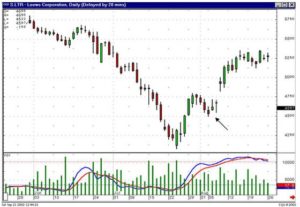
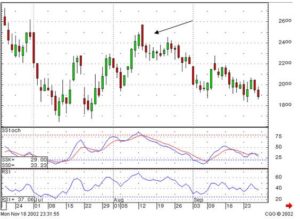
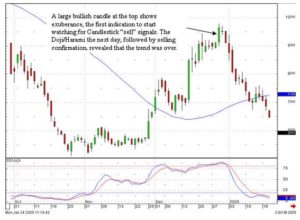
Gaps and windows reveal a strong force in a direction whether it is bullish or bearish. The Candlestick signal is the prime factor for looking for a reversal. A gap down after a sell signal verifies that the signal was effective. The Japanese say that a Doji at the top of a sustained trend warrants immediate liquidation. That becomes more evident if the prices gap down the next day. Note in Figure 3, ISSI, Integrated Silicon Solutions, the Doji at the top, with stochastics in the overbought area, would have been the warning. If investors were long, upon seeing the Doji, they should liquidate at the first sign of a weaker open. The gap down the next day would have been more than enough to convince the Candlestick investor that the sellers had stepped in.
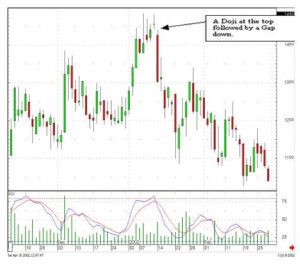
ISSI, Integrated Silicon Solutions
The investor that does not utilize the information revealed by gaps/windows is leaving massive profits for somebody else. Just as the Candlestick signals have different meanings at different points in a trend, the gaps have different messages at certain points in a trend. The Candlestick signals, signals that have imbedded information in their formation, combined with a gap/window, also a signal that implies a magnitude of buying or selling interest, creates one of the most powerful investment tools found in technical analysis. The major function of technical analysis is to find trade patterns that put probabilities highly in our favor. Hundreds of years of profitable observations have identified the Doji as a prime reversal signal. Gaps have demonstrated many times over that they are the driving force of a trend direction. The combination of these two indicators produce profits that cannot be ignored.
Training Tutorials
Gap Trading