Although commodity prices may or may not repeat themselves commodity price patterns do. In fact, it is because history repeats itself that technical analysis tools work to predict the next move in a commodity price.
Certainly commodities traders have long had an intuitive sense about the commodities markets. However, it was not until Japanese rice traders developed Candlestick charting techniques in the days of the Samurai more than three centuries ago that there was an organized and teachable system for commodity trading. Today a beginning commodity trader can take commodity and futures training to learn about Candlestick trading tactics as well as modern technical analysis terms for the same Candlestick pattern formations that guided traders centuries ago.
The basic price of a commodity comes from the law of supply and demand. Inflation will make commodity prices higher in dollars even when a commodity such as gold will still buy the same amount of food or a house for the same weight that it did a century ago. Predicting changes in the basic price of a commodity is a matter of fundamental analysis. Following commodity price patterns is a matter of technical commodity analysis.
Commodities are prone to cyclical price changes. Copper futures, for example, will go down in price during an economic recession and up when traders see a recovery on the way. Corn futures may vary throughout the year as concerns about the next harvest prompt hedging by growers and buyers. These commodity price patterns are longer term, typically yearly. Commodity price patterns that emerge from the actions of thousands of traders develop over months, weeks, days, and even hours or minutes.
Trend trading of commodities is possible when the market comes to believe that the future price of a commodity and its commodity futures price will gradually go up or down. Traders will profit from buy and selling or short selling and buying commodity futures when successfully trading a trend. Doing this successfully requires that the trader follow the market and market news attentively, studies commodity price patterns, and compares current price patterns to technical analysis charts, whether they are of the modern variety or modern versions of Candlestick charts.
Just as the use of technical analysis to verify that a trend is likely to continue the trader will use technical methods to anticipate a market reversal. Although it is the basics of commodity production and the market for the commodity that ultimately decides price it is the combined actions of many traders that generate commodity price patterns. Being able to “see the forest for the trees” is an old expression for recognizing trends or the big picture. This is what Candlestick basics have done for centuries. Long before today’s statistical analysis methods were even dreamed of traders dutifully recorded commodity prices and came to recognize patterns that predicted the market’s next move. The old saying that using Candlesticks allows the trader to let the market tell him what the market will do is as true today as it was in the days of the Samurai.
Market Direction
A bounce or a reversal? How would you tell the difference? If you add all the indicators together, you get a much more clear picture of what is occurring in investor sentiment. Friday saw a bullish trading day. The Dow was up 130 points. This is not an insignificant bullish move. However, there are indicators that would confirm whether a reversal have occurred for a bounce had occurred. There were a number of indications that led to anticipating this was just a bounce in a downtrend. Although the NASDAQ formed a Piercing Signal right on the 200 day moving average, the Dow did not form a true signal. It was not a Bullish Harami because it opened lower than Thursday’s close. That might be splitting hairs, but there were other indications the markets had not reached bottom yet.
The stochastics are still heading in a downward direction. The bullish trading on Friday did not put a wrinkle in their trajectory. The NASDAQ had experienced some gap downs over the past few days in its formation of a bearish J-hook pattern. When we understand the significance of a gap down in price, it makes the trend analysis easier to evaluate. It would be very unusual to have the sellers gapping prices down, indicating a strong selling force, and then the markets reverse well before the stochastics indicate an oversold condition. The lack of strength in today’s follow-through revealed the Bulls had not yet taken over control of the trend. Continue to hold short positions and short funds until a strong reversal signal appears in the appropriate areas of the trend.
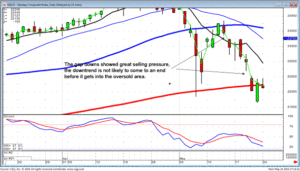
NASDAQ
Being able to analyze market trends provide important information when trading commodities. The weakness in the cattle market is due to the anticipation that if there is problems in the world economies, the higher cost meats are going to be less attractive to consumers. Note the rounding top, the Dumpling top formation in the feeder cattle chart. It can be seen that when there was bullish movements in the stock market Friday, the downtrend in price of Feeder Cattle became indecisive. Once the bearish trading came back into the equity markets, cattle prices sold off again.
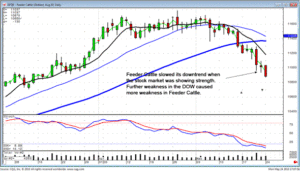
FC
This weekend the Candlestick Forum presented a two day training on how to analyze and correctly position oneself in commodity trading. Candlestick signals and patterns work extremely well when trading commodities. The Japanese Rice traders made fortunes trading the most basic of all commodities, rice! Trading commodities has advantages. The perception that commodities are very risky becomes greatly diminished when applying candlestick signals to the trading program. There will be more commodity picks available in the members area. This may not be a daily occurrence due to the limited number of commodities. There are very simple procedures for establishing commodity trades that have a high probability of moving in the correct direction immediately. This greatly relieves the emotional anxiety of being in a commodity position.
Chat session tonight at 8 PM ET
Good Investing,
The Candlestick Forum Team
July 2010
2-Day- Training Webinars
Candlestick Technical Analysis Webinar – July 10 & 11
Options Training Webinar – July 31st & August 1st
Website special reflects current newsletter. If you are reading an archived newsletter you will be directed to Current Website Special.
Speak Your Mind