Stock investing becomes much easier with an established trading program. Candlestick analysis is a highly productive and easy trading method for learning successful stock investing. Candlestick signals not only provide a visual alert for when a reversal is likely to occur in a trend, but the signals themselves hold an immense amount of investment information. Understanding what makes those signals work effectively provides great insights into stock investing psychology. Candlestick charts visually depict the investment psychology.
Once an investor understands why a signal was formed, stock investing strategies become very easy to implement. Fortunately, through the past few years, the teaching of the Candlestick signals has become greatly simplified. As you should have discovered on the Candlestick Forum website, Steve Bigalow has reduced the learning process of Candlestick analysis down to 12 major signals. Understanding the effects of those 12 major signals allows the investor to concentrate on high profit situations.
Although there are many stock investing theories and trading programs, Candlestick signals should be the basic building block for enhancing all other trading programs. The reason is that the stock market data through Candlestick signals tell you exactly what investor sentiment is doing “right now”. Utilizing the information conveyed from the major signals, the analysis of potential high profit patterns becomes further enhanced. This past couple of weeks the Fry Pan Bottom pattern and the Scoop pattern have been discussed during the weekly chat sessions.
They have been illustrated because they have been producing some very profitable trades in the recent past.
BOOM, for example, has produced over a 100% return this past month. ANTP provided a good 40% return and may be in the process of producing some more. These patterns become easier to identify when visually recognizing what the Candlestick signals are indicating.
The Bullish Engulfing signal was also discussed because of its importance when witnessed in the Dow this week.
The Bullish Engulfing signal is one of the major signals that can produce consistent high profit situations.
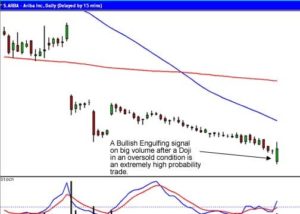
The Bullish Engulfing pattern at a bottom of a trend provides significant information. Notice where the ARBA price opened when forming the Bullish Engulfing signal. It gapped down! In an extended downtrend, where do most investors panic sell? They sell at the bottom! The question becomes when everybody is panic selling, who is buying?
A Doji formed on Thursday, followed by a Bullish Engulfing signal on Friday with stochastics in the oversold condition and big volume. This is the prime set-up for a reversal. What would be the first potential target? The answer is $9, a 23% potential gain. From there, the next target is the $10 level and if it breaks through there, possibly the $12 level, filling the gap.
Will it get to any of those levels? Who knows? But the appearance of a Bullish Engulfing signal in an oversold condition and with high volume provides an extremely high probability that the uptrend should have started. Does that guarantee a 23%, 30%, 75% return? No, but it does provide a high probability of producing a profitable trade.
ARBA
Speak Your Mind