Stock market technical analysis is dramatically improved when applying Candlestick signals. Working off the premise that the Candlestick signals are the cumulative knowledge of everyone who is buying or selling during a specific time frame, the evaluation of technical trends becomes better formatted when understanding what the signals are telling you. The effectiveness of Candlestick signals in stock market technical analysis is more clearly evident in the past couple of weeks when experiencing world events such as terrorist attacks.
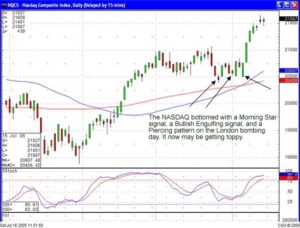
Stock market technical analysis using Candlestick analysis allowed for a trading strategy on the morning of the bombings. The Candlestick signals indicate what investor sentiment is doing during any particular time frame. What were the market conditions on the morning of the London bombings? The stochastics were in the oversold condition. The previous two weeks had been showing Candlestick bottoming signals. Two sets of Morning Star signals had formed as stochastics had approached the oversold condition. This stock market technical analysis, without an extracurricular world event, was indicating that investor sentiment was starting to turn bullish once more.
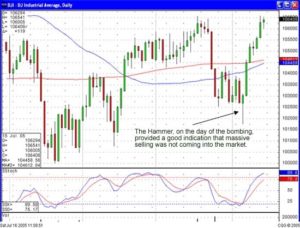
With this stock market technical analysis in mind, upon hearing the news of the London bombings, an event that could dramatically influence investor sentiment, a trading strategy could be implemented. Knowing that the markets were already in a short-term oversold condition, where the Dow had appeared to hold the 10,300 level, a simple analysis could be made after hearing the news. Our stock market technical analysis indicated to allow the Candlestick signal of that day dictate what our strategy should be.
Utilizing stock market technical analysis in this manner becomes very simple. What was going to be the Candlestick formation that day? The markets immediately sold off that morning. They did so with good strength very early in the day. What should become the investment strategy? Our stock market technical analysis already told as we are in an oversold condition. Our Candlestick signals indicated that buying had been trying to start for the past two weeks. Prices were already down big early in the day. As we had advised in our members’ morning comments, it was a day to hold the long positions until we saw what Candlestick formation was going to occur. The candlestick charts clearly identify when signals may occur.
Had the day closed at the lower end of the trading range, it would have provided a completely different scenario than the formation of a Hammer signal. The Hammer signal revealed that investor sentiment was not in a massive selling mode. This provided the signal to buy aggressively upon seeing more strength the following day.
HAMMERS
(Takuri)
Description
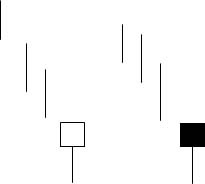
The Hammer is composed of one candle. It is easily identified by the presence of a small body with a shadow at least two times greater than the body. Found at the bottom of a downtrend, this shows evidence that the bulls have started to step in. The color of the small body is not important but a white candle has slightly more bullish implications than the black candle. A positive day is required the following day to confirm this signal.
Criteria
- The lower shadow should be at least two times the length of the body.
- The real body is at the upper end of the trading range. The color of the body is not important although a white body should have slightly more bullish implications.
- There should be no upper shadow or a very small upper shadow.
- The following day needs to confirm the Hammer signal with a strong bullish day.
Signal Enhancements- The longer the lower shadow, the higher the potential of a reversal occurring.
- A gap down from the previous day’s close sets up for a stronger reversal move provided the day after the Hammer signal opens higher.
- Large volume on the Hammer day increases the chances that a blow off day has occurred.
Pattern Psychology
After a downtrend has been in effect, the atmosphere is very bearish. The price opens and starts to trade lower. The bears are still in control. The bulls then step in. They start bringing the price back up towards the top of the trading range. This creates a small body with a large lower shadow. This represents that the bears could not maintain control. The long lower shadow now has the bears questioning whether the decline is still intact. A higher open the next day would confirm that the bulls had taken control.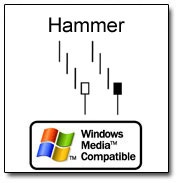
Market Direction – The series of Morning Star signals, confirmed with the bullish candle after the London bombing Hammer day, started the market uptrend. Friday, an option expiration day, started to show some toppiness. Both the Dow, the NASDAQ, and the S&P 500 showed indecisive trading. This was not unexpected on a Friday in the summertime and on an options expiration day. However, the stochastics in all of the indexes have now reached the overbought area.
It would not be unusual to see some pullback occurring from these levels. This pullback would be more of a profit-taking process versus a reversal. The uptrend appears to be intact. The fear of the feds continuing to raise interest rates as well as oil prices in high trading areas has not produced any euphoric buying as of yet. This becomes a good indicator that the uptrend should persist.
If a pullback should start appearing, with the evidence of selling starting on Monday or Tuesday, a logical pullback target would be the 50 day and 200 day moving averages. Weakness, confirming Friday’s Doji signals, would be the time to be taking some profits from this recent rally. The strategy, after the test of the MA’s, would be to analyze which sectors appear to be the next strong movers.
If the markets start pulling back from here, anticipating that the markets are in an uptrend, the Candlestick signals make it very easy to identify when the pullback is over.
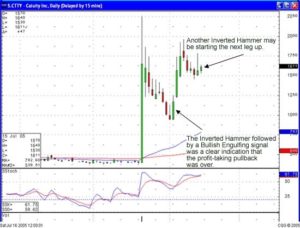
As illustrated in our recommendation of CTTY, once the breakout occurred and the profit-taking came into the stock, the Inverted Hammer, followed by a Bullish Engulfing signal, made for a very profitable trade. CTTY formed another Inverted Hammer on Thursday with some confirmed buying on Friday. Watch for the next leg up.
There are always opportunities being revealed when Candlestick signals are used for finding high profit trades.
Speak Your Mind