The Harami is one of the major candlestick signals in Japanese Candlestick analysis. There are approximately 50 to 60 signals in the Candlestick signal universe. The biggest deterrent for many investors trying to learn the candlestick signals is a large number of signals. Most investors complain that there are too many to learn. Mastering Candlestick analysis can be done very easily by learning the 10 major signals. Knowing the signals, and understanding how those signals are formed, provide investors with a tremendous insight into what goes on an investor sentiment at reversal areas in a trend. Being able to identify the major signals and understand the investor sentiment that created those signals allows an investor to project market reversals with a high degree of accuracy. This is based upon hundreds of years of actual observations by Japanese rice traders. Simple logic tells us that if these signals did not work, they would not be here for us to view after centuries of use.
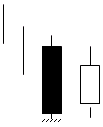
All the candlestick signals do not need to be memorized. Most signals do not occur often enough to use mental energy for identifying them. The 10 major signals will produce more investment opportunities than most investors will require. The Harami is considered one of the major signals. The Bullish Harami is a two formation pattern. The first formation is usually a large black candle appearing at the end of a downtrend. The end of a downtrend is represented by stochastics being in the oversold area. The Bullish Harami is formed by the second candle opening above the previous day’s close and closing below the previous day’s open. In Japanese, Harami means pregnant woman. As you see in the illustration, the black candle is the woman’s body, the white candle is her belly sticking out.

Harami
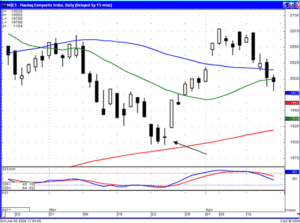
A Harami at an important support level, as seen in the Nasdaq chart, is more effective when a Doji is part of the two day Harami signal. Once the trading came near the 200-day moving average, the Doji/Harami being confirmed with a gap-up the next day becomes a very high probability projection that the trend has reversed.

NASDAQ Harami
Excerpt from the book “Profitable Candlestick Trading”
Description
The Harami is an often seen formation. The pattern is composed of a two candle formation in a down-trending market. The body of the first candle is the same color as the current trend. The first body of the pattern is a long body, the second body is smaller. The open and the close occur inside the open and the close of the previous day. It’s presence indicates that the trend is over.
The Japanese definition for Harami is pregnant woman or body within. The first candle is black, a continuation of the existing trend. The second candle, the little belly sticking out, is usually white, but that is not always the case (see Homing Pigeon). The location and size of the second candle will influence the magnitude of the reversal.
Criteria
- The body of the first candle is black, the body of the second candle is white.
- The downtrend has been evident for a good period. A long black candle occurs at the end of the trend.
- The second day opens higher than the close of the previous day and closes lower than the open of the prior day.
- Unlike the Western “Inside Day”, just the body needs to remain in the previous day’s body, where as the “Inside Day” requires both the body and the shadows to remain inside the previous day’s body.
- For a reversal signal, further confirmation is required to indicate that the trend is now moving up.
Signal Enhancements
- The longer the black candle and the white candle, the more forceful the reversal.
- The higher the white candle closes up on the black candle, the more convincing that a reversal has occurred despite the size of the white candle
Pattern Psychology
After a strong down-trend has been in effect and after a selling day, the bulls open the price a higher than the previous close. The short’s get concerned and start covering. The price finishes higher for the day. This is enough support to have the short sellers take notice that the trend has been violated. A strong day after that would convince everybody that the trend was reversing. Usually the volume is above the recent norm due to the unwinding of short positions.
End of excerpt
The significance of a Harami is that it tells us that the selling has stopped. As far as a trend reversal, the Harami has excellent capabilities of indicating how strong the new trend to the up side will be. For example, if a Harami opens and closes at the very low end of the previous day’s black candle, the trajectory of the new uptrend may be very flat or slow. If the Harami closes midway into the previous black candle, the up words trend will be moderately strong. If the Harami closes near the top of the previous day’s black candle, the new uptrend may be very strong. In this way, a Harami can act as a barometer for the buying sentiment in the new uptrend.
A Harami can be additionally determined if it appears at a significant technical level such as a trend line or a moving average line. For example, witnessing a Harami that is formation in an oversold condition becomes much more significant if it is also forming on a 50-day moving average or a 200-day moving average. This becomes instant verification that what most western technical analysis is using for a possible support level is becoming instantly verified by a Candlestick signal. The Candlestick signal creates an immediate buy point whereas other technical analysis may need additional time to confirm. The candlestick analyst can profit immediately.
The Bearish Harami is exactly opposite the Bullish Harami. After an uptrend and the stochastics are in the overbought area, there will be one last white candle. The following day opens below the previous day’s close and closes above the previous day’s open. This will form a black candle inside the previous day’s white candle. This essentially tells us that the buying has stopped. Confirmation is seeing the next day open weaker.

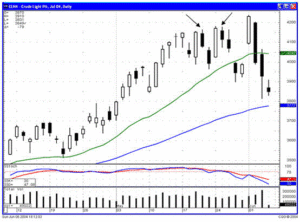
Notice the Bearish Harami’s in the Crude Oil chart. In late May, the experts were projecting that oil prices could go to $60.00 per barrel. This analysis was prompted by Crude Oil going above $40.00 a barrel for the first time in decades. However, every time the price would push above the $40.00 per barrel price, the Harami’s revealed that the sellers were stepping in. What is the smart money doing? You do not need extensive research team to delve into what is happening in each industry, stock or commodity. The signals tell what is the actual investor sentiment.
Just like the Bullish Harami, the Bearish Harami will indicate the magnitude of the new downtrend by where it closes in the previous day’s candle. A very small candle at the top end of the previous day’s white candle would indicate every slow downtrend whereas they close at the lower end of the previous day’s white candle would indicate that the selling pressure is going to be much stronger.
Understanding what the Harami signal is representing, the better the opportunity is to profit from the signal. The results, from witnessing a Harami, are fairly predictable. The Japanese rice traders established the statistical analysis to warrant the signals to still be in effect after centuries of use. Use that information to your advantage.
Training Tutorial available on The Harami
Speak Your Mind