Trading momentum stocks works for two basic reasons. It has been demonstrated that stocks that have been performing well tend to continue to outperform the rest of the stock market. Theorists argue as to whether this phenomenon is due to irrational investor behavior or a fundamental reason that these stocks are better managed companies that continually prosper while others fail. For the trader or investor trading momentum stocks the theory does not matter. What matters is having an efficient system of stock market analysis for recognizing and trading stocks that seem to have momentum.
When trading cyclical stocks a day trader will look for support and resistance zones. Day traders will look at Candlestick pattern formations to help them determine when to buy stock and sell stock. Long term investing dictates that the investor must perform fundamental analysis of a stock. So, why can a trader simply choose a stock that is going up and jump on for the ride? Because very often it works out quite well! Whether the fact that a stock keeps going up in price is due to irrational psychology of investing or a warped psychology of trading makes no difference in technical analysis of stocks. It is the time honored principle of Candlestick basics to let the market tell you what the market will do.
In value investing the investor may often discover an overlooked and undervalued stock with promising prospects and a ridiculously low price to earnings ratio. A small cadre of investors who follow just a few market sectors may have found a stock and may be progressively bidding it up. The successful individual in trading momentum stocks does not really care! The trader or investor trading momentum stocks just engages in trend analysis and follows the trend.
Trading momentum stocks involves generating trading software trade signals by following current market calculations, moving averages, and channel breakouts to understand market direction. The individual will trade stocks that fit a set of criteria and sell or buy stocks based upon a predetermined trading strategy. Because the trader does not care what the underlying reason is for the stock price movement, he or she needs to have a predetermined set of rules for exiting a trade if the market reverses.
Risk management in trading momentum stocks includes the current market price, how much money is in the trading account, and market volatility at the exact time of trading. As these factors change, the investment risk management equation changes. This calculation should be part of the trading software. When prices change, the size of the trade typically will increase or decrease. The degree of market volatility will also help determine the size of stock trades. Day trading in momentum stocks, whether the movement is up or down, typically involves the longer term movement of a stock or the “turnaround” of a stock in the market. This type of trading looks for stock market trends, not stock market reversals. When there is a change in price movement the trader needs to have a pre-established strategy that leads to a quick exit from the stock position. However, once the trend establishes in the other direction the trader can trade the stock again. Trading momentum stocks works in both directions.
Market Direction
A major benefit of candlestick signals is the immediate identification of what is occurring in a price movement. Just a simple factor such as a white ( bullish) candle forming, based upon where the price opens, allows for immediate analysis. What do you do with a position that gaps down during its uptrend? There are very simple rules for closing out positions that are not performing as the chart analysis had predetermined. A gap down below the previous day’s open, in the overbought condition, has different ramifications than if that same situation occurred when the stochastics were showing the stochastics not in the overbought condition.
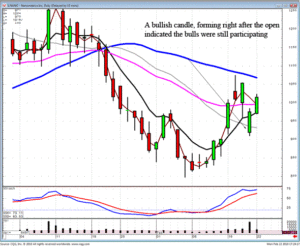
As illustrated in the NANO chart, which had been a recent recommendation, the initial reaction to the earnings was very negative. It gapped down, well below the open of the previous days candle. The stochastics had just barely started climbing into the overbought condition. The normal rule is to close the position immediately, especially if the price is well into the overbought condition. Logic says that an uptrending stock price should not experience a gap down. That is not what should occur if the Bulls remain in control.

NANO
As witnessed in the NANO chart, the price not only gapped down, it gapped down below the T. line. This would have normally caused an immediate close of the position. However, the visual effects of candlestick analysis did immediately identify the fact that the Bulls started stepping in almost immediately. This would’ve been revealed with the formation of a white candle as the trading occurred above the open price. This provides some very important information. Although there was an extensive gap down in price, the bulls were still participating. Obviously, this would have been a much different analysis had the price gapped down and then was followed by continued buying.
The results would have been to continue to hold that position until it was evident the Bears were taking back control. As can be seen, the remaining day experienced continued buying, followed by another day of buying. The T. line rule was not violated. The price did not close below the T. line.
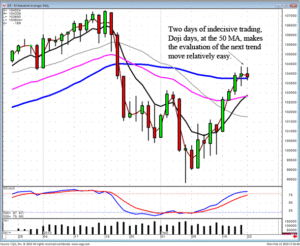
Candlestick analysis provides the information that prepares an investor for high probability price trend results. That can involve whether to sell or remain long or getting prepared for a change of a price trend. The Dow formed a Doji during Friday’s trading. It formed another Spinning Top today. Both the Dow and the NASDAQ are in the overbought condition. They are both also trading right at the 50 day moving average. This makes the evaluation of the overall market trend relatively easy.

DOW
One of the Doji rules, the trend will move in the direction of how they open the price following a Doji. A lower open tomorrow becomes very meaningful. The Dow will be experiencing a lower open after a Doji, in the overbought condition, and trading back below the 50 day moving average. This combination of analytical tools would make it quite clear that it was time to take profits and maybe adding some short funds to the portfolio.
There is an immense amount of information built into candlestick signals. Not taking the time to learn that information greatly diminishes the opportunity to consistently take profits out of the market. It allows an investor to be prepared for the next price change or the continuation of a current price trend. In either case, specific price movements will cause specific results. This may sound like an elementary statement, but the if/then aspects of candlestick analysis permits an investor to move much more quickly for establishing positions or taking profits. This information is vital whether investing in stocks, options, or commodities.
Chat session tonight at 8 PM ET.
Thursday night February 25, Tina Logan will be presenting more information about being a professional thinking trader.
Good Investing,
The Candlestick Forum Team
Speak Your Mind