Winning with commodities starts with learning the basics through commodities and futures training. Learning what commodities are and which commodity to trade is a start. Commodity prices as recorded in commodity trading charts give traders a useful view of the commodities markets. Commodity trading with the use of Candlestick chart analysis has helped traders since Candlestick basics were developed by rice traders in Japan centuries ago. Those traders were winning with commodities when the Samurai were in power by letting the market tell them what the market would do. To win with commodities the trader will need to understand basic and fundamental analysis of individual commodities as well as technical analysis. Through the use of technical analysis tools the trader will be able to predict commodity trends and market reversal. Through the use of Candlestick pattern formations the trader will have the tools necessary for winning with commodities.
Fundamentals of Commodity Trading
The fundamentals in commodities trading vary by commodity. The fundamentals for trading gold futures have to do with the economy and the ability to economically mine gold. Since many use gold bullion for hedging against inflation or even protection against economic and monetary collapse, a recession or persistent inflation will typically drive the price of gold up. Much of the gold in the developed world has been mined near to surface. Thus extraction is taking place at great depth in the mines of North America and South Africa. Newer mines where extraction is easier are often in developing and politically unstable countries. The commodity market for an agricultural product such as corn or soybeans will be very dependent upon the weather in the world’s major crop growing areas such as the United States Corn Belt. Knowing market analysis with the fundamentals is essential for winning with commodities for it is the fundamentals of supply and demand that will determine commodity price when the commodity futures contracts expire.
Technical Analysis of the Commodities Markets
Winning with commodities requires knowledge of technical analysis indicators such as used in Candlestick trading tactics. Although the fundamentals of any commodity are available to all traders the tactics used by each will differ. Thus trading commodities is a daily, hour by hour, minute by minute job as the trader watches and derives opportunity from the market. History repeats itself in large trading markets such that recognizable price patterns are predictive of future movement of a commodity futures price. Recognizing and knowing how to trade commodity trading signals is essential to winning with commodities. As we mentioned above commodities and futures training is essential to learn commodity trading or as a refresher in using tools such as Candlestick charting techniques. Knowing the fundamentals of a commodity is essential to commodity trading. Knowing and knowing how to use technical indicators is what makes daily winning with commodities possible. Everyone knows, or should know, the fundamentals of corn futures or copper futures if they are trading them. It is in anticipating both short and longer term price movement of a commodity that profits are made.
Market Direction
Did you make money last week as the markets were going down? Many people lost money. As a candlestick investor, you should have been making money. Why? Because you could have looked at the charts and be informed on what the market was doing. What were the indications? The advantage of learning from candlestick analysis provides valuable insights. These insights can be learned from common sense of evaluation, not years and years of market trading experience.
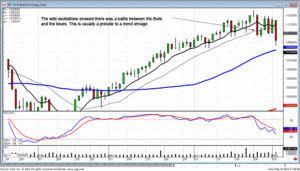
The Japanese Rice traders pointed out specific market conditions that would show a probable change of investor sentiment. The signals are the primary indicators of course. However, there are additional indicators the Rice traders explained as sentiment changers. Watching great volatility coming into the market is an indicator. The extensive magnitude of price movement reveals great indecision between the Bulls and the Bears. The simple rule of prices trading below the tee line was another indication the downtrend probabilities have expanded. After a bullish trading day last Monday, there was the possibility the uptrend could continue. Waking up to very bearish premarket futures he next day should have been another indication the Bulls could not keep the markets above the tee line. During all this whipsaw action, the stochastics were moving in a downward direction. Once the indexes had moved significantly below the tee line, the commonsense evidence was now favoring a downtrend. This should have stimulated the portfolio positioning moving toward short positions or at least back to cash.
DOW
Why did most people not make money during the downtrend? What was still the predominant image of the market? A long steady uptrend! This is what keeps most investors hanging onto long positions well past their prime. A pullback in an uptrend is not unexpected. Unfortunately, most investors are hoping the pullback will be short-lived and the markets will continue its previous uptrend. This thought process becomes prevalent because the long slow uptrend had produced great expectations. This is where emotional trading usually prevails in most investors trading platform. There is only one productive way to keep from falling into that trap. Look at the chart with a completely unbiased point of view. Although you may be holding long positions, you have to ask yourself honestly what is the chart telling. If it reveals that it is moving in a direction of exsing positioig, wth no indication of a reversal, an investor has to make an unemotional decision to sell positions that do not look like there is strong upside potential.
DOW This Week
Will all pullbacks provide the opportunity of huge profits like we saw on Thursday’s trading? Definitely not, but why put yourself in a position where you do not have the opportunity to take advantage of a downward move. If you keep in mind that it takes approximately 7 seconds to change or add or delete a position from your portfolio, you minimize the mental block of selling a position and buying it right back if it appears as if selling the position was not the correct thing to do.
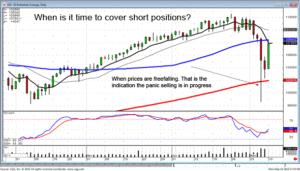
The panic selling of Thursday could be easily identified. When prices start jumping on the downside, it can be assumed that the panic selling is occurring and no buyers are stepping in, YET!!!
Watch your five-minute chart and your one minute chart to reveal when the panic selling is over and Bulls are starting to step back in. The panic sell we saw on Thursday is a market condition that may be seen only once every 5 to 10 years. Knowing what to look for on a one minute candlestick chart will make those days extremely profitable. The charts reveal when it is time to cut through the emotional selling.
Today’s bullish trading ‘may’ have changed the bearish sentiment. That is not 100% guarantee though. Both the Dow and the NASDAQ closed below the tee line. Tomorrow’s pre-market futures will indicate whether the tee line will still act as resistance or whether the market can push up through that resistance.
Chat session tonight at 8 PM ET
Good Investing,
The Candlestick Forum Team
This Week’s Special
Projecting Price Targets – Quickly learn to spot the most profitable price targets! – BONUS EBOOK with purchase!!!
2-Day-Commodity Training Webinar
Click here for details
Website special reflects current newsletter. If you are reading an archived newsletter you will be directed to Current Website Special.
Speak Your Mind