A stock market community has many benefits when learning a new investment technique. The stock market community that has developed at the Candlestick Forum site is a valuable tool for learning how to use candlestick signals correctly. Members have the opportunity to be part of the stock market community participating in the chat room. That chat room becomes a useful tool for solidifying candlestick analysis thought processes. The chat room, as well as the forum, provides a format for asking questions and getting answers that may have a different perspective. Going through a learning process benefits greatly when different analytical aspects can be brought to your attention.
The stock market community on the chat room produces immediate feedback. The creation of a community that is all in the process of trying to learn how to improve their investment abilities is a valuable asset when an investor wants to clarify how candlestick signals should be analyzed. This same stock market community receives the benefit of the Monday night members chat session. This session goes more in-depth into the existing positions that have been recommended on the site. An explanation of why the position was established and when to close out the position becomes instrumental for an investors learning curve.
Candlestick analysis is very simple. It becomes much easier to learn with constant contact with an investment group. Learning any new investment technique creates questions. When those questions can be answered immediately and by many different levels of experience, a much more concise analysis can be learned in a much quicker time frame. The 12 major signals are the core of candlestick analysis. Learning just those 12 signals provide more trading opportunities than most investors will ever require. To become successful in the stock market community, an investor should learn how to use these 12 major signals effectively. They not only illustrate when to get into a trade, knowing what each one is supposed to illustrate as far as investor sentiment, makes profit taking and stop loss procedures very easy to implement. Click here for the 12 major signal training package special.
Market direction – What could have been the possibility of a Blue Ice Failure has now completely changed. Being able to recognize what patterns may be setting up and what candlestick signals are forming allows an investor to shift portfolio positions immediately if a pattern is not working. The failure of the 50 day moving average by the Dow on Tuesday created the possibility of a Blue Ice Failure pattern which would anticipate the next target being the 200 day moving average. However, the bullish candlestick signals changed that scenario.

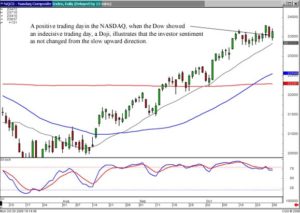
Positive NASDAQ on a Day with an Indecisive Dow
Not so much in the Dow, but the bullish signals appeared in the NASDAQ and the S&P chart. Both had Bullish Haramis formed on Wednesday. This was the immediate indication that the selling had stopped. That information now negates the possibility of a Blue Ice Failure. A new scenario should now be analyzed.
What happens the first time a major moving average is touched? Usually it fails. But the next approach usually breaches that moving average. With the Bullish Haramis in the NASDAQ and the S&P chart, indicating bullish strength, the analysis on the Dow should be anticipating the second approach of the 50 day moving average to breach that level. This analysis diminishes the negative sentiment that was revealed on Tuesday.
Speak Your Mind