Analyzing Stock Market Indexes Using Major Candlestick Signals

The Japanese traders say “let the market tell you what the market is going to do.” The utilization of Candlestick signals makes analyzing the direction of the stock market indexes and trends relatively easy. It becomes difficult at times to sort out what the stock market indexes intentions are when listening to the many scenarios from the so-called “market experts.” Watching the financial news stations will always provide a multitude of opinions of where the market is going. Using Japanese Candlestick signals will circumvent all that noise.

The one basic factor built into Japanese Candlestick signals is that they are formed by the cumulative knowledge of all the investor input, the buying and selling, of a trading entity or trading entities, during a certain time period. No matter what you hear elsewhere, the Candlestick signals tell you exactly what investor sentiment is doing.

Candlestick analysis allows investors to project trend reversals of the stock market indexes with a relatively high degree of accuracy. One misconception about Candlestick signals is that there are too many of them to learn. Of the 50 or 60 Candlestick signals, there are only about 12 signals that will occur a vast majority of the time: The Doji, the Bullish and Bearish Engulfing signal, the Hanging Man, Shooting Star, Hammer, the Inverted Hammer, the Bullish and Bearish Harami, the Dark Cloud, the Piercing Pattern, and the Kicker signal. Knowing these signals alone will dramatically improve your analysis of trend reversals and make learning Candlestick analysis much easier. Having this analysis capability in one’s mental arsenal allows the Candlestick investor to have their portfolio positioned in the correct direction when a move occurs. Understanding the psychology of how the signals are formed provides investors with better foresight into where to have positions placed.

Candlestick analysis is not rocket science. It is simple investment philosophies put into a visual graphic. The 400 years of actual investment results from Japanese rice traders have provided high probability signal results. The Candlestick signals illustrate the investor sentiment mostly defined as fear and greed. Human emotion, when it comes to investing funds, will always have the same ingredients. The Candlestick signals are simply the graphic depiction of investor sentiment. Candlestick signals were not discovered and tested by computer back testing simulations. Candlestick signals are the result of centuries of analyzing how human emotions affect a price trend. The signals, occurring over and over at specific points in a trend reversal, provide a statistically proven trading platform. If you understand how they are formed, you’ll understand what makes prices move.

The Morning Star signal is one of the most clear, symmetrical Candlestick reversal patterns. Not to overstate the obvious, but if Candlestick signals didn’t work, we would not be looking at them today. The Japanese rice traders that used Candlestick signals became enormously wealthy.

The major benefit of Candlestick signals is that they are very easy to learn and identify. You do not need to learn formulas. You do not have to do extensive fundamental analysis. The visual aspect of Candlestick signals identify when a reversal is about to occur. Somebody else has already made decisions that it is time to buy or sell. The Morning Star signal, when fully analyzed, reveals very simple common sense features that identify the change in investor sentiment.
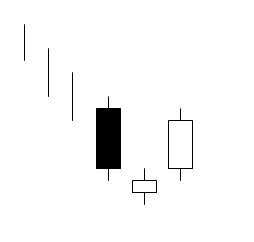
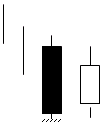
Morning Star

The Morning Star

The Japanese rice traders described it as the planet Mercury, the Morning Star. It foretells that brighter things, sunrise, is about to occur, meaning that prices are going to go higher. It is formed after an obvious downtrend. The first three-day signal consists of a long black body, usually one produced from the fear induced at the bottom of a long decline. The following day gaps down. However, the magnitude of the trading range remains small for the day. This produces an indecision-type day. The third day is a white candle day. The white candle represents the fact that the bulls have now stepped in and seized control. The optimal Morning Star signal would have a gap before and after the star day.

The make-up of the star, an indecision formation, can consist of a number of candle formations. However, a Doji or a Spinning Top is usually the predominant formation in a Morning Star signal. The important factor is to witness the confirmation of the bulls taking control the next day. That candle should consist of a closing more than halfway up the black candle of two days prior.

Identifying the Morning Star signal is relatively easy. It is visually apparent to the eye. There are some very simple parameters that can enhance the Morning Star signal’s probabilities of creating a reversal.

  1. The longer the black candle and the white candle, the more forceful the reversal. This demonstrates a more severe change in investor sentiment.
  2. The more indecision that the star day illustrates, the better probabilities that a reversal will occur, such as a Doji signal.
  3. A gap between the first day and the second day adds to the probability that a reversal is occurring. A gap before and after the star day is even more desirable.
  4. The higher the close of the third day, coming up past the middle point of the black candle of the first day, reveals more potential in the strength of the reversal.

The probability of a Morning Star signal reversing a trend becomes extremely high when found in oversold conditions. Using a simple indicator such as stochastics, in the 20 area or below, represents an oversold condition. The most important element of the signal is the magnitude of the white candle’s close during the third day.

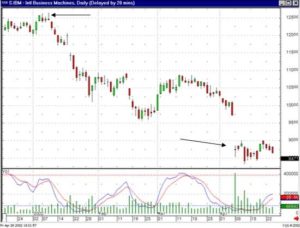
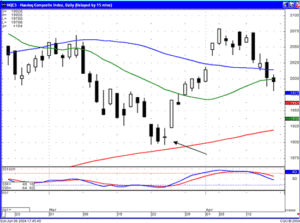
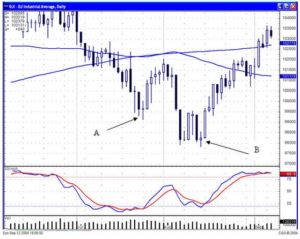
Candlestick analysis can be used with all trading entities. Whether doing a long-term evaluation on a monthly Dow chart or a one-minute chart trading the e-minis, the signals working just as effectively for revealing change in investor sentiment during that time frame. As seen in the daily Dow chart, the Morning Star signals revealed when the Dow established a bottom. Being able to analyze the direction of the DOW increases the probabilities of being in a correct trade when analyzing individual stock charts.

In July and August 2004, the Dow index reversed after Morning Star signals. Note point A, when the stochastics were on an oversold condition, a three-day Morning Star signal appeared. Then, two Morning Star signals appeared a week later, point B, to start the next rally again in the Dow Jones Averages. In both cases, it became very clear to start buying stocks that have produced good Candlestick “buy” signals when the markets are showing buying strength.

Analyzing Stock Market Indexes, Dow

Candlestick signals occur in the markets every single day. Scanning software makes finding the signals very easy. They can find the best Candlestick trades in less than 10 minutes every day. This is not rocket science. This is simply using the same successful analysis that has been used for centuries. When you see a Morning Star occurring in an oversold condition, the probabilities of being in a successful trade are very high.

Training Tutorial

Morning Star & Evening Star Signals

High Profits with Candlestick Signals

The stock market becomes an easy medium for making money when using Candlestick signals properly. The stock market is the cumulative knowledge of all investors buying and selling during any particular time. Just like an individual stock, the stock market itself incorporates waves of human emotion. Whenever human emotion is involved with an investment entity, the Candlestick signals can visually clarify what those emotions are doing. The stock market can easily be analyzed when applying Candlestick analysis.

Being able to analyze the direction of the stock market greatly enhances the ability to extract profits. The fact that the stock market moves up and down without major changes in fundamental economic conditions from week to week is a clear illustration that fundamentals do not move markets, the perception of fundamentals is what moves markets. Candlestick signals identify what is going on in investor sentiment whether you are studying one-minute, five-minute, or fifteen-minute charts, or whether you are studying the daily, the weekly, or the monthly charts.

Candlestick signals visually depict the cumulative knowledge of everybody that was buying and selling during that specific time. Learning and understanding the 12 major signals found in Candlestick analysis not only allows an investor to identify reversals in a trend but, more importantly, allows an understanding of what investor sentiment created those signals. This produces a tremendous insight into understanding why the stock market moves the way it does.

Why go against the flow? If you can easily analyze, with the probabilities in your favor, whether the stock market is in an uptrend, a downtrend, or is trading flat, the Candlestick investor can greatly enhance their investing returns by positioning the portfolio in the direction of the stock market. Does this eliminate the possibility of a stock going up in a down market or vice versa? Definitely not! However, when trying to put all the probabilities in one’s favor, it is much easier to find individual stocks that have bullish signals when the market is heading up or bearish signals when the market is heading down.

Use Candlestick signals to your advantage. Learning the 12 major signals will dramatically improve your analysis of the stock market direction. Being able to analyze the times when the market is demonstrating Candlesticks buy signals after an extended downtrend eliminates the “grabbing the falling knife” concept. Candlestick buy signals in an oversold condition illustrate that the buyers are finally stepping in. Does that represent the absolute bottom? No, but it does indicate that the probabilities are now in your favor to be adding long positions and closing short positions. This is not rocket science. This is using indicators that have worked successfully for centuries.

As illustrated in the Dow Jones chart, when stochastics are in an oversold condition and Candlestick buy signals start forming and, seeing the Spinning Top followed so far by the Bullish Engulfing signal, it becomes a high probability situation to start buying. Stop loss procedures become very simple when seeing where the buying becomes negated.

High Profits with Candlestick Signals, Dow Example

DOW

Online stock trading can utilize the instant analysis that is produced by simple charts. The visual interpretation of Candlestick signals is very easy. Being able to apply other important technical indicators to the Candlestick signals immediately produces a huge profit potential. Gone are the days of having to calculate each indicator. The charts of today expedite online stock trading analysis tremendously. Learn how to use the Candlestick signals with these confirming indicators and the probabilities of being in a correct trade expands dramatically. This is not rocket science. The 12 major signals in Candlestick analysis will provide more trade opportunities than most investors will ever require.

Stock Market Timing – Candlestick Signals and Market Patterns

Stock market timing becomes dramatically enhanced when applying Candlestick signals to high profit patterns. This combination, utilizing the Candlestick signals in conjunction with known patterns, allows an investor to fine tune stock market timing programs. The basic premise of the Candlestick signals is that it tells an investor what the investment sentiment is in a trading entity right now. Whereas most stock timing programs use indicators that could represent timeliness in a price move, the Candlestick signals demonstrate the buying or selling sentiment of investors immediately.

When Candlestick signals are used in conjunction with recognized patterns of price movements, placing investment funds into a position becomes much more refined. Being able to analyze the direction of a price movement is difficult enough for most investors. To add stock market timing parameters becomes that much more difficult for the vast majority of investors. However, the Candlestick signals greatly alleviate that problem.

Simple logic dictates that Candlestick signals work effectively. Otherwise, investors would not be looking at them today. Also, there are established patterns that seem to work reasonably well in the investment markets. The simple application of Candlestick signals to, what appears to be, a recognized pattern forming is a very easy stock market timing program.

One of the highly profitable patterns used for stock market timing is the Fry Pan Bottom pattern. The Fry Pan Bottom pattern is aptly named. It does not take a high degree of technical analysis to figure out the investor sentiment that forms a Fry Pan bottom. This pattern gets its name because it looks like a Fry Pan. The pattern is a slow curving pattern to the downside, flattening out at the bottom, and slowly coming up out of the other side of the pattern. The analysis for the investor sentiment that forms this pattern is very easy to understand. Initially, after a downtrend, the selling sentiment starts to wane, making the trajectory of the downtrend a slow and active bottoming trading pattern.

After a lengthy period of time, the sentiment almost becomes neutral, forming a flat area. This lack of interest, one way or the other, eventually starts to incorporate a very slow change of investor sentiment to the plus side. The new positive outlook on this stock shows the same lack of enthusiasm on the buy side as it did on the sell side. However, the difference now becomes that the selling interest has disappeared and the buying interest is slowly coming back into the price. This pattern, unlike other patterns that become effective when stochastics indicate an oversold condition, utilizes the condition of the stochastics in an opposite manner. It is usually when stochastics are approaching the overbought conditions that the investor sentiment can now be gauged. Stock market timing is benefited when knowing how this formation is formed.

The alert for this pattern is activated when stochastics get up into the overbought area. The price now shows that confidence has built back up into the price in the form of a large bullish candle or a gap-up coming out of the positive side of the Fry Pan Bottom pattern. This buying indicates that investor sentiment has now produced confidence of being back in the position. A gap-up becomes a signal to buy, even though the stochastics are approaching the overbought area. Stock market timing is recognizing when enthusiasm is coming into a position. That enthusiasm, coming out of a long bottoming action, usually will create a strong buy trend.

Notice the long period of time, a four month period, in the Isonics Corp. chart that the investor confidence shifted. The telling factor for the potential breakout was being able to recognize the subtle Fry Pan Bottom formation. A couple of simple elements can be added to Fry Pan bottom analysis. The first being that the very bottom of the Fry Pan is approximately one-half distance from the time the Fry Pan Bottom started to when it will break out. This is not anything that is set in stone. A simple observation is that the very bottom occurs in the middle of the Fry Pan Bottom. Having this knowledge allows the investor to estimate when the breakout might occur, benefiting from a stock market timing process.

This calculation does not need to be exact. Visually, the buying can be seen as the confidence starts building back up. When that buying level starts approaching the same level as when the pattern started to develop, it is time to start taking action. In the Isonics Corp. chart, early October started revealing some bullish Candlestick formations. Volume started expanding. This now becomes evidence that the buyers confidence could create a breakout situation.

Timing, Isonics
 
Isonics

The confirmation of the breakout move after a Fry Pan Bottom becomes a large bullish candle or a gap-up. This will usually occur near the high point of the beginning of the Fry Pan Bottom formation. Whether you decided to buy this stock in the first few days of October or after the breakout occurred does not really matter. After the extended period of time that it takes the form this pattern, a buyer confidence has built up a lot of steam. The percentage move out of a Fry Pan Bottom pattern should be very large.

These patterns do not occur very often. Fortunately when they do occur, they can be found and then followed without too much difficulty. That allows an investor to become well-prepared for taking advantage of the potential results.

The W. R. Grace & Co. chart illustrates a very slow decline, followed by a dimple in selling and buying at the very bottom of the pattern. Once it was interpreted that the buy signal was not creating the immediate buying one would hope for, the slow building up of confidence could be seen. This creates a different analysis versus a stock price that is starting to get to the overbought area finally seeing some exuberant buying. The breakout occurring after a Fry Pan Bottom formation now reveals a completely different scenario.

Training the eye to recognize how a pattern is setting up creates the opportunity to participate in a big profit move. The slow downtrend, followed by a slow uptrend, will have different results. When the trading gets close to completing the Fry Pan formation, funds can start to be committed.

Because of the length the time that a Fry Pan Bottom takes to develop, they should not be a primary source for a trading strategy. However, they can be used when the timing becomes apparent. Although they do not occur with great frequency, the percent return produced makes them well worth being enabled to recognize the formation.

Stock Market Lesson Plans – An Easy Process With Candlesticks

Stock market lesson plans become very easy to follow when utilizing Candlestick analysis. Very simply, over the past two weeks while the Dow Jones was in the oversold condition, a few Candlestick bullish signals appeared. The Tweezer Bottom and the Bullish Engulfing signals illustrated that a bottom was forming.

At the same time, all the hype about Crude Oil prices appeared to be running rampant. $100 a barrel oil, what would that do to the US economy? The hurricane, how would that constrict the flow of oil? Gas lines, price gouging, spot shortages, all these things were being touted by the media. However, the Crude Oil chart was showing a Candlestick ‘sell’ signal. That information should have been put into the stock market lesson plans. Despite what the news indicates, the Candlestick signals tell you exactly what investor sentiment is doing.

Lesson-Plans-1

Crude Light

There did the big buying pressure come from this week? The signals had indicated over the last two weeks that an uptrend may be starting. Look for some consolidation , profit-taking after the big move Tuesday, but then look for the uptrend to continue.

Realizing that the market direction is being influenced by Crude Oil prices, stock market lesson plans can be oriented around that analysis. As discussed in the Thursday night training sessions on the Candlestick Forum website, being able to analyze what other market factors are doing becomes additional analytical information for projecting whether to be long or short in equities.

The ease in which Candlestick signals can be utilized for analyzing all trading entities allows the Candlestick investor to quickly evaluate whether their portfolio should be predominately long or short. Outside influences such as Crude Oil prices, interest rates, the strength of the American dollar, or a multitude of other trading entities will at times be the predominate influencing factors on investor sentiment. Being able to identify reversals in those trading entities becomes a valuable tool.

Technical Analysis of Stocks – Candlestick Analysis of Bad News Gaps

The ultimate poop trade! Technical analysis of stocks become much easier when able to interpret what investor sentiment is demonstrating. Candlestick analysis incorporates common sense investor concepts into graphic depictions. Understanding how to interpret what investor sentiment is doing after specific market movement will greatly enhance your profit potential.

The technical analysis of stocks present a multitude of price movements. A highly profitable opportunity is usually presented in bad news gap-downs. Consider the following situation. You just recently bought a position because of a very good bullish signal. All confirmation is positive, it moves up nicely the first day. THEN, the dreaded news; the company issues an earning warning, the SEC announces a surprise audit, a contract gets cancelled. Whatever the news, the price drops 20%, 30% or greater. The question is what to do now? Do you sell the stock, take a loss and move on? Do you trade it at the new levels? Do you hold and/or buy more at these levels? What is the best course of action?
Traders and long term investors will have completely different outlooks. The traders bought the stock a few days back due to specific parameters for making that trade. They should consider liquidating the trade immediately and move their money to better probabilities. The reason for putting on the trade, for a short term trade, has completely disappeared after the massive down-move. The longer term investor has a few more analytical options for gap analysis. They may want to hold the position because the Candlestick formations indicate that the price will move back up or liquidate because the Candlestick signal shows further decline. Reading the signals becomes an important element in knowing what to do in a “bad news” situation.

A “bad news” gap-down has a multitude of possibilities after the move. The prior trend gives you valuable information on how to react to the move. Of course, the news is going to be a surprise or there wouldn’t be the gap-down. Analyzing the trend prior to the move gives you a good idea of how much of a surprise the announcement or news bulletin is.

For example, IBM recently reported lower earning expectations. The price gapped down. However, you have to analyze whether this news was a complete surprise or whether the gradual decline in the stock price was the anticipation of the coming news. As can be seen in the IBM chart, the price had been declining for three months before the actual news was announced. The smart money was selling from the very top, months ahead of time. It was the die-hards that held on until the bad news was reported.

As the chart shows, the final gap-down produced a Long Legged Doji, massive indecision. From that point the buyers and the sellers have held the price relatively stable for the next few weeks. This now becomes one of the few times that a technical analysis has to revert back to fundamental input. Unless you believe that the markets in general are ready for a severe downtrend, consider what the chart is telling you. The price of IBM stock was reduced from $125.00 per share down to $87.00 per share. The last down-move produced a Doji. The price has not moved from that level for two weeks.

Bad News Gaps, IBM

IBM

Now, the fundamental input. IBM is a major U.S. company, well respected, and known to have excellent management personnel. And like any other quality company, it has made marketing or production mistakes from time to time through the years. The announcement that they made that knocked the price down, whether it was an earnings warning, shutting down a product line, or whatever, the factors that were announced as the result of the problem did not surprise company management. They knew that there were problems well before the news announcement. Being intelligent business people, the management of IBM was aware of the problems and had been working on the solutions months before they had to announce.

When the announcement was made, probably many strides had already been taken to correct whatever problems caused the price to drop. For the long term investor, it would not be unusual to see the price of IBM move back up to at least the level from where it last gapped down, at approximately $100. This still provides a 15% return.

You can chart your own course through common sense technical analysis of stocks. Watching for a Candlestick “buy” signal gives you the edge. IBM is not going out of business. Who was buying at these levels when everybody was selling? The smart money! Are the professional analysts of Wall Street recommending to buy at these levels? Probably not! But watch the price move from $85.00 back up to $95.00, then you will see the brave million dollar analysts say it is time to buy. Practical hands-on analysis, being able to see the “buy” signals for yourself, will keep you ahead of the crowd.

Understanding the Stock Market Using Moving Averages and Candlesticks

The use of moving averages has become much more predominant with the advance of computer software. Moving averages can now be utilized up to the very minute of a trading chart. The automatic calculations for MA’s have greatly simplified their applications. Their use, along with Candlestick signals, makes understanding the stock market a much easier process. As with all other technical indicators, MA’s have a relevance when correlated to price movement. How the moving averages are utilized can make a big difference between moderate returns and highly profitable returns. When applying Candlestick signals with moving averages, understanding where the stock market indexes are likely to go becomes a higher probability evaluation.

There are many trading techniques using moving averages to provide entry and exit decisions. The most common use is when the relevant moving averages cross. The feasibility of using MA crossings apparently has some relevance or it would not be known as one of their useful aspects. However, the benefits of using moving averages become greatly diminished if that is the only application that is utilized. The accuracy of the crossing analysis is moderately successful. But there are many technical evaluations that are moderately successful.

Using Candlestick signals, along with the moving averages in a much different capacity, creates a trading program that produces highly profitable trades. The trades are also provided with a much greater frequency. The point of investing is to find processes for using technical indicators that provide a very high ratio of successful trades. Using the important moving averages as support and resistance areas, in conjunction with Candlestick analysis, advances the probabilities of participating in a correct trade. Fortunately, the use of the moving averages is very simple. Once applied to Candlestick charts, it makes the analysis of where a trend may support or resist a very simple visual process.

The 50-day moving average and the 200-day moving average are the important moving averages. There seems to be a great tendency for prices to support or resist at those averages. The 20-day moving average and the 80-day moving average are also important but would be considered secondary moving averages. Are there other moving averages that work effectively? Probably, but the moving averages mentioned above seem to have a statistical relevance for the past few years and will most likely continue to be relevant for the next few years.

Technical indicators provide important information. An indicator gains importance because of the reoccurring significance of major investment considerations happening at those points. This explanation is put forth so that each investor can become convinced in their own minds that moving averages, especially the ones being recommended in this chapter, have some relevance. Through the following chart evaluations and one’s own chart studying, the relevance of these signals should become apparent. This does not limit an investor from constantly being aware that other moving averages may start gaining importance in the eyes of other technical investors. The point of using these moving averages, along with Candlestick signals, is that historically many investors are watching to see what price movements do at these levels. The advantage of the Candlestick signals is that the signals tell you exactly what investors are doing at those levels.

Moving Averages as Support

When witnessing a downtrend, how do we tell when a bottom is getting near? As described in other chapters of my book, it could be when panic selling is witnessed coming into a price trend as the stochastics are getting toward the oversold area. That is a helpful alert but does not give us a roadmap to where that panic selling might end. Being able to utilize the 50-day moving average and the 200-day moving average as important support areas, those levels can at least be used as a target. Being able to evaluate the potential target that a trend may want to go to now makes the analysis of what is going on in the Candlestick formations that much easier to interpret. For example, if a sustained downtrend is now showing larger candles, the evidence that the panic bottom may be nearing and the price is approaching one of the major moving averages provides extra preparation for seeing what might occur at that moving average level. Panic selling, along with stochastics approaching the oversold area or being in the oversold area, and a major moving average approaching a level where a Candlestick buy signal has a probability of occurring, becomes a trade set up that an investor wants to start preparing for.

Do all charts work well with moving averages? Definitely not! However a large majority appear to. The purpose of Candlestick analysis is to provide an advantage for the investor to see what is happening at important technical levels. The Candlestick signals provide that clarity. If a chart is not providing patterns that make it easy to see what a price movement is going to do, then move on to another chart. There are many from which to choose, especially with the availability of easy-to-use computer scanning programs.

In putting all of the probabilities in favor of the investor, using every technical method can be enhanced when Candlestick signals are applied. How do you discover whether the major moving averages are a positive correlation with anticipating price moves? Easy! Investigate what has happened at those moving averages previously in the price trend. This can be done very quickly. All it takes is a quick visual analysis of what has happened in the past.

Don’t Get Enron’d – Candlesticks Can Protect Your Retirement, Traders World Magazine

Millions of Americans work for good, stable companies. So we think! Yet consider the twenty thousand plus employees who worked for Enron. In September 2001, the atmosphere in the Enron offices was not any different than what it had been for the previous five years, robust and vibrant. People were proud to work there. The management policies made the daily business environment a place people looked forward to every day.
Everything was great, no problems whatsoever.

The majority of the Wall Street analysts were recommending the stock. Top management was painting a rosy picture for the company’s future. New projects were being introduced. Money was flowing. The future looked great. Enron employees, like millions of other corporate employees around the world, were immersed in the day-to-day activities of the corporation. How could they have ever have known there was any trouble?

This could be the same description for thousands of corporations across the nation, across the world. So how does the individual employee protect himself or herself from the unthinkable? What precautions can be taken that will alert you to something not being right in your own company? Something that was not detected by the “diligent” Wall Street analysts, the scrutiny of professional accounting firms, the safeguards of your company’s management.

The odds of another Enron debacle could be extremely minute. But can you afford to lose your retirement money, can you afford to be hit by the same ramifications that thousand of ex-Enron employees are facing today? There was a simple tell-tale indicator that could have saved people’s retirement accounts. Japanese Candlestick charts.
If you are not familiar with Japanese Candlestick analysis, it will be worth your while to learn how to use the charts. It is simple, easy, and provides the Best Investment Advice . The visual illustration of what is happening in a company’s stock is clearly apparent on Candlestick charts. This simple yet accurate depiction of what is the cumulative sentiment of the investment community reveals valuable information. For the employee, it cuts to the chase as to whether investors are buying or selling the stock.

Japanese Candlestick signals are the result of hundreds of years of successful rice trading. Successful is really an understatement. The Honshu family refined the technique. Observing the highly accurate reversal signals not only made them wealthy, it made them legendary wealthy. Their influence is the basis of today’s Japanese investment philosophy, stemming from the observations derived in Candlestick analysis.

The basic function of investing is to make money. However, few investors develop a trading program that puts the probabilities in their favor. If searching for the “Golden Goose” of investment programs, the criteria would be simple; well researched, proven track record, and easy-to-identify reversal points.

All three of these elements are incorporated into Candlestick signals. Hundreds of years of rice trading resulted in the identification of high probability, profitable trades. Make one assumption. The signals would not be around today if it were not for one convincing result. PROFITS! Candlestick signals exist today because of hundred of years of actual profitable trades. Not computer back testing. Not questionable results. Profits produced from utilizing the signals are the only reason we are witnessing these signals today.

Reversal points were identified by rice traders using very simple charting techniques. You can take advantage of these clear, profitable signals. Japanese rice traders used the same information found on a standard bar chart. The difference is that they put more weight on the open and closing prices as well as the high and the low of a time period.

As illustrated in Figure 1, an open that is lower than the closing price creates a white candle. An open that is higher than the close creates a black candle. The positioning of these candles, with analysis of the colors of the candle, provides valuable information.

Candlestick Profits - Bar Chart Comparision

Bar Chart vs. Candlestick Chart

Learning how to use the signals correctly is now easy and can provide tremendous investment profits. Until recently, mastering the Candlestick technique had its drawbacks. First, there were very few places to go to learn how to use the signals effectively. That resulted in a lot of misinterpretation of the signals. This created a questioning of the effectiveness of the candlestick signal technique. However, websites such as www.candlestickforum.com provide investors with a learning forum as well as the exposure to different degrees of candlestick analysis. Trying to master approximately 40 signals has been the major deterrent for the methodology becoming overwhelming popular during the past couple of decades in the U.S. Fortunately, eight to ten of the signals will be responsible for 90% of the potential profits. This makes the learning process immensely easier.

Trying to decipher what is corporate Rah-Rah and what are true facts becomes difficult when one is right in the middle of the forest. Also, the amount of loyalty demonstrated to the company usually has an underlying impact in one’s career progress. However, maintaining one’s retirement security is a high priority. It is easier to accumulate your own company’s stock in your retirement account than trying to analyze alternatives. The company has been good to you. The stock price has been growing well. Owning the stock demonstrates your loyalty and dedication to the company. However, like all investment vehicles, your company stock can oscillate just like any other stock. There will be times when it is ahead of itself in price. There will be times that management makes mistakes in which direction to take the company’s growth. There will be times that the market in general is not favorable for being in any stocks.

Japanese Candlesticks can act as a monitor for when an investor/employee should be accumulating stock or moving to other investments. Note in Figure 2, Enron’s monthly chart, that a long-legged Doji signified that the current uptrend was over. The corresponding stochastics indicated that the stock price was overbought and starting to curl down. This would have been an indicator for employees to lighten up on their stock position in their retirement accounts and temporarily diversify to other investments. Would the Candlestick charts have projected the magnitude of the stock price pullback? Of course not. But it would have alerted investors and employees to reduce their positions until the stock became oversold and a buy signal appeared.

Enron Chart
Enron

The rosy picture of Enron’s future did not correspond with what the rest of the investment community envisioned.
The situation with Enron has awakened the investment community to the pitfalls of Wall Street analysis, professional accounting, and management stop-gap procedures not always alerting investors of problems. It magnifies the need to be diversified. At worst, it alerts employees that some due diligence is required in their own company’s stock. Working there day in and day out doesn’t always ensure that the employees know everything that is going on. Having Candlestick knowledge is a tool that all investors should have in their arsenal.

Becoming familiar with Candlestick signals provides other powerful investment ramifications. The roaring bull market of the late 1990’s brought many inexperienced investors into the market. The huge growth of many 401k programs opened the eyes of people who had not invested previously. The “technology boom” created the illusion that everything was going up and always would. Investing in the stock market was a place to make easy money.

The late 1990 period was the first time in the history of the Dow that double digit growth occurred more that two years in a row. Unfortunately, the “technology” crash of 2001 more than took back the gains produced in the prior four years. New dynamics entered the market. The “Buy and Hold” investment strategy may have been severely compromised. The resulting changes permanently altered how investors should look at the markets. Those changes could produce huge profits for the Candlestick analyst.

During the mid-70’s to the early 80’s, the “Buy and Hold” philosophy was preached under the guise that the market was undervalued and would eventually move prices towards their true value. This was a period during which the U.S. economy was struggling. Interest rates went sky high. The Japanese auto manufacturers were producing much better product than the U.S. manufacturers. The U.S. manufacturing facilities were old. Modern plants in Europe and Asia were more efficient. New American industrial plants needed to be built to compete; yet the cost of money prohibited any new construction.

Slowly, technology started making U.S. manufacturers and service industries competitive again. The mid 80’s to the mid 90’s had an American economy that was again competitive in the world markets. Stock prices grew steadily. Technology was slowly being implemented into the production of American products. Quality increased, manufacturing costs were being controlled. Inflation was abated. The Dow moved from 1000 to 9000. The buy and hold strategy was a reasonable strategy.

Then in the mid 90’s, a duo dynamic developed. First, the availability of investor information became instantly available through the internet. The American public did not have to depend upon brokerage firms any more for their investment information. They could access the information and interpret it for themselves.

The “intelligent” analysis from stock brokers and investment analysts was not required. The common man not only did not need investment advice as it was doled out in the past, they could place their own transactions without exorbitant commissions through discount brokers. The once popular adage, “when the public is buying, it is time to sell” dissipated. It became evident that the average investor was capable of making intelligent choices. During some severe one-day market crashes, it was the institutions bailing out at the bottom and the general public buying the bargains.

“Buy and Hold” may not be effective for the next market environment. Technology, despite its current blemished reputation, makes Candlestick analysis a must for the next few years. Consider what we have witnessed during the past five years. The markets roared, led by technology stocks. Although they got ahead of themselves and came plummeting back down, an important message was delivered.

Up until five years ago, manufacturing pursued technology to develop new and innovative advances. When manufacturing needed to become more competitive, it went to research departments and companies to develop a better way to do things. However, a dynamic change occurred in the mid 90’s. Technology, with constantly improved computer tools, started to leap-frog on itself. Technological improvements for manufacturing, medicine, software, and the service industries started to advance in geometrical proportions. Improvements were being made on improvements before they could get it to production.

Having knowledge about Candlestick signals now becomes more vital to investor’s performance. Sector stock trends may not have the long growth cycles any more. It will become important to observe where and when funds are flowing to particular industries. This is the valuable aspect that Candlestick signals present to the investment community.

Because technology stock prices are greatly reduced from their recent lofty heights does not mean that the results of the technology that each company produced is diminished. The speed to which new technology processes can change the face of an industry has not been abated. Technology is now pulling industry along versus industry having to push for better technology. It will be important to follow when each company has great growth potential and when new technology being introduced to a competitor can stop that growth rate. Fortunately, Candlestick analysis easily identifies when the buyers and sellers are coming into a stock price. Instead of one or two years or more of a leader of an industry being able to maintain their leadership position, technology may compress leadership positions into a six month to a one-year time frame.

Investment cycles may become relatively short. The buy and hold method could provide low returns in the future. Holding a stock that goes up 25% in six months, then back down to even over the next six months does not add any value to an investor’s portfolio. The best investment program in this technology-stimulated market may be to take profits after three, six, or nine months.

Candlestick charts are a great way to enhance returns for the fundamental research investors. Being the best research analyst in the world does not do any good if it requires sitting in a stock months or years before the rest of the market takes notice of what your analysis discovered.

The Candlestick signals provide fundamental research analysts with two valuable functions. First, they develop a platform for the most effective timing to enter a position. Fundamental research can prepare an investor to be ready for good things to come in a particular company. Candlestick charts provide the mechanism for maximizing returns, entering and exiting positions at the exact times. Returns on managed money can be greatly enhanced utilizing Candlestick signals.

Second, established positions can be better protected by monitoring the Candlestick charts. Once a company has been researched and a position has been put in place, a strong candlestick “sell” signal can warn investors that a severe change may have occurred in the fundamentals of a company. It would allow for a quick review of the company’s operations to see if a change of status had occurred. As in the Enron situation, all the good news from the company was not verified by the accumulative action of investment community thinking. The charts showed selling. Something did not match.

Candlestick signals have been around for hundreds of years. They were introduced into the U.S. investment community twenty–five years ago. New teaching methods are making candlestick signals very easy to learn and use. Whether to use them as a high profit investment program or to use them for monitoring your existing portfolio, every investor should utilize the powerful aspects incorporated in the signals. Being able to see what stocks are doing versus relying upon what “the professional sources” are telling you, could keep you from ending up with a worthless retirement plan some day.

Candlestick Profits – Still Untapped, Stocks & Commodities Magazine

Misunderstood. That can be the only explanation for Japanese Candlesticks, the most proven investment technique in history, to be so underutilized. This technique has been exposed to the U.S. investment community for approximately twenty-five years. Yet it is only recently that interest has picked up in this highly accurate investment technique. The investor who takes the minimal time and effort to master candlesticks will reap inordinate profits. This is not an empty promise. Basic analysis of Japanese Candlesticks produce a couple of irrefutable conclusions.

A candlestick signal formation has a major aspect that makes it more powerful than all other technical analysis. The signal is the result of a change in investor sentiment. This statement will be repeated for effect. The signal is the result of a change in investor sentiment. Not the anticipation of a possible change! The actual result is the change of trend direction. Having this tool in an investor’s arsenal can dramatically change an investor’s ability to maximize profits while reducing risk exposure. It allows the average man/woman on the street to invest with the same temperament as the professional trader.

Buy at the bottom, sell at the top. Pretty easy, right? Yet where does one grab the falling knife? When is high too high? Candlestick signals alleviate that problem. A candlestick buy signal, appearing after an extensive decline in a stock price (all trading entities can be effectively analyzed with candlesticks. The term “stock” will represent all trading entities) reveals compelling information. This information inherently benefits investors, making for comfortable trading decisions.

The basic function of investing is to make money. However, few investors develop a trading program that put the probabilities in their favor. If searching for the “Golden Goose” of investment programs, the criteria would be simple; well researched, proven track record, and easy-to-identify reversal points.

All three of these elements are incorporated into Candlestick signals. Hundreds of years of rice trading resulted in the identification of high probability profitable trades. Make one assumption. The signals would not be around today if it were not for one convincing result. PROFITS! Today’s Candlestick signals exist today because of hundreds of years of actual profitable trades. Not computer back testing. Not questionable results. Profits produced from utilizing the signals are the only reason we are witnessing these signals today. Reversal points were identified by rice traders using very simple charting techniques. You can take advantage of these clear profitable signals!

Japanese rice traders used the same information found on a standard bar chart. The difference is that they put more weight on the open and closing prices as well as the high and the low of a time period. As illustrated in Figure 1, an open that is lower than the closing price creates a white candle. An open that is higher than the close creates a black candle. The positioning of these candles, with analysis of the colors of the candle, provides valuable information.

Candlestick Profits - Bar Chart Comparision

Bar Chart vs. Candlestick Chart

Until recently, mastering the Candlestick technique had its drawbacks. First, there were very few places to go to learn how to use the signals effectively. That resulted in a lot of misinterpretation of the signals. This misinterpretation created a questioning of the effectiveness of the candlestick signal technique. However, websites such as www.candlestickforum.com provide investors with a learning forum as well as the exposure to different degrees of candlestick analysis. Learning how to use the signals correctly is now easy and can provide tremendous investment profits.

Utilizing the Candlestick technique produces two powerful investment considerations. First, the demise of most investors is that great bugaboo – Emotion. Exploiting fear and greed created by the masses is the biggest contribution to professional investor’s profits. Japanese Candlestick trading eliminates emotional investing. Due to the fact that the signal is the visual depiction of investor sentiment and graphically illustrates a change, the candlestick investor becomes knowledgeable about when the masses are creating a profitable opportunity. Most investors panic at the bottom. And they get over-exuberant at the tops. Knowing this and visually seeing it happen forces the Candlestick investor to buy when the buy signal is formed at the bottom. They sell when they see the sell signal at the top. Did you ever wonder when people were panic selling, with blood flowing in the streets, who was buying? Or when the news on a company was so wonderful, who was selling to everyone piling into a stock at the top?

Secondly, the Candlestick signals have an additional powerful aspect not found in other techniques. Not only did the Japanese rice traders identify high profit reversal signals, they added another overwhelming aspect to candlestick analysis. They proceeded to interpret what investors were thinking when forming a signal. This process alone institutes dynamics that put candlestick analysis light years ahead of any other trading technique. Remarkably, what should be considered a highly sophisticated program, is merely the accumulation of common sense observations. This makes understanding candlestick analysis very easy to learn. Yet it provides insights that revolutionize most investor’s decision-making processes.

The “technology stock” bull market and crash is still fresh in everybody’s mind. The exuberance was so great that most investors didn’t know when the top was hit. Having the indexes graphically depicted by candlesticks provided a platform for knowing when to take profits and/or shorting stock. Note in Figure 2, a Shooting Star formed at the top of the Nasdaq market. A candlestick investor, upon witnessing a Shooting Star, (a Shooting Star is a formation where the open and the close are at or very near to each other at the lower one-third of the daily trading range – it illustrates that the buyers and the sellers are indecisive) at the top of a major move, would have been immediately alerted that a top was imminent.

Note that a couple of weeks later, the Nasdaq tried to make a run for another new high. However, another weak candlestick signal, a Doji, occurred prior to the move making a new high, demonstrating that the buyers were running out of steam. This would have been an opportune time to liquidate all positions.

Using the signals, whether day-trading, swing trading, or long term investing, provides a method to identify when the buyers are making a presence and when the sellers are stepping in. Even the fundamental investor can effectively use candlestick signals to protect their positions. A sell signal appearing in a stock position can give the fundamental investor an alert that something might be changing. Revisiting the fundamentals of that company may be warranted. Using the candlestick method of thinking, shareholders of Enron Corporation could have greatly modified their positioning upon viewing the candlestick chart.

Candlestick Profits, Enron

Enron

Enron Corporation’s long term chart showed signs of a pullback. The magnitude could not be anticipated, but employee retirement plans could have been modified.

Making a basic assumption, that signals have a high degree of accuracy, puts the probabilities immensely in the Candlestick investor’s favor. Adding simple confirming parameters also enhances the degree of accuracy. There are approximately 40 signals. Fortunately only eight to ten are more than the average investor needs to learn to be highly successful at investing. The frequency and consistency of these “Major” signals will produce more trading opportunities than most investors require. Easy-to-use search programs can identify a dozen highly profitable trades each day. Any investor with ten minutes of subjective analysis can fine-tune those stocks to find which position or positions are the highest probable trades.

Using the Candlestick technique provides the format for developing inordinately profitable programs. The definition of inordinate will range with the amount of time each investor can contribute to investing each day. Achieving returns of 10% to 40% monthly is not out of the realm of comfortable investing. Having a high degree of confidence in a trading entity’s direction creates many opportunities to maximize profits. Short-term traders can go long or short. Long-term investors can exploit short-term pull-backs by writing options against their positions. Relying upon brokerage firms ho-hum recommendations becomes less vital. Investors can now control the results of their own investments.

The prime aspect that allows investors to amass wealth using candlestick formations reverts to one basic element. Probabilities. Visually recognizing a pattern having a high degree of probability of changing the direction of a trend, immensely increases the investors ability to amass huge profits. To not take advantage of the knowledge incorporated in the signals is to leave an immense amount of wealth on the table. Mastering Candlestick signals and the ramifications that are built into the signals is not difficult. Having the most researched investment technique in the world provides the structure for revolutionizing investor thinking. Knowing how the signals are formed by the masses providing fear and greed opportunities, allows the Candlestick investor to take advantage of a constant supply of high profit situations. Learn to be the buyer when everybody is panic selling. Take two weeks of your life to master a technique that will forever improve your investment abilities. The concepts incorporated by the signals are those that traders are currently using to accumulate huge profits for major brokerage firms. You can participate in those profits.

Stephen W. Bigalow is author of “Profitable Candlestick Investing, Pinpointing Market Turns to Maximize Profits” and principal of www.candlestickforum.com, the leading website on the Internet for providing information and educational material about Japanese Candlestick investing. Over fifteen years of extensive study and utilization of candlestick analysis has produced an array of easy-to-learn educational material about Candlesticks. As one of the leading Candlestick experts in the nation, Mr. Bigalow, through his consulting with major trading firms, has developed multiple successful trading programs for the day-trader to the long-term hold investor.

Commodity Trading System – A Candlestick Signal Forte

Utilizing Candlestick signals can help an investor develop a highly profitable commodity trading system. Japanese rice traders used the signals to develop the first commodity trading system. The Honshu family successfully traded the rice markets centuries ago.

Commodities are easier to trade than stocks using Candlestick signals. The reason is simple. There are fewer outside influences to affect commodity prices. A successful commodity trading system can be implemented through simple visual analysis.

The signals used in conjunction with simple confirming indicators such as stochastics produce a high probability commodity trading system. As illustrated in the July Wheat chart, when the price of Wheat was an oversold condition, a Bullish Harami illustrated the time to buy.

The trend of a commodity will usually remain steady in one direction until the stochastics indicate an extreme condition, either overbought or oversold. Applying Candlestick signals to the trend analysis in these extreme conditions makes for a very simple commodity trading system. The probabilities become highly in the favor of the Candlestick investor.

Note how July Wheat started its uptrend when the stochastics were in the oversold condition. A Bullish Harami/Spinning Top was the reversal signal at the bottom. July Wheat now is approaching the overbought area. The indecision, Spinning Tops and Doji’s, indicate less conviction to the upside. A Bearish Engulfing signal today should signify that the uptrend.

Commodity Trading System Wheat

Wheat

The Candlestick signals make for a high profit commodity trading system because of the immense amount of investment information provided in each of the signals. Prices move based on investor sentiment. Use this information to your advantage. The 12 major signals can make trading commodities extremely profitable.
 
Commodity Trading Platforms
Commodity trading platforms are a necessity. The extreme leverage used in commodity trading definitely requires a basis for buying and selling. One of the most proven commodity trading platforms is Candlestick signals. Candlestick analysis was developed through hundreds of years of trading rice.

The 12 major signals that are very effective for trading stocks become more effective when trading commodities. Commodity trends have one basic advantage over stock trends. Once a commodity trend is identified, the trend will persist in much better identifiable moves than a stock price. The reason for this is that commodities usually have much fewer outside influences than a stock price. A commodity price usually moves based on supply and demand. A stock price will move based on changes in fundamental elements, the stock market direction in general, interest rate moves, or a multitude of other influences that can change investor sentiment.

Being able to identify strong reversal patterns using Candlestick signals is one of the best commodity trading platforms available. Commodities usually move based on supply and demand. Those influences have a minimal number of aspects. Grains and the soft commodities can be affected by weather. Currencies can be affected by each other. The dollar will usually act inversely to the British pound, the Eurodollar, and the Swiss franc.

Highly profitable commodity trading platforms can be developed when you have Candlestick signals illustrating definite reversals in trends. As illustrated in the July Corn contract, a Doji at the bottom followed by a gap-up, when stochastics were in the oversold condition, made for a high probability, profitable trade. Being able to identify the obvious reversal signals allows the Candlestick investor to take advantage of entering trades at the optimal prices.

Commodity Trading System Corn

Corn

The centuries of identifying high profit reversal signals are built into Candlestick formations. Use this information to your advantage. Whether trading stocks or commodities, the signals put the probabilities highly in the investor’s favor. Very simple and profitable commodity trading platforms can be established. If you find a trading format that works successfully, then it is better to use it on a trading entity where you can leverage your high probability success ratio.


Commodity Trading Package

The Harami – A High Profit Candlestick Signal, Stocks & Commodities Magazine

The Harami is one of the major candlestick signals in Japanese Candlestick analysis. There are approximately 50 to 60 signals in the Candlestick signal universe. The biggest deterrent for many investors trying to learn the candlestick signals is a large number of signals. Most investors complain that there are too many to learn. Mastering Candlestick analysis can be done very easily by learning the 10 major signals. Knowing the signals, and understanding how those signals are formed, provide investors with a tremendous insight into what goes on an investor sentiment at reversal areas in a trend. Being able to identify the major signals and understand the investor sentiment that created those signals allows an investor to project market reversals with a high degree of accuracy. This is based upon hundreds of years of actual observations by Japanese rice traders. Simple logic tells us that if these signals did not work, they would not be here for us to view after centuries of use.

All the candlestick signals do not need to be memorized. Most signals do not occur often enough to use mental energy for identifying them. The 10 major signals will produce more investment opportunities than most investors will require. The Harami is considered one of the major signals. The Bullish Harami is a two formation pattern. The first formation is usually a large black candle appearing at the end of a downtrend. The end of a downtrend is represented by stochastics being in the oversold area. The Bullish Harami is formed by the second candle opening above the previous day’s close and closing below the previous day’s open. In Japanese, Harami means pregnant woman. As you see in the illustration, the black candle is the woman’s body, the white candle is her belly sticking out.

Harami Candlestick Pattern
Harami

A Harami at an important support level, as seen in the Nasdaq chart, is more effective when a Doji is part of the two day Harami signal. Once the trading came near the 200-day moving average, the Doji/Harami being confirmed with a gap-up the next day becomes a very high probability projection that the trend has reversed.

Harami Pattern NQCS

NASDAQ Harami

Excerpt from the book “Profitable Candlestick Trading” 

Description

The Harami is an often seen formation. The pattern is composed of a two candle formation in a down-trending market. The body of the first candle is the same color as the current trend. The first body of the pattern is a long body, the second body is smaller. The open and the close occur inside the open and the close of the previous day. It’s presence indicates that the trend is over.

The Japanese definition for Harami is pregnant woman or body within. The first candle is black, a continuation of the existing trend. The second candle, the little belly sticking out, is usually white, but that is not always the case (see Homing Pigeon). The location and size of the second candle will influence the magnitude of the reversal.

Criteria

  1. The body of the first candle is black, the body of the second candle is white.
  2. The downtrend has been evident for a good period. A long black candle occurs at the end of the trend.
  3. The second day opens higher than the close of the previous day and closes lower than the open of the prior day.
  4. Unlike the Western “Inside Day”, just the body needs to remain in the previous day’s body, where as the “Inside Day” requires both the body and the shadows to remain inside the previous day’s body.
  5. For a reversal signal, further confirmation is required to indicate that the trend is now moving up.

Signal Enhancements

  1. The longer the black candle and the white candle, the more forceful the reversal.
  2. The higher the white candle closes up on the black candle, the more convincing that a reversal has occurred despite the size of the white candle

Pattern Psychology

After a strong down-trend has been in effect and after a selling day, the bulls open the price a higher than the previous close. The short’s get concerned and start covering. The price finishes higher for the day. This is enough support to have the short sellers take notice that the trend has been violated. A strong day after that would convince everybody that the trend was reversing. Usually the volume is above the recent norm due to the unwinding of short positions.

End of excerpt

The significance of a Harami is that it tells us that the selling has stopped. As far as a trend reversal, the Harami has excellent capabilities of indicating how strong the new trend to the up side will be. For example, if a Harami opens and closes at the very low end of the previous day’s black candle, the trajectory of the new uptrend may be very flat or slow. If the Harami closes midway into the previous black candle, the up words trend will be moderately strong. If the Harami closes near the top of the previous day’s black candle, the new uptrend may be very strong. In this way, a Harami can act as a barometer for the buying sentiment in the new uptrend.

A Harami can be additionally determined if it appears at a significant technical level such as a trend line or a moving average line. For example, witnessing a Harami that is formation in an oversold condition becomes much more significant if it is also forming on a 50-day moving average or a 200-day moving average. This becomes instant verification that what most western technical analysis is using for a possible support level is becoming instantly verified by a Candlestick signal. The Candlestick signal creates an immediate buy point whereas other technical analysis may need additional time to confirm. The candlestick analyst can profit immediately.

The Bearish Harami is exactly opposite the Bullish Harami. After an uptrend and the stochastics are in the overbought area, there will be one last white candle. The following day opens below the previous day’s close and closes above the previous day’s open. This will form a black candle inside the previous day’s white candle. This essentially tells us that the buying has stopped. Confirmation is seeing the next day open weaker.

Harami Pattern Crude Oil

Notice the Bearish Harami’s in the Crude Oil chart. In late May, the experts were projecting that oil prices could go to $60.00 per barrel. This analysis was prompted by Crude Oil going above $40.00 a barrel for the first time in decades. However, every time the price would push above the $40.00 per barrel price, the Harami’s revealed that the sellers were stepping in. What is the smart money doing? You do not need extensive research team to delve into what is happening in each industry, stock or commodity. The signals tell what is the actual investor sentiment.
Just like the Bullish Harami, the Bearish Harami will indicate the magnitude of the new downtrend by where it closes in the previous day’s candle. A very small candle at the top end of the previous day’s white candle would indicate every slow downtrend whereas they close at the lower end of the previous day’s white candle would indicate that the selling pressure is going to be much stronger.

Understanding what the Harami signal is representing, the better the opportunity is to profit from the signal. The results, from witnessing a Harami, are fairly predictable. The Japanese rice traders established the statistical analysis to warrant the signals to still be in effect after centuries of use. Use that information to your advantage.

Training Tutorial available on The Harami