Archives for September 2019

Technical Analysis of Stocks

The technical analysis of stocks is the method used by stock traders to evaluate securities through the analyzing of statistics generated by the stock market activity. The intrinsic value of a stock is not important to technical analysts but rather the patterns identifiable on stock charts are what are important. These patterns are important because they signify future activity of stocks. Technical analysis can include identifying chart patterns on stocks charts, or the use of technical indicators, and oscillators. In fact, many use a combination of both of these methods.

The study of stock technical analysis is based on three assumptions. These three assumptions include first, the fact that the market discounts everything. Second, stock price moves in trends, and third, history tends to repeat itself.
When we say that the market discounts everything, this means that the price of a companies stock reflects every possible thing that has ever or could affect that company. Fundamental analysis factors are included in this assumption, but not used when stock trading. They believe that a company’s fundamentals will be reflected in the pricing of that stock so they choose only to study the analysis of price movement.

The second assumption of the technical analysis of stocks is the assumption that price moves in trends. Price movements are believed to follow trends so this means that after a trend has been established, the future price movement is likely to follow the same direction as the trend than to be against it. Most technical analysis trading strategies are based on this assumption.

The third assumption made by technical analysts is the fact that history repeats itself. Many stock charts have been in use and continue to be in use for over 100 years. This gives credibility to this method of trading because price movements have proven to be repetitive in nature. What is interesting about this assumption is what it says about market psychology. Basically, it shows that individuals who participate in trading the stock market tend to react consistently to similar or recurring market stimuli.

The technical analysis of stocks is interesting because traders don’t care if a stock is undervalued. Technical analysts only care about past trading data and where the security might move in the future. This is one of the reasons that so many fundamental analysts view this type of analysis in a negative light.

Technical analysis is a very interesting and effective method used by many of the word’s top stock traders. There is so much to learn about this type of analysis and so many variations that fall under it as well. Continue to learn about fundamental and technical analysis and determine what works for you.


Market Direction

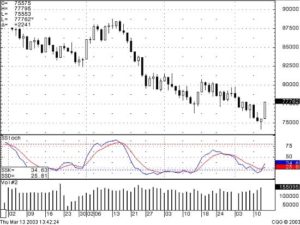
If you look at a chart of the Dow for the last three months, you can logically deduce that you would not have wanted to try to trade this type of market. It is absolutely sideways and it can be seen that candlestick formations did not produce any consistent trends. A bullish candle one day, a bearish candle the next day. That is what is clearly represented utilizing candlestick formations. How does this information benefit anybody when looking in hindsight? Price trends have consistent natures. After an extended indecisive trading period, what is usually expected? This answer is clearly illustrated when you see a flat series of Doji’s. Doji’s represent indecision. A series of Doji’s represent more indecision. However, there is a definite characteristic that can be found after investor sentiment has shown indecision. The next price move, whether bullish or bearish, will show excess  strength.

Knowing that information, simple analysis allows for a high degree of accuracy for projecting which direction that trend may move. As mentioned in previous newsletters, the last three months of trading have produced a Dumpling Top. This could be the prelude to a severe selloff. Investor sentiment is based upon the analysis of existing information/circumstances. Was the Dumpling Top the accumulative analysis, by the major research departments, that a financial crisis might be in the making? Could be, but because most of us do not have large research departments at our beck and call, analyzing the candlestick pattern becomes our tool. The fear, that sold the market off two weeks ago, was modified with the announcement of a potential bailout situation. Now that the bailout program seems to have been worked out, candlestick signals should produce a clear evaluation of what the market sentiment is doing currently.

As seen in the Dow chart, the big bullish Harami indicated the selling had stopped. The confirmation day moved right to the 50 day moving average. The next day made it obvious the 50 day moving average had acted as resistance the first time it was approached. But note what type of signal formation as been produced over the past three days. A Morning Star signal at the tee line. What happens when a major moving average is approached the first time and fails? It will usually have a pullback and then may test that level again. The fact that a Morning star signal has occurred at the tee line and stochastics are still in a slow upward direction provides some evidence that the 50 day moving average will be tested again. Usually the second test will breakthrough.

Technical Analysis of Stocks, DOW

DOW

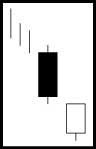
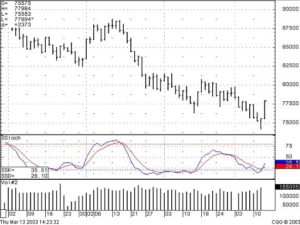
The power conveyed by bullish signals not only reveal the direction of a price move but they have an added feature. A strong bullish signal indicates the Bulls are taking control. The stronger the signal is, the better the trend can be evaluated even when the market is selling off dramatically. The intrinsic force built into the signals usually result in, at worst, a moderate pullback when the market is selling off. As illustrated in the Petrohawk En ergy Corp. chart, the Kicker signal indicated excessively strong bullish sentiment. The following three days, when the markets were selling off severely, the price of HK held up reasonably well. The same result as illustrated in the VCI chart. A major advantage of candlestick analysis is seeing where the buying strength is coming into a trend and identifying the trend has not reversed when the markets in general are selling off hard. This produces the opportunity to take advantage of the next move once the markets reverse their downward move and start moving back up. Obviously, this is not rocket science. This is merely being able to interpret the relative strength of a price move based upon its reaction to general market moves after a candlestick buy signal has been identified.

Technical Analysis of Stocks, HK

HK
Technical Analysis of Stocks, VCI
VCI

The past three months have been relatively boring as far as investments have been concerned. Is the mortgage bailout situation good for the markets or bad for the markets? Each one of us may have our own opinion. But that opinion does not mean a hill of beans. It is the general consensus of the whole investment community that is the important factor. The candlestick signals will make it visually clear as to how the majority of investors have assessed what the mortgage bailout will do for the economy. Let the market tell you what the market is doing.
 
Free Chat session tonight at 8 PM ET – What can we expect from the results of today’s decisions? Click here for instructions.

Good investing,

The Candlestick Forum Team


Candlestick Precision

This Week’s Special – 50% OFF!!

Scanning Techniques to Higher Profits!
Once taught only to Steve’s private clients; Now available on CD.

Click here for details

Website special reflects current newsletter. If you are reading an archived newsletter you will be directed to Current Website Special.

Candlestick Charts Provide the Most Important Technical Analysis Tools

There are many important technical analysis tools tools – but The most important technical analysis tools are Japanese Candlestick Signals.

Ask yourself this question; How many important technical analysis tools have lasted  for centuries? Hmmm, let me think, Japanese Candlesticks? Well, it certainly isn’t the latest trading craze bombarding your email inbox. The Japanese did not realize they would provide future generations with the most important technical analysis tools for the 21st Century.

Japanese Candlestick charting dramatically accelerates learning important technical analysis required to interepret stock charts. The education process is easy and you can  be successfully trading in no time. Unlike confusing line charts, candlesticks provide a visual depiction for reversals, trends or continuation periods. Successful trading can begin with the 12 Major Signals alone!

Join us, as we educate investors around the world to trade using the most important technical analysis tools available. Learn the 12 Major Signals, the Reversal Signals, and Continuation Patterns. Don’t forget to join Stephen W. Bigalow every Thursday evening for his free stock chat sessions. 

This article introduces the “On Neck Line” a Bearish Continuation Pattern

On Neck Line Candlestick Signal

ON NECK LINE
(ate kubi)

Description

The On Neck Line pattern is almost a ‘meeting line pattern’, but the critical term is ‘almost’. The ON Neck pattern does not reach the previous day’s close; it only reaches the previous day’s low.

Criteria

  1. A long black candle forms in a downtrend.
  2. The next day gaps down from the previous day’s close; howver, the body is usally smaller than one seen in the meeting line pattern.
  3. The second day closes at the low of the previous day.

Pattern Psychology

After a market has been moving in a downward direction, a long black candle enhances the downtrend. The next day opens lower, a small gap down, but the trend is halted by a move back up to the previous day’s low. The buyers in this up move should be uncomfortable that there was not more strength in the up move. The sellers step back in the next day to continue the downtrend.

Back to Continuation Patterns

Candlestick Forum Flash Cards

These unique Flash Cards will allow you to be “trading like the Pro’s” in no time.

Market Sectors – Organizing The Stock Market

Are you a clean freak? Does it drive you crazy when things are out of place or when a picture isn’t quite level? If you are at your friend’s house, do you wipe dust from a shelf or line up the towels when no one is looking? If so, you will like today’s topic; but don’t worry, we won’t lecture you on your obsessive compulsive side! The topic is market sectors and understanding and using them will not only tidy up your stock portfolio but will also help you to strengthen your trading plan as well.

A Definition of Market Sectors

They say a problem well defined is nearly solved; this can be applied to stocks as well. An investor needs a way to sort stocks; the basis of stock technical analysis relies on this comparison. If you can find common ground between two stocks, you can find a measurement of comparison. The best form of association is market sectors. “Market sectors” is a qualification method which looks at the type of business and groups them based on generally accepted names. One of the most common classifications breaks the market down into 11 different market sectors. Two are generally regarded as “defensive” and the other nine are referred to as “cyclical”. These market sectors are:

Cyclical Stocks
Transportation
Technology
Health Care
Financial
Energy
Consumer Cyclical
Communication
Capital Goods
Basic Materials
Defensive Stocks
Utilities
Consumer Staples


Defensive Stocks

Defensive investing with defensive stocks are beneficial to a portfolio because companies in these market sectors typically don’t experience as much stock volatility when the market has problems because people still use energy and eat. These are good stabilizers to use for portfolio diversification and offer protection in a falling market.
The downside of defensive stocks is that they don’t climb with a rising market. Although the market is doing well people necessarily use more energy or eat more food. Defensive market sectors follow the image that their name implies; they can be used quite well as hedge funds, stable stocks that prevent too much volatility in a portfolio.

Cyclical Stocks

Cyclical stocks cover the remaining market sectors and they typically react to a variety of market conditions. They do move independently, however, as one may be going up while another is going down. Because of this, purchasing from the cyclical market sectors requires good stock market strategies.

Why do we care about market sectors?

There are two important concepts with market sectors. First, by understanding the different market sectors, it is possible to find relationships between different companies. If you don’t know that one company is in the health care sector and another is in the energy sector, you might compare their earnings per share and draw conclusions that don’t apply. Second, understanding market sectors allows you to add valuable protection to your stock portfolio. By investing in a number of different market sectors, you can build a higher level of security for your investment. For example, if you invested $11,000 only in the communications sector and it dropped by 50% you will have lost $5,500 or 50% of your investment. If you invested equally in all eleven market sectors and the communications sector dropped by 50%, you will have only lost $500 or 4.5% of your investment. While the example is simplistic, the meaning is very clear; by spreading your investments over a number of market sectors you minimize your risks of a tumble by an entire sector.

Conclusion

Feel like doing a little “spring cleaning” on your portfolio now? By putting the stock market in the right baskets, you can know how to both evaluate a stock and insulate your portfolio from extreme risk. Most analysis matrixes start by comparing businesses from the same sector; as you use your stock trading plan to evaluate companies in similar market sectors, you will improve your decision making process. Then you can start trying to understand other important things like why those uneven towels bother you so much!

Learn Candlestick Analysis

Learn Candlestick analysis in order to enhance trading profits, buy stock and sell stock at optimal stock prices, and trade commoditiesfutures, and options more profitably. Traders learn Candlestick analysis in order to reliably predict stock price movement when trading stocks or commodity price movement when trading oil futures, gold futures, or corn futures. Options traders learn Candlestick analysis in order to predict price movement of the underlying equity when trading options as well. Candlestick analysis is derived from the insights of rice traders in Japan three centuries ago. Traders realized that there were repeating patterns in the price of that commodity. The patterns predicted whether the price of rice would go up, down, or stay the same. Because Candlestick patterns are displayed as a visual symbol they can be easier to follow compared to follow and understand than many technical analysis charts. Training in classes such as Candlestick Forum Boot Camp is a good way to start with Candlesticks and a good way to begin making profits from trading stock.

Traders learn Candlestick analysis in order to profit from trading stocks. Learning such patterns as the Doji or Bullish engulfing pattern will help the trader to profitably anticipate price variations. The old saying is that Candlesticks let the market tell the trader what the market will do. This is technical analysis in which the trader knows that all of the important fundamental analysis of the market is already known and that what makes a profit is successfully anticipating the sum of the actions of other traders. Traders can learn Candlestick trading tactics in online training webinars in order to enhance their basic stock market training. To learn Candlestick analysis is to learn a time honored system that has helped traders for centuries. Learning the signals in Candlestick trading requires a degree of study and a degree of practice. Taking an online class is an excellent idea because of the opportunity for the kind of give and take that speeds up the learning process.

Candlestick pattern analysis does not only work in trading stocks or commodities. It can also be useful in predicting price movement in buying calls and buying puts in options trading. By successfully anticipating a rise or fall in the price of the underlying equity a trader may be able to buy an out of the money option just before it becomes quite profitable due to the price movement of the underlying equity. As with trading stocks using Candlesticks, trading options successfully with Candlesticks relies on the fact that sound technical analysis reads the history of price movements and finds matches in current trading. Wise traders will profit from the difference between the strike price and spot price of a stock by letting Candlestick signals guide their purchase and sale of options contracts. The combination of leverage that options trading offers and the excellent ability of Candlestick signals to predict price movement is a great incentive to learn Candlestick analysis for profits in options trading as well as stock trading.


Market Direction

What is the most obvious candlestick signal? The Doji! It reveals there is investor indecision. The Japanese Rice traders have illustrated many times a reversal will occur after a day or more of indecision. Indecision was clearly evident in today’s trading. The indexes went positive very quickly during the day. They eventually came back down and tested the T-line. Early afternoon all the trading of both indexes move back into the positive territory. The Dow produced a type Doji. It produced a long legged Doji which illustrates bigger indecision. The fact that this Doji occurred at the end of a flat trading time frame has significance. It reveals the Bulls and Bears not knowing which way to move the trend. This indecisive trading makes tomorrow’s open a very revealing trend indicator.

Learn Candlestick Analysis, Dow

DOW

The NASDAQ formed a bearish engulfing signal after a small Doji the previous day. This also makes tomorrow’s open extremely important. A lower premarket futures would be an immediate indication to close out positions that should not be opening lower. It becomes a very easy process to analyze which charts are beginning to show weakness. A lower open would confirm the bears were taking control. This is not a difficult analysis. The candle formations clearly reveal whether the bullish force or the bearish force is becoming the stronger element.

Learn Candlestick Analysis, NASDAQ

NASDAQ

It should be reiterated that candlestick patterns provide a very powerful trading format. The investor sentiment has an expected result when these patterns start to perform. Although the market was relatively soggy after the initial open today, there were numerous Jayhook patterns providing excellent profits. A pattern is more likely to produce good results in spite of the general market direction.

Learn Candlestick Analysis, EDMC

EDMC

Learn Candlestick Analysis, OCLR

OCLR

The inherent forces built into candlestick signals and patterns are the product of investor sentiment working consistently through the decades and centuries. Human nature will always be the same. To not take advantage of the probabilities built into candlestick signals is to put your investing at an immediate disadvantage. Take the time to understand what should occur after each signal or pattern and you’ll be trading in the same manner as very experienced traders.

Chat session tonight at 8 PM ET, everybody is welcome.

Good Investing,

The Candlestick Forum Team


Current Website Special

Trend Analysis – ON SALE!!!

Fall 2010 E-Learning Online Training Schedule

Options Training Course 
October 16 & 17, 2010
Commodity Training
November 6 & 7, 2010
Boot Camp
November 20 & 21, 2010

Website special reflects current newsletter. If you are reading an archived newsletter you will be directed to Current Website Special.

Stock Market Day Trading Made Easy with Candlestick Signals

Stock market day trading works just as efficiently with candlesticks signals as they do when trading on a daily/weekly/monthly basis. Investor sentiment is as crucial a factor in stock market day trading has it is for long-term investing. The same information is revealed in a one minute and five minute time frame as the signals reveal in a daily or monthly time frame. Stock market day trading results improve dramatically when the short-term reversals can be clearly identified. The same psychology that is incorporated into investors thinking occurs in any time frame. Stock market day trading returns can be greatly enhanced using the time-tested 12 major candlestick signals. Click here for the 12 major signals special.

The candlestick signals revealed on a one minute chart can be utilized for a number of entry and exit strategies. Trading stocks or indexes using a one minute, five-minute, and 15 minute chart combination is a trading program that works very successfully. These chart combinations can be used for day trading or finding the optimal level for executing a longer term trade. A bullish candlestick signal may be followed the next day with some weakness. Utilizing the candlestick signals on the short term charts reveals when the next day’s initial selling finally ends. In an up trending stock, buying on the pullbacks becomes a very profitable technique.

Stock market day trading programs can greatly improve when applying candlestick signals, a very old and proven trading technique, with new computer generated technical analysis. David Elliott of www.WallStreetteachers.com has produced excellent technical research on finding indicator patterns that work a high percentage of the time. He’s analytical abilities have produced technical indicators that utilize the modification of the existing technical indicators.

For example, Bollinger bands do not provide a trading format to produce profitable trades. David Elliott has modified the Bollinger bands into MOBO bands, now making them effective profit making tools. His development of multiple stochastics formations produces highly effective short-term reversal setups. Applying this information with candlestick signals creates an extremely high probability trade. The melding of age old statistically proven candlestick signals with the capabilities of the indicators that are now available through instant computer analysis forms a very strong stock market day trading format.

Market direction

The Dow formed a Doji in Wednesday’s trading. The sellers confirmed the Doji at the top. A dark candle the closes more than halfway down the middle of the previous bullish candle before the Doji sets up a strong reversal signal, the Evening Star signal. The Evening Star signal reveals the expected profit taking that should come into a market after weeks of a sustained uptrend. With the Dow acting weak, revealed in a sell signal, as well as the NASDAQ acting weak, logic dictates that the sellers are starting to take control. It can be assumed that the sellers are starting to take over.

To review the full pattern description for How to Trade the Evening Star Signal – click here.

Candlestick Analysis Technician – Advanced Chartist

This course is designed for individuals already proficient in recognizing and utilizing Japanese Candlesticks for technical analysis of the markets.

Who should attend this event?

Serious traders looking to increase their proficiency in technical analysis. The Advanced Chartist workshop builds upon your knowledge base to take you to a higher level of expertise.

Registered Reps interested in furthering his/her understanding of technical analysis techniques for evaluating the overall market or individual security.

To assure the education process is reinforced and put into practice all seminar participants receive a 3-Month paid subscription as a Candlestick Forum Member.

Your Instructor for this workshop

Bigalow Bio Photo

Stephen W. Bigalow

Mr. Bigalow has over 27 years of investment experience, including eight years as a stockbroker with major Wall Street firms: Kidder, Peabody & Company; Cowen & Company; and Oppenheimer & Company.

He is the owner of the Candlestick Forum, LLC, an educational website to train the investing public on financial technical analysis.

Mr. Bigalow holds a Business & Economics Degree from Cornell University.

Candlestick trading books by Stephen Bigalow

Author of‘Profitable Candlestick Trading”, published by John Wiley & Sons in January 2002 and “High Profit Candlestick Patterns” published in 2005.

Contributor to professional trade publications such as;  Stocks & Commodities Magazine; Futures Magazine; Technical Analyst Magazine, and others.

Candlestick Analysis Technician – Advanced Chartist – Workshop Outline
Combining Candlesticks with other Technical Indicators

The professional investor makes sure to have as many probabilities in his favor when selecting exactly where to put limited capital. Combine candlesticks with other technical analysis, such as  Bollinger Bands, stochastics, moving averages, wave analysis, and Fibonacci retracement.

Advanced Pattern Recognition and Execution

Breakout Patterns – Knowing when to get on board and when to take profits

Cradle & Belt Hold Patterns – Easy-to-identify and foretells of a dramatic change about to take place

Fry Pan Bottom – the pent-up power created in this signal can produce very compelling profits.

Trading Gaps – Gaps represent enthusiasm to get into a position to the point that investors will pay prices away from any of the previous day’s trading range. Great for identifying panic selling at the bottom and exuberant buying at the top.

J-Hook Pattern – How to differentiate between profit taking and a full-scale reversal.

Stock Sectors – Putting Your Eggs In The Right Baskets

Investors look for ways to classify stocks. Because so much of stock technical analysis is based on comparison, it is important to find common ground. The best and most widely accepted form of association is stock sectors. “Stock sectors” is a qualification method which looks at the type of business and groups them based on generally accepted names. One of the most common classifications breaks the market down into eleven different stock sectors. Two are generally regarded as “defensive” and the other nine are referred to as “cyclical”. For successful traders, it is important to understand the differences between both these categories and the stock sectors they include.

Defensive Stocks

Utilities and consumer staples are referred to as defensive stocks. Companies in these sectors usually don’t suffer as much when the market experiences problems because people don’t stop using energy or eating. They are frequently used portfolio diversification and offer protection in a falling market.

However, the downside of the dampening effect of defensive stocks is that they usually fail to climb with a rising market. Just because the market is doing well, people don’t necessarily use significantly more energy or eat more food. Defensive stocks sectors do exactly what their name implies, assuming they are well run companies. These two stock sectors can be used as a basis of hedge fund investing – dependable, steadily moving stocks that prevent too much stock volatility in a portfolio.

Cyclical Stocks

Cyclical stocks are the other nine stock sectors. These stocks cover the remaining sectors and they typically move according to a variety of market conditions. They do move independently, however, as one may be going up while another is going down. Because of this, purchasing from the cyclical stock sectors requires your best stock market investing strategy. The nine cyclical stock sectors are:

  • Basic Materials
  • Capital Goods
  • Communication
  • Consumer Cyclical
  • Energy
  • Financial
  • Health Care
  • Technology
  • Transportation

Most of these stock sectors are easily understood. They include companies and products that are readily identifiable. Investors call them cyclical because they tend to move up and down in relation to businesses cycles or other influences.

Basic materials, for example, include those things used to make other goods – lumber, for instance. When the housing market is active, the stock of lumber companies will tend to rise. However, high interest rates might put a damper on home building and reduce the demand for lumber. These items define the stock market; traders look to buy from cyclical stock sectors when prices are low and sell when prices are high. In a nutshell, the cyclical stock sectors are the stock market!

How to Use the Information

Like our title, successful trading requires putting the stock market in the right baskets. Technical analysis actually starts with knowing from what kind of stock sector a business originates. By knowing the origins of a business, an investor can know how to evaluate its stock. Most analysis matrices start by comparing businesses from the same sector. As you use your stock trading plan, you will incorporate more technical analysis tools into your decision making process. Then you’ll be able to see why putting the market in the right baskets is a good thing!

Candlestick Charts, Easy Visibility For Identifying Reversal Signals

Candlestick charts provide distinct advantages over the conventional bar charts. The Japanese rice traders, boxing in the open and the close, produced enormous improvements for analyzing candlestick charts – information that would not be readily revealed in western technical charts. As illustrated below, a candlestick chart has much more visual clarity as to what is occurring during a trading day. Unlike the bar chart, the candlestick chart illustrates more definitively when buying is occurring during a daily trade session. Even though the price may be down for the day, the buying may have appeared from the time the price opened.

Just the contrast of the bullish candles versus the bearish candles provides a better indication of what the investor sentiment is on the candlestick charts.

Candlestick Chart Example 1

Candlestick charts illustrate the investor sentiment during each time segment. This benefit, not found on the bar chart, provides a much clearer depiction of what is actually occurring during each time segment.

Candlestick Chart Example 2
The multiple benefits incorporated into candlestick charts are visually obvious, to the point that many millions of investors use candlestick charts as their illustrating charts solely because they are easier to see, even though they do not understand how to use candlestick analysis.

The purpose of this site is to educate all those who want to take command of their own investment future. Centuries of candlestick chart analysis has continually produced high-profit trading. The Candlestick Trading Forum has created an easy-to-learn teaching program, for investors to become effective Candlestick Traders in a relatively short period of time.

This is not rocket science, this is the visual depiction of what is occurring in the minds of investors during any time frame. You can change you financial future very easily. Join a community of investors who are seriously trying to extract profits from the market on a consistent basis.


Additional Articles on Reversal Signals

Candlestick Images and Explanations – Illustrations of Major Candlestick Signals with pattern psychology and recognition

Analyzing Reversal Signals – Analyzing Reversals With Candlestick Signals

Dynamic Doji – The Dynamic Doji – A Clear Trend Reversal Signal

Morning Star Reversal Signal – The Morning Star – A Powerful Candlestick Reversal Signal, Stocks & Com

Members Only Stock Chat

Once a week our Members join Stephen Bigalow live via the internet every Monday evening 7PM CST!

Stock Chat is a pleasant method for interested investors to learn Candlestick Investing. The format of the stock related chat rooms has matured over the past few years. Early stock related chat sites were nothing more than insults and squabbles. Now these chat rooms have developed as a viable method to consult with other investors wanting feedback on stocks or trading programs.

The Candlestick Trading Forum invites Members to join our Stock Chat sessions on Monday  evenings at 7:00 CST. These sessions are oriented towards educating investors about using Japanese Candlesticks in real life analysis. The Stock Chat session provides an opportunity for Members to request reviews on specific stock positions. Steve provides an in-depth analysis of the market week ahead and reviews specific recommendations.

Back to Member Benefits

Technical Analysis Courses Should Utilize the Candlestick Signals

Technical analysis courses usually educate investors with masses of amounts of information. Technical analysis courses are usually directed towards providing numerous analytical techniques.  Unfortunately, many of these techniques are not crucial for pinpointing investment information. Most technical analysis courses instruct investors on watching indicators that other investors usually watch. The benefit of utilizing candlestick signals is being able to instantly evaluate what investor sentiment is doing at those levels that everybody else is watching.

The information that is built into candlestick signals reveal immediately what investment sentiment is doing.  If a candlestick buy signal occurs right on a major technical level, a level that many other investors are watching, the candlestick investor has the advantage of visually seeing the confirmation immediately of that level.  Other investors may require confirmation that comes in the form of additional buying.  That is a benefit to the candlestick investor.  They can get in before the rest of the technical investors get in.  There are many good technical analysis courses available. Click here to view training courses.   An investor that is planning to take technical analysis courses should learn candlestick signals before hand.  This knowledge will make any technical analysis courses much easier to comprehend.

The 12 major candlestick signals provide an immense amount of technical information. Learning the stock market becomes much easier when utilizing the correct analytical tools.  Applying the candlestick information to any information learned in technical and analysis courses will dramatically speed the positive results to investors accounts.  Learn each of the major signals.  The information that is conveyed in each one of the signals provides insights into price trends not found in most technical analysis courses.  The candlestick signals should be the basis of an investors analytical toolbox.

The Dark Cloud signal is a signal that tells an obvious reversal of a trend. It is name because it looks like a dark cloud over a nice bright sunny uptrend.

Dark Cloud

DARK CLOUD COVER

Description

The dark Cloud Cover is the bearish counterpart to the Piercing pattern. The first day of the pattern is a long white candle at the top end of a trend. The second day’s open is higher that the high of the previous day. It closes at least one-half way down the previous day candle, the further down the white candle, the more convincing the reversal. Remember that a close at or below the previous day’s open turns this pattern into a Bearish Engulfing pattern. Kabuse means to get covered or to hang over.

Criteria

  1. The body of the first candle is white, the body of the second candle is black.
  2. The up-trend has been evident for a good period. A long white candle occurs at
    the top of the trend.
  3. The second day opens higher than the trading of the prior day.
  4. The black candle closes more than half-way down the white candle.

Signal Enhancements

  1. The longer the white candle and the black candle, the more forceful the reversal.
  2. A higher the gap up from the previous days close, the more pronounced the reversal.
  3. The lower the black  candle closes into the white candle, the stronger the reversal.
  4. Large volume during these two trading days is a significant confirmation

Pattern Psychology

After a strong up-trend has been in effect, the atmosphere is bullish. Exuberance sets in. They gap the price up. The bears start to show up and push the price back down. It finally closes at or near the lows for the day. The close has negated most of the previous days gains. The bulls are now concerned. They obviously see that the uptrend may have stopped. This signal makes for a good short, with a stop being the high of the black candle day. Notice that if the Dark Cloud Cover were to close lower, below the open of the previous day, it becomes a Bearish Engulfing pattern. The Bearish Engulfing pattern has slightly stronger bearish implications.

Using candlesticks signals with other technical analysis greatly enhances the ability to recognize what the candlestick charts are revealing. Use of valuable information provided in the 12 major signals.  They will benefit you for the rest of your investment career.