Simple Stop Loss Strategies & Techniques

Simple Stop Loss Strategies can be easily used with Japanese Candlestick trading.

One of the most often-asked questions we receive at the Candlestick Trading Forum is how to use candlestick analysis as part of a simple stop loss strategy.

The fact is, not only is candlestick analysis ideal for pinpointing the exact time the successful trader or investor should enter the trade, but it is equally valuable in stop loss strategies. The proper use of candlestick analysis provides a simple, visual representation of the exact point in time when the reason for buying or shorting no longer exists.

Once you deeply, truly understand candlestick trading tactics, you will soon come to the realization that most of trading is just plain common sense. But, as I believe Mark Twain said, “Common sense is not that common”.
It amazes me each and every day to see all these “brilliant” stock annotators and stock analysts attempt to explain what happened in the market that day. As if the market cared one bit about their stock market fundamental and technical analysis. But I guess these guys and gals are just trying to do their job, feeding the all-too-human need of “Having to Know Why Something Happened”.

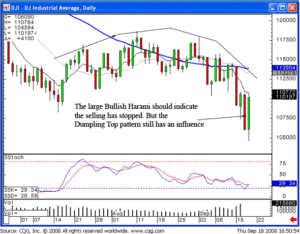
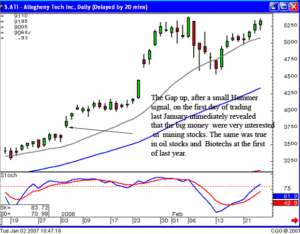
Candlestick Traders don’t need to know “why something happened”. They just look at the candlestick chart patterns and know “something happened”. In a strong reversal pattern, “something happened’ to totally change the HUMAN EMOTIONS of the HUMAN BEINGS buying or selling that stock or commodity. After all, the candlestick patterns are simply the visual representation of human psychology – of Greed and Fear.

So, when using simple stop loss strategies in their overall stock trading system, the Candlestick Trader does not need to know WHY the stock is now going down after they bought it. The fact is, it IS going down. The psychology has changed.

Simple Stop Loss Strategies Involve Knowing The General Market Direction. The investment psychology of the market, in general, can be easily seen in the Japanese Candlestick signals. Use that stock market information to change the makeup of your portfolio. During “iffy” periods, having long and short positions will provide better probabilities to make profits, even when the direction of the market is not clear.

Stop Loss Strategies and Techniques using the candlestick method

Protecting your assets – that is the main objective for putting on stop losses. The stop loss objective is to provide a point where the reason for buying or shorting becomes null and void. Many stock market strategies incorporate stop loss objectives into their trading formulas for closing a trade gone sour. Usually this is done by establishing a percentage loss as the parameter. Here is the first myth to be bashed: The candlestick method completely disregards a preset formula for stopping out.

One of the major investing mistakes is using a prescribed percentage as the stop loss. Your purchase price becomes an important function of where you are to stop out. The stock market investing advice given by some investment advisors recommends three percent as the stop-out level. Others suggest eight percent. But where you buy a trade position now becomes the quantitative element of where you should place your stop.

The most important factor for establishing a stop loss is very basic. What price point would indicate the established trend has been negated? This now becomes a stop loss level established based upon the trend being stalled and/or negated.

As with all of candlestick analysis, this becomes a ?common sense? evaluation. If you have put on a long position based upon a bullish buy signal, where would the price have to back off to confirm that the sellers were still in control?

A signal has significant meaning. Knowing that, the thought process for when to stop out of a trade becomes easy. A buy signal indicates a new trend. What would counter that ?indication??

Probabilities mean being in that trade has favorable odds for profitability, not any guarantees. Even though a majority of trades will work using the signals, some trades won?t work. Keeping that mindset in focus as well as other candlestick basics, stop loss analysis creates a format for identifying when a trade is not working and getting out of the trade as soon as possible.

Establishing the stop loss point involves using the same common sense approach incorporated throughout the candlestick method and other stock investing concepts.

Studying stock chart patterns will vastly improve your ability to recognize when and where a stop loss should be placed on a trade. Study candlestick chart formations with extensive downtrends. Often a fizzled buy signal can be found. Recognize what the trading candles did after the buy signal and what selling candles negated the buy signal.
Keep in mind that all trades do not work. Learn to move out of those trades and move to other trades immediately.

Trading Strategies

Trading Strategies for Playing the Stock Market

Trading strategies discussed in this article include swing trading and day trading. Both are very similar but the main difference between theses two strategies is the time frame in which stocks are bought and held. In today’s article we will discuss both of these strategies as well as the advantages and disadvantages of each.

Swing trading typically involves a smaller position size than when day trading stock online. Additionally, swing traders will typically hold onto stocks for a few days to several weeks and then trade the stock on the basis of its intra-week or intra-month movements. Stop loss orders are placed wider than when day trading as well. When determining exits when swing trading there are rules that every trader should follow. It is very important that the trading strategies as well as the trading rules are understood before placing trades in this fashion. For instance, if the prior day’s low is taken out on the breakout day, or the high for shorts, then the trader should exit the trade. Also, once a trade is held overnight, a stop loss order should be placed no further away than below the recent consolidation area. A move beneath it would indicate a failure.

Swing trading stocks has its advantages and disadvantages as all trading strategies do. Some advantages include that swing traders can place fewer trades, therefore requiring fewer commissions and less chance of making a mistake. Additionally this type of stock trading provides the ability for successful traders to catch more significant multi-day profitable traders. A disadvantage to swing trading is the fact that the higher profit targets come with higher risk per trade. There is also overnight exposure that cannot be predicted.

Day trading stocks requires a larger positions size since you are looking for a smaller move within a short time frame. Unlike swing traders, a day trader may trade a few times per day or more! There are also rules with day trading that every investor should follow. For instance, they should always keep their profit objective at least 3 times greater than what they are willing to risk. Also, day traders should allow no more than 1% move against them from the entry point. There are many more trading strategies and rules when day trading that investors should learn in addition to these two rules.

Day trading also has its advantages and disadvantages as well. When day trading there is no overnight hold exposure and investors can profit from both long and short and take advantage of quick swings in both directions. There is also a higher percentage of winning trades when taking quicker profits and smaller investment risk. The disadvantages to this type of trading can be the trading costs which tend to be high when trading as frequently as you do when day trading. Also this investment strategy requires constant attention to the markets and a lot of effort.
Both trading strategies are a great way to make money in the stock market. Continue to research them both as well as other strategies and find one that works for you.


Market Direction

The true benefits of candlestick analysis revealed itself over the past week. For the past two months there has been a sideways, indecisive trading trend, especially in the Dow. But as the trading proceeded this summer, a definite Candlestick pattern was developing. A Dumpling Top! The Dumpling Top is the opposite of a Fry Pan Bottom. It is a slow rounding top that clearly demonstrates a gradual decline of investor sentiment. Despite the fact that stochastics were heading toward the oversold condition, the result of the buildup of negative investor sentiment usually will culminate in a dramatic down move. The opposite is true in a Fry Pan Bottom pattern. The eventual buildup of bullish sentiment gets the best results once a break out has occurred at the end of a pattern.

As seen in the past few months, the commentary of what the market direction was doing was not very specific. This was the result of a sideways market that was not showing any definite direction or candlestick signal confirmation. That does not necessarily mean there was a lack of trend analysis. The trend analysis was there was no definite trend. This is what the Japanese Rice traders mean when they say “let the market tell you what the market is doing”. Having that knowledge allows an investor to make the proper allocation to their trading program. That could either be trading on a very quick basis, scalping short term profits, or staying out of the market altogether.

Trading Strategies, Dow

DOW

But like all market conditions, they eventually change. The more the sideways activity of the Dow occurred, the more clear it became that a slow rounding top was forming. This made the projection of a hard sell-off more anticipated. Why? Because that is usually the result of a Dumpling Top pattern. Candlestick analysis allows an investor to finely tune their analysis for a price trend. Knowing what the results should be from a specific signal or pattern makes for very simple “if/then” expected results. The different elements of a market trend can be analyzed instantly based upon the visual characteristics included in the signals and patterns. The downtrend of the past week was more readily anticipated because of the pattern that was being formed. Taking advantage of sell signals for short positioning or buying the short funds is the result of knowing what a Dumpling Top pattern should produce.

This is not difficult information to learn. The signals and patterns are the product of common sense investment perspectives put into a graphic depiction. The basis of candlestick signals is to inform what is going on in investor sentiment. Once that information is known, the appropriate trading strategies can be applied. The Dow formed a huge Bullish Harami today, retracing 410 points of its 449 point loss yesterday. What is required to confirm a Bullish Harami? Additional bullish trading the next day!  Note how the Dow came up and just touched the tee line. What would we like to see to it instigate bullish positions tomorrow? Positive trading bringing the Dow up through the tee line!  Would this be a comfortable time to be buying and letting positions run? Probably not, not until the rounding top configuration was breached. This would mean any long positions put on tomorrow should be watched diligently to see if the Dumpling Top is still going to act as the predominant analytical feature or if the Bullish Harami will instigate strong enough buying to breach the downward trajectory of a Dumpling Top. This means keeping a finger on the trigger.

Each signal and patterns creates expected results. The Candlestick Forum recommended CCOI a few days back after a gap up from a Doji. What was required the next day to enter the trade? Bullish confirmation! However, with the price opening lower the next day, a direct result of the bearishness in the markets, the position was not executed. What becomes a simple entry strategy?

If the price came back up through the closing price of a bullish candle that indicated the Bulls were taking control, that would be confirmation the Bulls were still in the trade. Candlestick signals provide very simple and effective entry and exit strategies for successful investing. It is all based upon common sense investment principles applied to a chart pattern.

Trading Strategies, CCOI

CCOI
 
The Candlestick Forum Online Training Program

The Candlestick Forum Online Training program scheduled for September 20 and 21st has been postponed to October 4th and 5th due to the effects of Hurricane Ike in the Houston area. We will get more details to everybody in the coming weeks. We apologize for the inconvenience but due to the lack of power and Internet connections in Houston, we have not been able to disseminate information in the proper manner.
Also, our apologies for those that have been tried to order or communicate with us over the past few days. The Candlestick Forum staff will be working extensively to get caught up on all communications as soon as we have access to the Internet.

Chat Session – we will have a chat session tonight at 8 p.m. ET. Everybody is welcome. We will be discussing the ramifications of a dumpling top and how to trade these market conditions. Come join us.

Good investing,
The Candlestick Forum Team

A Discussion of Options Exchanges

An important part of formulating a stock trading plan is provisions for options trading as well. In the options exchange, options orders are agreements between two investors where one party agrees to deliver something in the stock market to another party within a specific time period and for a specific price. Ownership, as normally defined, does not exist because you don’t need to possess a particular stock in order to implement a position.

In the options exchange, a stock order, whether it is a “call” (an agreement to purchase) or a “put” (an agreement to sell), gives the holder the right to purchase the designated options; in addition, the holder is entitled to simply let the options order expire without investing further.

Options Exchanges

When formulating a trading plan for options, your investment philosophy will be unaffected by the options exchange and their locations. With the use of the Internet and options trading advisors, location is not much of an issue. Some of the better known options exchanges are:

  • Philadelphia Stock Exchange (Philadelphia, PA)
  • Chicago Stock Exchange (Chicago, IL)
  • American Stock Exchange (New York, NY)
  • Chicago Board Options Exchange (Chicago, IL)
  • Pacific Stock Exchange (San Francisco, CA)
  • Cincinnati Stock Exchange (Chicago, IL)
  • International Securities Exchange (New York, NY)
  • New York Board of Trade (New York, NY)
  • New York Stock Exchange (New York, NY)
  • NASDAQ Stock Market (New York, NY)
  • Boston Stock Exchange (Boston, MA)
  • Kansas City Board of Trade (Kansas City, MO)
  • Philadelphia Board of Trade (Philadelphia, PA)

Types of Options Orders

Options orders cover in a number of different scenarios, offering the investor the ability to buy or sell and setting conditions for the transactions. The following are some of the options orders that are available:

  • Buying Calls – Buying a Call in the options exchange is a bullish options order on an underlying stock value. The investor has the opportunity to speculate on the rise of the stock’s value for the term of the contract with a predetermined risk. Most investors will look to sell their contract at a profit, while others may intend to exercise their right and purchase the underlying shares.
  • Buying Puts – Buying Puts in the options exchange is a bearish, somewhat speculative options order in which the investor anticipates that a stock will decrease in price during a set period of time. The trader realizes a profit when the stock and its underlying put option decrease in price during a set amount of time.
  • Selling Puts – When you sell puts in the options exchange, you are selling someone the right to sell you the underlying asset at a fixed price, on or before the expiration date of the option order. You can use this options order when you are bullish on the market and feel that it isn’t likely to go down in the short term, you can sell puts on a quality asset that you would like to own at a discount.
  • Selling Covered Calls – Selling a covered call is an order in the options exchange where investors are willing to pay for the right to take a stock if it reaches a much higher price. It is an excellent strategy to implement while waiting for a stock to reach your identified sell point.
  • Buying Strangle – A strangle buy in the options exchange is implemented by purchasing a call option and a put option on the same asset with the same strike price and expiration date.
  • Buying Straddle – A buy straddle is implemented by purchasing a call option and a put option on the same asset with the same strike price and expiration date. In the options exchange this is a desirable move because the risk is limited to losing the premium paid but its reward is unlimited.
  • Buying Calls – Buying a Call is a decidedly Bullish position on an underlying stock value. The investor has the opportunity to participate in the rise of the stock’s value for the term of the contract with a predetermined risk. Most investors will look to sell their contract at a profit, while others may intend to exercise their right and purchase the underlying shares.

Improving Your Odds In The Options Exchange

Is there anything else you can do to increase your chances of success in the options exchange? Yes there is; using a trading system like Japanese Candlesticks adds a powerful charting system, especially in the options exchange. Candlesticks was invented over 300 years ago as a method for trading in the rice markets of ancient Japan. The success of the system has grown and developed and it is an amazing tool for today’s options exchange. With the charting abilities you will gain from Japanese Candlesticks you could literally have a view inside the directions of options before they even move. Added to your trading plan, Candlesticks can put you in the right company for successful trading in the options exchange.

Options Analysis – Trading the Hype For Success

If you have ever browsed the Internet looking for stock tips, the offers jump off of the page literally screaming at you. “Start trading for BIG PROFITS by turning less money in MORE MONEY!” or “93% Winners, $18k Profit” or my favorite “Find out how to make over 87% gain monthly. Up 954% since Jan 2006!”

In spite of any promises that might be made to you, investing in the stock market has not been turned into some easy-to-learn program with astounding results, especially in the options markets. Substantial profits can be made but not because of some miracle program; if such a program existed, we would all spend the $49.95 to buy it and be incredible rich. In reality, profits are usually the result of strong options analysis, successful stock trading plans and technical analysis.

In theory, options analysis and options trading are easy; all you need to do is find stocks that are going up and buy calls on them. Then you find stocks that are dropping and sell puts on them. That’s pretty easy, right? Well if it’s easy the reason is that you have spent the time researching, not because of some program off the Internet. Technical analysis and charting give you the silver bullet to increase your success in the stock market and a trading system like Japanese Candlesticks is the most powerful system available for options analysis.

What is Japanese Candlesticks?

Japanese Candlestick signals were invented around 1700 as a method of analysis in the country’s rice markets. The Japanese Rice traders analyzed reoccurring signals on trading charts when trying to pinpoint the exact times to get in and get out of their positions. Analysis with these signals made the Honshu family immensely wealthy. The signals they identified are as effective today in options analysis as they were centuries ago because while they were developed for futures analysis, they are equally powerful in options analysis.

Options analysis with Candlesticks

Candlestick charting is superior to standard bar charting. Bar charts are limited to showing you a price range for a given time period; it does not show you patterns which can help with identifying trading patterns. Japanese Candlesticks provides the type of insight needed for successful option analysis. Candlesticks is extremely powerful for options analysis because it provides the user with the three criteria of options trading: direction, time and magnitude.

  • Direction – Most investors have difficulty in identifying the direction of a price move. Utilizing Candlestick analysis greatly increases the probabilities of at least having a price move analyzed in the proper direction. Knowing the direction of a trend with a relatively high degree of probability allows the trader to produce high profit option strategies.
  • Time – The amount of time available for a movement in price is also an important factor. The strategy for a trade will be vastly different when considering a trade that will expire in one week versus a trade that will expire in two months.
  • Magnitude – Magnitude, the third key element, indicates stock volatility. Volatility is both the friend and the foe of investors. The Candlestick signals provide the ideal search technique for finding the trades that will move in the magnitude required to make successful trades. Utilizing gaps located by the Candlestick charts provides a source of high profit potential trades. Gaps, or Windows, appear during options analysis and indicate to investors when they should get in or out of a position with vigor.

Conclusion

Because an investor is able to analyze direction, time and magnitude with Japanese Candlestick charts he or she is better equipped for options analysis and for knowing when to enter or exit positions. Options analysis with Japanese Candlesticks is not a magic wand for conjuring successful trades but a valuable tool for identifying conditions in the market and finding the profitable times to enter and exit trades.

An Overview of Trade Options

Trading investment options. If you search the Internet for “trade options” you will be flooded with two types of responses. The first will be “use my system to trade options and you will be insanely rich”. The second thing you will notice in your search results is that trade options and futures options seem to be linked together like two star-crossed lovers from a soap opera. While the two are similar, they are definitely different animals altogether.

Differences Between Futures and Options

The main similarity between trade options and futures is that both are “derivatives”, meaning that they have no independent value. Futures and options are contracts binding two parties and the terms of those contracts make the difference between the two.

A futures contract gives its buyer the obligation to purchase the asset in the futures market and the seller to sell it at a preset date. If the futures holder liquidates his position prior to expiration, the delivery clause is voided, obviously.

By contrast, an options contract or stock order, whether it is a call (an agreement to purchase) or a put (an agreement to sell), gives the holder the right to trade options; in addition, the holder is entitled to simply let the option expire without investing further. Options can be low-risk ways to make money in the stock market because many times you can exit a trade option that is unfavorable for only the price of the premium.

Types of Trade Options
Trade options cover in a number of different scenarios, offering the investor the ability to buy or sell and setting conditions for the transactions. The following are samples of the trade options that are available:

  • Buying Calls – Buying a Call is a bullish position on an underlying stock value. The investor has the opportunity to speculate on the rise of the stock’s value for the term of the contract with a predetermined risk. Most investors will look to sell their contract at a profit, while others may intend to exercise their right and purchase the underlying shares.
  • Buying Puts – Buying Puts is a bearish, somewhat speculative technique in which the investor anticipates that a stock will decrease in price during a set period of time. The trader realizes a profit when the stock and its underlying put option decrease in price during a set amount of time.
  • Selling Puts – When you sell puts, you are selling someone the right to sell you the underlying asset at a fixed price, on or before the expiration date of the option. When you are bullish on the market and feel that it isn’t likely to go down in the short term, you can sell puts on a quality asset that you would like to own at a discount.
  • Selling Covered Calls – Selling a covered call means that there are investors willing to pay for the right to take a stock if it reaches a much higher price. It is an excellent strategy to implement while waiting for a stock to reach your identified sell point.
  • Put Hedge – A Put Hedge is the technique of buying puts during a bearish market to protect stock shares that, while the trader is reluctant to sell, are vulnerable to a decline in the market. Successful traders utilize strategies such as Put Hedges to insulate their portfolios from loss in a bearish market. This method also has the potential of unlimited profits, while at the same time limiting the potential loss by the investor.

Conclusion

There are quite a few more trade options available for your use; discussing you trade options with your broker can help to identify those that are available to you. Whether you are looking to capitalize on an upward movement of a stock or make defensive profits in a bear market, options are an excellent way to make money investing in the stock market.

Futures Exchanges – Knowing Where To do Business


Good for you! You’ve been reading, you’ve put together a trading rules to lay the foundation for your futures trading plan and you’ve even been paper trading to prove your trading plan. Now you are ready to learn more about where you will be doing your business; it’s time to talk about the futures exchanges.

General Futures Exchange Information

As you know at this point, you will not actually do business with the futures exchanges listed below. You will work with your broker who will take your futures orders to the exchange floor for you. Since you have been paper trading, you probably have already established an account for commodities trading so we won’t go over that again. While there are futures exchanges throughout the world, we will focus on the ones in the US. The markets we will outline are in Minneapolis, Kansas City, New York and Chicago.

History of Futures Exchanges in the US

The modern futures trading began in Chicago, IL in the early 1800s. Chicago, with its location at the base of the Great Lakes, is close to the farm of the U.S. Midwest which made it a natural center for transportation, distribution and trading of agricultural produce. Gluts and shortages of these products caused extreme changes in price. An exchange was needed that would bring together a market to find potential buyers and sellers of a commodity instead of making people bear the burden of finding a buyer or seller. In 1848, the Chicago Board of Trade (CBOT), the world’s first futures market, or futures exchange, was formed. Trading was originally in futures and the first contract was written on March 13, 1851.

Futures Exchanges

Different futures exchanges trade different commodities. In addition, each future exchange accepts different futures orders. Since not every exchange allows every order it is necessary to talk with you broker about which orders are permitted in the markets you trade. The following is a list of the major commodity exchanges, their commodities, and the orders that they accept:

Chicago Board of Trade
Location: Chicago, IL
Commodities

  • Corn
  • Oats
  • Soybeans
  • Soybean Oil
  • Soybean Meal
  • T-Bonds
  • T-Notes
  • Muni Bonds
  • 5 Year Notes
  • 2 Year Notes
  • DJIA Index

Acceptable orders: Market, Market on Close, Limit, Stop, and Fill or Kill Orders

Chicago Mercantile Exchange
Location: Chicago, IL
Commodities

  • Live Cattle
  • Lean Hogs
  • Lumber
  • Feeder Cattle
  • Pork Bellies

Acceptable orders: All futures orders are acceptable.

Index and Option Market
Commodities

  • S&P 500
  • Mid-cap 400
  • NASDAQ 100

Acceptable orders: All futures orders are acceptable.

International Monetary Exchange
Location: Chicago, IL
Commodities

  • T-Bills
  • Euro Dollars
  • Canadian Dollar
  • Euro Currency
  • Australian Dollar
  • Mexican Peso
  • Euro Yen
  • Japanese Yen
  • British Pound
  • Swiss Franc

Acceptable orders: All futures orders are acceptable.

New York Comex
Location: New York, NY
Commodities

  • Copper

Acceptable orders: For Copper only, acceptable are Market, Market on Close, Limit, Stop, and Fill or Kill.
Commodities

  • Gold
  • Silver

Acceptable orders: For Gold and Silver, acceptable are Market, Market on Close, Limit, Stop, and Fill or Kill. Stop Limits are acceptable only on a not-held basis.

New York Cotton Exchange
Location: New York, NY
Commodities

  • Cotton
  • Orange Juice
  • Dollar Index

Acceptable orders: Market, Market on Close, Limit, Stop, and Fill or Kill.

New York Coffee, Sugar & Cocoa Exchange
Location: New York, NY
Commodities

  • Coffee
  • Sugar
  • Cocoa

Acceptable orders: All futures orders are acceptable.

New York Mercantile Exchange
Location: New York, NY
Commodities

  • Unleaded Gasoline
  • Platinum
  • Palladium
  • Heating Oil
  • Crude Oil Natural Gas

Acceptable orders: All futures orders are acceptable.

New York Futures Exchange
Location: New York, NY
Commodities

  • New York Stock Exchange Index
  • CRB Index

Acceptable orders: All futures orders are acceptable.

Kansas City Board of Trade
Location: Kansas City, MO
Commodities

  • Kansas City Value Line
  • Kansas City Mini Value Line

Acceptable orders: All futures orders are acceptable.

  • Kansas City Wheat

Acceptable orders: Market, Market on Close, Limit, Stop and Fill or Kill.

Minneapolis Board of Trade
Location: Minneapolis, MN
Commodities

  • Minneapolis Wheat
  • Minneapolis White Wheat

Acceptable orders: All futures orders are acceptable.

Learning To Trade Futures


It has been said that success in this life is made up of equal parts of learning and yearning. For nearly everyone, it’s possible to accomplish your goals if you have sufficient desire and education. If your desire is to trade futures, you already have a direction; next, you need to couple a relentless pursuit of education with a strong desire to succeed at something very interesting and potentially rewarding. Commodity trading can be complex and frustrating but it is also well worth the effort.

Necessary Traits to Trade Futures

What are the four things necessary to trade futures? They are:

  1. You Need to Have the Desire to Succeed As a Trader – There is a certain air that is needed to trade futures…part student, part bulldog, part daredevil. Desire to succeed will push you to learn more and trade futures smarter.
  2. Persistence and Motivation – This is a by-product of your desire. Once you have the desire to succeed, you will be willing to put in the time to learn to trade futures and the motivation to make your new business a success.
  3. Discipline, Discipline, Discipline – Discipline to learn the nuances of how to trade futures, discipline to do technical analysis, and the discipline to make smart futures trades. If you trade futures like it is a business you will acquire the discipline to be successful.
  4. Someone to Help You Get Started – Whether you learn from someone you know, from going to seminars, or reading books, you will need some help when you start to trade futures. It is important to learn the terminology, techniques and practices that make a successful trader and that knowledge is best passed down from person to person.

An Overview of Futures Trading

Futures trading is different that investing in the stock market or bonds since you don’t actually own anything; in futures trading, you are speculating on the future direction of the price in the commodity you are trading. This is like a bet on future price direction. The terms “buy” and “sell” merely indicate the direction you expect future prices will take. He or she must only deposit sufficient capital with a brokerage firm to insure that he will be able to pay the losses if his trades lose money.

Futures trading is a sort of insurance plan for those who are trading and investing. A farmer may sell futures on his wheat crop if he thinks the price will go down before the harvest; conversely, a bread manufacturer may buy futures if they think the price of wheat is going to rise before the harvest. Regardless of the price movement, both are guaranteed their price. The final component of the equation is the investor in futures trading who looks for changes in the futures markets and seeks to gain advantages by buying or selling at a profit.

The Potential of Futures Trading

Trading futures is an excellent way to make money. It is said that Richard Dennis, a famed commodities trader, was able to parlay $1,600 of borrowed money into $200 million over ten years. Futures trading has a bad reputation as being filled with risk and while there is risk, the truth is that futures trading is only as risky as a trader makes it. This is not the lottery or a trip to the casino; if you take a conservative approach, look for a reasonable return and make this a business then the probability of success in commodity trading is very good.
Some of the better known futures markets are:

  • Agriculture – This is a broad, commonly traded futures which includes such things as wheat, soybean and corn futures.
  • Currency Trading – Currency trading, also known as FOREX (foreign exchange) trading, this involves buying and selling currency from many different countries such as the US dollar, the British pound and the Japanese yen.
  • Interest Rate Futures – This market focuses on financial transactions, interest rates and bonds.
  • Energy Futures – This market centers its attention on gas and oil futures.
  • Foods – This sector includes items such as coffee, sugar and orange juice.
  • Metals – This is one of the more popular and better known sectors. The typical commodities in metals are gold and silver.

Trade Anywhere

One of the real advantages when you trade futures is that you can literally do it anywhere. Since market data can be delivered easily via the Internet, you are free from any geographic restrictions, allowing you to implement trades from almost any location in the world.

Getting Started

In order to get started, you need to equip yourself with a good understanding of how to trade futures, which markets you will target, and above all, you need a trading plan. The trading rules in your plan will help you to understanding yourself and your responses to the things you see on the charts. You need an unemotional approach, backed up by the confidence that you can do it. This confidence comes from proving to yourself that you can win more often than you lose when you trade futures.

Futures Markets


When formulating a trading plan for futures, it is important to think about the futures markets where you trade. There are a number of futures markets with adequate liquidity for speculation, but when choosing a market it is important to choose based on your account size, level of risk and investment philosophy. Above all it is important to be diversified; each market has its big move every year. Being diversified helps increase your chances of catch those big moves that make for successful trading.

Other Factors in Choosing Markets

Another key to choosing your futures markets is history. Futures markets that have more big trending moves are more likely to have them in the future as well. The following list represents some of the best trending futures markets:

  • Currencies – Currency trading is the sector that trends the best. The best currencies to trade are the Swiss franc, the German mark, the Japanese yen and the British pound.
  • Interest Rate Futures – T-Bonds represent long-term interest rates and Eurodollars are for short-term interest rates.
  • Energy Futures – Natural gas, heating oil and crude oil futures all make for good trades.
  • Food Sector – Coffee, orange juice and sugar are the recommended commodities.
  • Metals – Gold, silver and copper are traditionally strong commodities.
  • Agricultural – Cotton, soybeans, oats and corn futures outperform the others

Now you have a short list of commodities that have a history of trending well. The next step is to solidify your trading rules or your trading plan.

These rules should include:

  1. Reviewing – This is a critical part of the process. You wouldn’t jump out of an airplane with a parachute that wasn’t inspected prior to being strapped to your back; the same principle is true with your trading plan.
  2. Strict Guidelines – Your trading plan must be specific and precise. Having a tested, reliable trading plan we give you something solid when you hit a losing period.
  3. Testing – Thanks to the computer age, you can successfully test your trading plan. Without this ability, your trading plan is left to chance. Does it work or fail? Testing will give you the confidence you need to be a successful trader.

The final step is to go live with your new wisdom. You’ve identified your target markets, formulated, reviewed and tested your trading plan; now is the time to put your hard work to use. The futures markets have something in common with the stock market; a well informed, patient investor is more likely to succeed than someone just stabbing in the dark.

Is there anything else you can do to increase your chances of success in the futures markets? Yes, there is. Implementing a trading system like Japanese Candlesticks adds a powerful charting system, especially in the futures markets. Candlesticks was invented over 300 years ago as a method for trading in the rice markets of ancient Japan . The success of the system has grown and developed and it is an amazing tool for today’s futures markets. With the candlestick charting abilities you will gain you could literally have a view inside the directions of futures before they even move. Added to your trading plan, Candlesticks can put you in the right company for successful trading in the futures markets.

Stock Portfolio – Seven Questions For Stock Market Success

Any time an investor is looking at companies for stock portfolio diversification; there is a list of seven questions that should come to mind before buying. These questions will help successful traders to discover the strengths and weaknesses of a company, as well as helping to understand the business economics and market position of the company. Such an investigation of a company would fall in the category of fundamental analysis and is important to making a wise decision on the purchase of a company’s shares and to understand the stock portfolio advice that you might receive.

Where does the company get its cash flow?

The value of any asset is the net value of its discounted cash flows. A trader can’t even evaluate a company or give stock portfolio advice unless he or she knows how the company is generating its cash. This is critical and needs to be specific and void of assumptions. Domino’s Pizza is a perfect example of such a need for understanding cash flow. Millions of people recognize the brand for Domino’s. It’s easy to assume that the company generates their revenue from their pizza sales. While Domino’s does make pizzas, many of the actual stores are franchises, separately owned and making products according to the ingredients and recipes of the parent company. In other words, Domino’s creates the pizza and other products that its franchises make. After making this connection, it is easy to see how important the relationship between Domino’s and its franchises is to the company’s value in the stock market.

How much cash does the company generate and how quickly?

After identifying where a company gets its cash flow, the investor need to understand approximately how much income it generates and the timing of the cash flows before giving stock portfolio advice about the company. Because of the time value of money, a company that makes a million dollars today is worth more than a company that makes two million over the next twenty years. Making such connections between cash flow and time is critical to implementing a successful stock market strategy.

Can the company sustain its cash flows?

In a time that many traders can still remember, the American steel industry was considered a blue chip stock and countless analysts advised adding it to a stock portfolio. An extended stock price history of profitability led many investors and analysts to believe that this business would always be strong investment. The past, however, is of little value in projecting future cash flows. One way to evaluate whether a company can sustain its cash flows is to look at the barriers of entry for the industry sector in which the company operates. A new pharmaceutical manufacturer will no doubt struggle trying to enter that sector due to industry giants and oppressive costs of dealing with the Food and Drug Administration. Because of this, such a company might not prove to be a successful investment and its purchase might end up being a bad stock portfolio investment option.

How costly is a business to operate?

Some companies require a great deal of capital to make their profits, while others can operate successfully on very little revenue. A utility company needs billions of dollars each time it opens a new power plant, yet an Internet company can survive on a small amount of ad revenue while it develops its product. The less money it takes to run a business, the more attractive it will be for someone investing in the stock market and the more desirable it is to give investors the advice to add it to their stock portfolio.

Does the company managed in a shareholder-friendly manner?

The approach of a management team towards the shareholders is extremely important in the company?s success. A company that looks at its own investment options, such as repurchasing shares when the stock prices have fallen rather than invest in another company is more likely to create wealth than a one only looking to build its ?kingdom?. A company?s own actions can usually be the best stock market investing advice.

Is the management team true to its word?

A big part of learning how to play the stock market is learning to decipher the difference between a company?s public statements and its actions. An investor’s stock portfolio will suffer if a company is included that doesn?t operate honestly is not a good investment.

Is the price attractive?

Simply put, price is the single most important technical analysis tool. The most common metrics for stock technical analysis are found because of the share price. A $20 per share company that earns $6 per share has a yield of 30%, but a $100 per share stock that returns the same $6 only turned a 6% yield, hardly anything that will excite investors or cause a company to be included in anyone?s stock portfolio.

The best investment advice happens to also be the best stock portfolio advice; follow the money flow. If a company is successful at making and sharing its money, it will be a company that has strong investment potential.


Market Direction

The end of the year is an excellent time to evaluate your investing. Not so much the prospects for the coming year, but what could have been improved during the past year. Most investors optimistically project that they will do better the coming year. But they spent little time analyzing what they could have improved upon from the previous year. That is a function of not having an accountable investment program. Did you buy some stocks because some of analysts said that was going to be a strong industry? Did you buy some stocks because the price of gold/crude oil/corn was going to go higher? Did you buy some stocks that were going to improve in price as trade improved with China? There is a multitude of reasons for adding stock positions to a portfolio. Unfortunately, the results of most investment decisions do not have a basis for analyzing whether those decisions were correct.

Candlestick analysis contains one very basic element. The results of specific candlestick reversal signals and patterns can be visually analyzed. Did prices move in the proper manner after the appearance of a specific signal? What was the quantitative result of the returns coming out of a specific candlestick pattern? What other market conditions were occurring that might have made the results of a signal/pattern successful or unsuccessful? The huge advantage for using candlestick analysis is exploiting high probability results based upon centuries of actual experience. Using that information correctly dramatically improves an investor’s potential return.

Candlestick signals are merely the graphic depiction of investor sentiment. Investor sentiment has not changed since the beginning of mankind. Investor psychology is directly influenced by emotions. Fear and greed, involved when investors have their equity on the line, will dictate how prices move. Prices will move in an expected manner based upon historical data, the reoccurring thought processes of investors. Candlestick signals are merely the graphic depiction of that data. Learning how to analyze what the result should be after the appearance of candlestick signals/patterns is a very simple but valuable educational process.

“The markets will tell you what the markets are doing.” This is one of the first lessons Japanese Rice traders conveyed. Are you just learning how to use candlestick signals? Then go back through your trades from this past year. Analyze each position that was established. Did it work as expected? What were the confirming indicators doing? What were the market/sector indices revealing at the time? Did you come out of a trade too early? Why? Did you stay in a trade too long? Why? It is one thing to analyze charts to learn when to enter or exit trades. It is a much more valuable process to analyze the trade you actually established. Reviewing your trades from the previous year produces a much greater learning process. The analysis can be done with one major factor included. You can dramatically reinforce your investment abilities by recognizing what you have done correctly or incorrectly in the past AND remember what your emotions were doing at the time you were participating in the trade.

What makes a seasoned investor successful? Investing in proven situations that were successful in the past, without the emotional element. That is what the candlestick investor benefits from when using candlestick signals. Nobody is entitled to profits. Profits are the results of buying and selling at the correct times. That has to be learned. The signals, occurring in the proper conditions, produce high probabilities of producing profits. Learn how to utilize candlestick analysis.

“The markets will tell you what the markets are doing.” This may seem like a very simplistic statement. But what are all investors searching for? The indicators that show where the profits can be made! The first of the year is a time that most investors reflect upon the previous year and analyze where they want to put their investment funds in the coming year. The holidays are a time when extra time and effort is put into the analytical projections for the coming year. The last two weeks of any year becomes a period where analysis becomes highly concentrated going in the next year. What is the result of that extensive analysis? This information is clearly conveyed through candlestick signals.

Remember the first day of trading for 2006? Specific sectors revealed very strong candlestick buy signals. The oil industry, mining stocks, and the biotech industry came out of the chute last year on the first day of trading. Those signals reviewed immediately what sectors the big money was buying going into 2006.

Stock Portfolio, ATI

ATI
 
Whether a technical investor or a fundamental investor, the signals immediately reveal what investor sentiment is doing. Being able to identify where the strong buying is coming into the markets produces a number of benefits. The technical trader can immediately take advantage of a strong price move. The fundamental investor can pinpoint their research analysis to investigate why a specific sector is picking up strength. The candlestick signals are the accumulative knowledge of everybody that was buying or selling during a specific time frame. When a strong candlestick buy signal occurs, this becomes a valuable alert to start researching why a stock/commodity is being bought.

When does the smart money buy? At the bottoms! A strong candlestick buy signal in an oversold condition reveals that somebody has decided that the future has potential. Most investors do not understand what that potential is until the price has moved substantially. The candlestick investor has the advantage of recognizing when to start looking into the fundamental aspects of a company well before the masses. Learn how to use the candlestick signals and patterns correctly. The powerful information conveyed in the signals will dramatically improve your investment analysis.


New Year Specials – 20% off all Quick-Download Videos and E-Books – Buy Now before Offer Ends!
Plus – Discount Package Specials on “Profitable Candlestick Trading” and “High Profit Candlestick Patterns”


Chat session – There will be a chat session on Thursday night at 8 p.m. ET. – Chat Instructions
Speaking sessions – Mr. Bigalow gets many requests to speak in front of clubs and organizations around the nation. If you have a club or a group that would be interested in a two-hour free session on candlestick signals, please feel free to e-mail us. A group of 50 people or more will make the travel expenses viable. In some areas, two or three smaller groups combine for the meeting.

Seminar at Sea – April 2007 — Clear your schedule for a fun and informational investment training seminar on the high seas. Mr. Bigalow, along with other well-known speakers, presents a very informative investment training schedule while cruising in the sun. This becomes an excellent method for combining investment strategies. Each investor has the opportunity to learn valuable investment techniques from highly acclaimed sources at the same time. This produces the opportunity to combine investment techniques. Do not miss this opportunity to gain a wealth of investment knowledge. Not only are these trips informational, but they are also very fun. The speakers are fully accessible for the full week. Full seminar schedule will be posted in our Events & Training category in the future. Interested parties should send an email to receive notification when registration is available. These sessions are in great demand – get on the pre-registration list now to be sure to get your room. Pre-register by emailing us with this line in your email message, “Steve, be sure to keep me informed about the 2007 Seminar at Sea.”

Good investing,

The Candlestick Forum Staff

Beginning Investing in the Stock Market Made Easy with Candlestick Signals

Beginning investing in the stock market is usually an overwhelming process. Investors try to research a multitude of investment methods. Trying to single out an effective investing program can be very difficult. But, there is one  investment method that makes beginning investing in the stock market very easy to understand. Candlestick signals! Candlestick signals incorporate one very simple element. They are formed by the cumulative knowledge of everybody that was buying or selling that trading entity during a specific time period. This makes beginning investing in the stock market much easier to comprehend.

The candlestick signals have been a time-tested investment method, the results of centuries of observations. Japanese Rice traders became legendarily wealthy utilizing the information provided by candlestick reversal signals. Not only did the visual recognition of the signals become important, understanding why those signals were formed became invaluable information. Having the knowledge of why a reversal signal is forming provides the insights for understanding market trends. It allows an investor to eliminate the biggest hurdle for somebody beginning investing in the stock market. Emotions!

Investment patterns in the market are easily recognized. Investors throughout the centuries and throughout the future centuries will have the same emotional based thought processes when it comes to investing. The fear and greed factor. Candlestick signals are clear visual graphic depictions of those emotions. Learning what the signals represent produces a huge advantage for the candlestick investor. Learning the 12 major signals and the secondary signals produces a tremendous benefit for anyone just beginning investing in the stock market. It greatly reduces  learning  the wrong investment techniques to which most new investors are exposed . Learn how to use the candlestick signals effectively and you’ll have control of your investment future for the rest of your life.

Start your education beginning investing in the stock market with candlestick signals and their proper usage by reviewing the 12 Major Candlestick Patterns, all Secondary reversal signals, and the Continuation Patterns. Check back each week as we add new signals and patterns to continue your candlestick education.

Deliberation Candlestick Pattern

DELIBERATION

Description

Another pattern close to the Three White  Soldiers pattern is the Deliberation pattern. It is formed by two long white bodies. These are followed by a small white candle. This last candle may have opened at or near the previous day’s close or it may have gapped up. The Japanese say that this is the time for deliberation. The slow down in the advance is time for the bulls to get out.

Criteria

  1. The first two white candles are relatively equal long candles.
  2. The third day is a small body.
  3. The small body opened at or very near the previous day’s close. Or it may have gapped up slightly.

Pattern Psychology

After an up trend or a bounce up during a long downtrend, the deliberation signal can occur. Like the Advance Block signal, this pattern also represents buyer weakness. In this case, it shows the weakness in one day. This pattern is slightly more difficult to recognize than the Advance Block Pattern.