Archives for August 2019

Candlestick Charts Provide Profitable Swing Trades

Learn CANDLESTICK TRADING with Stephen Bigalow via online webinar training sessions the perfect technical analysis tool for swing trading.


Swing Trading, a relatively popular trading technique. The advent of computers over the past seven to ten years has opened the opportunity for investors to trade stocks and other investments from their home or office. The vast improvement in charting services on the Internet now provides a method for individuals to take advantage of the quick fluctuations in stock prices. Swing trading provides investors a huge opportunity to make profits. As the market sentiments evolve, long term investing becomes less of a dominant form of investing. Swing trading has many advantages over long term investing, especially when implementing with a timing technique such as candlestick trading. Swing Traders will typically hold a particular stock for anywhere from a few days to a few weeks but trade on the basis of the stock’s intra-week or intra-month price changes.

Candlestick analysis has “common sense” built into its signals. Understanding the investor sentiment prepares the candlestick investor to maximize profits in short term swing trading. To get into a trade at the optimal point, anticipating when a trend is about to reverse, is crucial. Understanding how the common investor thinks and reacts permits fast profits to be made by swing trading.

When most trends reverse, they do so with vigor. The initial day or two of a trend reversal can produce magnificent profits. Swing trading is centered upon taking advantage of that initial move. If the trader has the tools to find and exploit these moves, swing trading becomes a profitable and comfortable form of extracting profits from the market. Our contention is that the candlestick signals ARE the tools needed.

Swing trading requires the alignment and concentration of events to maximize profits. Long-term investing does not require the stringent perusal of profit parameters. How often have you heard somebody rationalize about a setback in their position, “Oh well, I’m in it for the long term.” This statement is often uttered instead of taking a progressive stance towards one’s investment goals.

Swing trading represents the exact opposite. An investor trying to maximize profits from a two to ten day holding period has to have analyzed all elements. When swing trading, the establishment of a trade has to be exacting in its purpose, making a profit NOW in that trade.

The innate characteristics built into candlestick signals produce the parameters that make swing trading successful. The recognition of  pattern reversal in a trend can be visually depicted in the signals. For the aggressive swing trader, knowing how the signals are formed can produce trades that pinpoint the exact point in which to enter a trade. Additionally, the same indications that get the candlestick swing trader into a trade will alert the trader when it is time to get out.

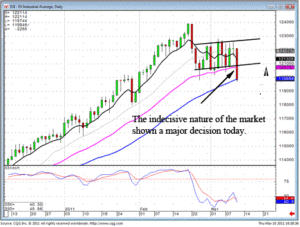
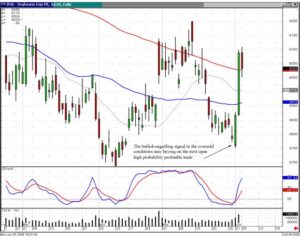
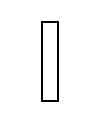
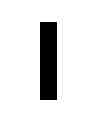
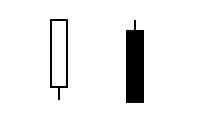
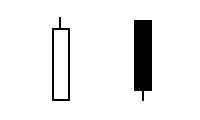
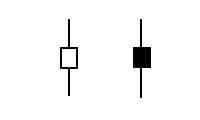
As seen in the following chart, notice the Doji signals at each turn. Knowing what to do after each signal creates the format for profitable swing trading. Knowing the simple rules about what to do once observing a Doji has the candlestick swing trader in and out of trades at the optimal points.
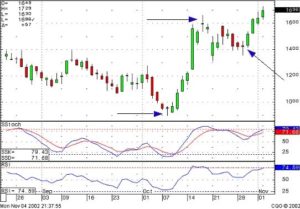
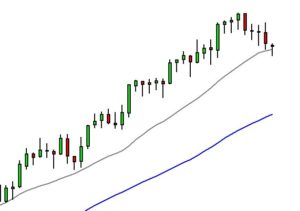
Swing%20Trading%20Chart%201%20copy

Swing Trading, Doji

Learning the methods to evaluate the signals makes swing trading an easy program to extract profits out of the market consistently. Candlestick signals provide two valuable facets. First, the signal searches locate the high potential profitable swing trades. The searches can be constructed to find the signals that occur at the best positions during a trend movement. Finding a candlestick buy signal when stochastics are oversold or searching for a gap up after a Doji are a couple of examples on how to fully utilize the search capabilities. The second facet is the pinpointing when to get into and out of a trade as explained earlier.

Swing trading concentrates on the alignment of parameters to maximize profits. The candlestick signals add the dimension of allowing successful trades to run, as well as showing when a trade has fizzled. The Candlestick Trading Forum specializes in identifying trades suitable for the swing trading investment community. Please review the services provided on the website. Swing trading lies at the core of Mr. Bigalow’s assertion that the candlestick signals can be traded to produce 10% per month return from the stock market. Join the community of traders that search, research and make available swing trading ideas on our Forum and Stock Chat Room.

Trading Tactics

Trading tactics can make the difference between success and failure in trading stocks, commodities and Forex. Whether you are trading directly or trading options or futures, good trading tactics can increase your profit and bad trading tactics can lead to substantial losses. Simple and effective trading tactics include always setting your trading stops when you are trading online. Likewise for short term trading and short term investing using trading limits is wise. Always work to understand the basic fundamentals of each stock or commodity in which you invest or trade. Much of fundamental analysis gets incorporated into stock price and commodity price as soon as it is known so we might think fundamentals are not important. However, knowing the fundamentals of a stock gives us a clear idea of the limits of stock price for it is, in the end, the fundamentals that govern stock prices. Always, always, always follow price patterns with technical analysis tools such as Candlestick pattern formations.

Because Candlestick analysis signals are clear and easy to read they tend to reduce the possibility of misunderstanding. This is, unfortunately, too often the case with how technical analysis results are displayed. The results and predictions with other technical analysis tools may well be the same as those of Candlestick analysis. However, Candlestick analysis distills all of the information into easy to read Candlestick signals allowing traders to proceed to the business of stock trading or commodity trading while others are still puzzling over just what their online trading software is trying to tell them.

General trading tactics include buying on the rumor and selling on the news. A more accurate description of how this works is that the trader sees an emerging pattern in his Candlestick stock charts. He may have been alerted to this stock by reading the stock market news. But, it is by careful examination of stock prices and their patterns that the trader using Candlesticks sets up his trade. He will buy stock, sell stock, sell short, or buy or execute options contracts when the time is right according to Candlestick chart analysis. He will then check the stock market news to confirm that a piece of news has hit the streets causing everyone else to enter the trade, often too late for good profits.

When you are in a losing position, don’t keeping adding money to the trade. This is better put in a very old saying, “Don’t throw good money after bad.” This is a matter of discipline. Trading is not gambling. We use solid tools such as Candlestick patterns in order to guide our investing and trading decisions. Letting the psychology of trading take over in a moment of difficulty is letting the twin demons of greed and fear run the show. They virtually never make you a profit and can often leave you bankrupt! The best of trading tactics is to follow your Candlestick signals, trust them, and act on them.

In regard to acting on Candlestick chart analysis there are times when not to trade. The beauty of Candlestick signals is in their clarity. Trying to force trades is one of the bad trading tactics that deplete your margin account. Sometimes the best of trading tactics is not to trade at all. Satchel Page, the famous 20th century baseball pitcher once said that if he just held on to the ball the batter could not hit it. Likewise, not forcing bad trades keeps the market demons away and saves you money. Use your Candlesticks, trust them, and when they say not to trade, don’t!

Market Direction

Was there a way to take advantage of the big gap-down selling today? Not really! The nature of the market trading for the past few weeks has been very schizophrenic, up big one day and down big two days later. Both the Dow and the NASDAQ opened to the downside very quickly today. Most stocks gapped down, not giving the opportunity to short them. Was candlestick analysis a benefit to investors in predicting a gap down? No, but candlestick analysis should have had the portfolio positioned correctly.

For the past two weeks, the wild fluctuations in the markets have revealed the Bulls and the Bears did not have control of the market direction. When there is no evidence of a viable trend, this has obvious consequences for an investor. The major benefit of candlestick analysis is that it allows an investor to evaluate a direction of a price/trend with reasonably accurate results. The purpose of investing is to put funds to work with the probabilities being in your favor. When the market conditions demonstrate there is no beneficial probabilities, the investor has investment decisions that can be made from that information.

Trading Tactics, Dow

DOW

Trading Tactics, NASDAQ

NASDAQ

As the Dow chart and the NASDAQ chart reveals, a sideways trend channel had been in progress for the past two or three weeks. These conditions did not produce any favorable probabilities for either to be long or short. In most cases, the proper investment strategy would have been to sit on the sidelines until a trend direction could be detected. This is the logical strategy for the majority of traders. However, candlestick analysis provides one more opportunity. It allows an investor to pinpoint the few stocks that are showing good strength and the few stocks that are showing great weakness. This allows for a portfolio mixed with long and short positions that will benefit from the sideways market.

There will always be opportunities to make money in all market conditions. The simplicity of candlestick scans allows for identifying the positions that are moving, even with the market in a relatively flat mode. Take advantage of the information built into the signals and patterns. This information will allow for highly accurate trend of valuation and the ability to make profits when others are sitting on the sidelines. Candlestick analysis provides a trading platform consisting of reoccurring price movements based upon investor sentiment.

Understanding the psychology that is built into the signals is a major factor for understanding why prices move as they do. Recognizing pattern setups allows an investor to take advantage of big price moves prior to their movement. As illustrated in the TCK chart, the slow curve showing failure at the T-line was an indication the bears were starting to take control. These are trading areas that can be executed prior to a major move to the downside. The inherent pressures of price movements makes it feasible to take advantage of prices going in the direction of the market indexes while also being positioned in trades that were anticipating the opposite direction. Those trades, although producing small losses when the market moves big in one direction, would be much more than offset by the positions that were oriented toward the actual market move.

Trading Tactics, TCK

TCK

Trading Tactics, EW

EW
 
Chat session tonight at 8 PM ET.

The new book – Candlestick Profits, Eliminating Emotions with Candlestick Analysis, is in delivery from the printers. They should be in Houston on Tuesday, March 15. If you have not yet ordered your book, please do so this week. Once the books are sent out, you will have lost the opportunity of finding that crisp $100 Bill to be placed in one of the premarket release books. Hurry to order the new book Candlestick Profits – Eliminating Emotions with Candlestick Analysis before the special end!

Good Investing,
The Candlestick Forum Team

Selecting An Options Trading Advisor

Selecting an options trading advisor is an important step in preparing to trade options. Before we break down the different types of accounts, let’s talk with the beginners first. If you have experience investing in the stock market, you probably already know that you can trade options with you current account.

Selecting An Options Trading Advisor

For the beginner, this is a very important step. In fact, selecting an options trading advisor and creating a stock trading plan are the two most important things you can do prior to entering the market. The critical factors in selecting an options trading advisor are:

  • Knowing Yourself – Be honest in evaluating your tendencies; are you a risk taker? Do you like to study and do research? Do you enjoy the idea of investment risk? Do you realize that you have more dollars than sense? You know the answers to questions like these; it is important that you understand your tendencies because there are options trading advisors for every personality type.

  • Knowing The Available Advisors – Sounds difficult but once you have done a self-evaluation, you are well on your way to finding the right options trading advisor for you. Investment firms offer a number of different accounts types based on the needs you have.

What Are The Different Types of Accounts?

Trading accounts vary based of level of service, cost and available resources. The list below will give you an idea of the different types of accounts available:

  • Discount Trade – This type of account is intended for the experienced trader; you will not have the security of an options trading advisor. Because you will be calling your directly to the order desk or the floor, you will receive nearly instantaneous placing of orders. The commissions for discount trades are low but little is available as far as research or recommendations from an options trading advisor.
  • Internet Trade – Is it important to you to talk with an options trading advisor? If not, Internet trade may be the way for you to go. You can place trades, cancel replace orders, view your account status and get real time quotes, all with the click of your mouse. Since you are handling your own account, commissions are low, ranging from $10 to $40 per transaction. Like discount trades, this isn’t recommended as the best alternative for beginners because there is little support beyond implementing positions.
  • Broker Assisted Accounts – If you have some experience in the stock market but still need the guidance of an options trading advisor, this is an excellent option. In addition a beginner who is extremely disciplined and dedicated to learning might be interested in this level of support. Options trading advisors are available to help you with information, advice, placing orders and charting. Prices are in the $50 range per transaction which falls directly between discount trades and full service brokers.
  • Full Service Recommendations – With this type of options trading advisor you will likely be on a first-name basis, since he or she will probably be assigned to your account. Such advisors will be able to help you form an investment philosophy as well as placing trades, offering investment advice and reviewing your individual trades. This is the most expensive option but the best for the beginner or the investor that doesn’t want to spend the time to research and chart potential positions. Commissions for a service such as this range upwards of $100.
  • Day Traders – Do you want to participate in the lightening quick trading of day trading? If you want to regularly trade in and out of positions on the same day? If you are committed to turning your positions everyday, this is a good account for you. Commissions are reasonable and range from $10 to $25.

Conclusion

Along with the trading rules in your stock trading plan, selecting an options trading advisor and trading account will likely be your most important decisions in the stock market. Analyze your personal approach and tendencies and select your options trading advisor based on your needs.

Commodity Swing Trading Made Easy with Candlestick Signals

Commodity swing trading is usually considered high risk investing. That is not necessarily so when utilizing candlestick signals. A major advantage that commodity swing trading has over stock swing trading is the consistency of a trend move. Commodity trends usually work in a more consistent fashion. The reason is very simple. There are less outside influences on a commodity price than there is on a stock price. Most commodities are affected by merely supply and demand. This makes commodity swing trading a little easier to implement than stock trading. Whereas a swing trade in stocks may be a 2 to 10 day trading period, commodity swing trading might experience holds of 5 to 20 trading days.

Stock prices have many more influences with which to contend. The market move in general, interest rates, crude oil prices, the US dollar, and a multitude of other influences that may change the trend of a stock price. Candlestick reversal signals provide excellent points to be buying in stocks. The reversal signals work that much better with commodity prices. Commodity swing trading gains the benefit of seeing where a reversal will occur and then knowing the new trend should provide a steady move from that reversal.

Keep in mind, Japanese candlesticks signals were developed with the most basic of commodities, Rice. Learning how to utilize the 12 major candlestick signals is the first step for putting investment funds into high probability trades. Commodity swing trading has the advantage of steady price moves as well as price patterns. The same patterns that are utilized in stock trading, such as the Jay-hook pattern, the scoop pattern, the cradle pattern, etc. work equally well with commodities. Learn the 12 major signals and you will understand where the high probability buy and sell points will be. Once you have become familiar with the signals, then move on to learning price patterns. Price patterns while incorporating candlestick signals dramatically improve the probabilities of being in high profit trades. Click here for the 12 major signals training CD special.

The profits that can be produced in commodity swing trading are extremely large. The risk of trading high leveraged trading entities becomes minimized when knowing what the candlestick signals are revealing. They produce a confidence to buy at the bottom and sell at the top. They also clearly demonstrate where a stop loss points should be placed. Having this knowledge allows an investor to take advantage of any trading market. Participating in the right direction at the right time is very critical in commodity swing trading. As illustrated in the soybean buy signal, the Bullish Engulfing signal, late last week created the opportunity to be in to a very profitable trade.

Commodity Swing Trading, Soybeans

July Soybeans

Market Direction

Both the Dow and the NASDAQ failed their major moving averages. The Dow was going to come back up and tests the 50-day moving average once more but showed a Doji on Friday followed by strong selling on Monday. The first indication early last week of coming down to test the 200-day moving average is now back in the a valuation. This coincided with a failure of the NASDAQ at the 200 day moving average. Both now have their stochastics turning back down. Keep in mind; this is the evaluation of investor sentiment at important technical levels. As of now, all indications are that prices are going to move down to the next important technical levels.

Commodity Swing Trading, Soybeans

DOW

2011 Stock Market Holidays

2011 Stock Market Holidays Date
Martin Luther King, Jr. Day January 17,2011
Washington’s Birthday/Presidents’ Day February 21,2011
Good Friday April 22,2011
Memorial Day May 30,2011
Independence Day July 4, 2011
Labor Day September 5, 2011
Thanksgiving Day** November 24, 2011
Christmas December 26, 2011
**The NYSE Trading Floor closes early (1PM ET) on
Friday November 25,2011 (The day after thanksgiving)

Remember, the professional money managers often vacation around scheduled exchange holidays.
They may also close positions several days before, causing lighter volume around the stock market holidays.


Unpublished Special – Not Found anywhere else in our website!

For a limited time we are offering an exceptional opportunity to receive a 2-Week Free Trial Membership to The Candlestick Forum.

To participate  – simply send an email to Abraham@candlestickforum.com with the subject line: 2-Week Free Trial Membership. You will receive an email with full instructions to join as our Guest and access Free Downloads valued over $335 in educational tutorials! (no credit card information will be requested, you are our Guest)

Look at Membership Benefits with over $335 worth of immediate free downloads to
Trade with Candlestick Confidence

View Current Website Special

Commodity Trading Signals

Learning commodity trading signals will open the door to profits in trading commodity futures. Commodity and Futures Training using Candlestick chart patterns allows traders to learn what Japanese rice traders knew centuries ago. The market can tell you what the market will do if you learn how to read the commodity trading signals. There are a dozen Candlestick patterns that traders should commit to memory and another 28 that can reliably predict market behavior. Candlestick charting techniques have a long and successful history of predicting commodity market movement. Candlestick trading tactics are like most tactics derived from technical analysisCandlestick basics predict market activity and the trader either buys or sells commodities based on the insight derived.
Successful commodities traders start with a solid foundation of fundamental analysis of the commodity or commodities that they trade. There are reasonable limits to prices on a commodities exchange. Knowing where these limits are will help guide successful commodities trading. Within the extremes technical analysis tools can give solid commodity trading signals. Major Candlestick signals include the Doji, Bullish Engulfing, and Bearish Engulfing signals. Candlestick chart analysis can also be done with time honored commodity trading signals such as the Tri Star Pattern, the Three Black Crows, the Three Identical Crows, and the Two Crows patterns. All of these are secondary patterns typically indicating market reversals. A Commodity and Futures Training class will help the beginner learn both the fundamental and technical aspects of the commodities markets.

Commodity trading signals can be useful to both the companies buying commodities or the producers in hedging investment risk. Trading signals may be more useful to traders who routinely buy and sell commodities or who trade options on commodity futures. Although those hedging risk in the commodities markets may buy and sell once or twice a year the trader can and will watch the market throughout the year and throughout the day looking for commodity trading signals that will lead to profit. The addition of traders speculating on commodity prices adds volume and liquidity to the market leading to more traders trading and increasing volume. It is with high trading volume and liquidity that commodity trading signals work the best and are most profitable when followed.

Technical trading works best when applied through a trading strategy. The trader will learn with time which trading signals can be used to make the most profit. With experience the trader can learn more and more efficient execution of the trading strategy. The trader will learn which commodities he or she trades most effectively and which trading signals derived from Candlestick charts are most predictive of market changes for the commodity in question. With competent instruction the trader can learn effective use trading signals coupled with the use of techniques such as Candlestick trading tactics to make consistent profits. At the same time proper reading of market signals will help reduce risk while enhancing return on investment. For those interested in trading options on commodity futures a good choice is to take options training with Stephen Bigalow.


Market Direction

Investor sentiment is the force that moves prices/markets. Candlestick signals reveal the nature of investor sentiment. The signals work extremely well on their own. However, an investor can glean an immense amount of information utilizing candlestick signals and the other obvious information a chart is revealing. Today, the markets experienced a severe selloff on the open. This made for further confirmation of the possible reversal in the trend if you include the Evening Star signal that formed in the Dow last week. How does one know whether it is time to close out long positions when the market opens lower like it did today? They don’t! But they have to take a look at what was affecting the trend to this point. The tee line has acted as support for this uptrend for the past two months. That fact has to be put into the evaluation.

The longer a trend remains in existence, the more severe the reversal signal needs to be. Recently the markets have been reacting to positive or negative earnings reports on a daily basis. The overall trend has remained consistently above the tee line. The severe selling on today’s open was scary. However, up to this point, the trend had been fairly solid. It is prudent to not react until the daily signal confirms there has been a change of investor sentiment. As was witnessed today, the buying came back into the markets after about one hour of languishing near the lows. The intraday charts should have been utilized to see what the trend was doing. If the five-minute chart demonstrated a lengthy flat trading range, there is extreme hurry to close out the positions. They are probably already trading off after the selloff. If the markets appeared as if they were going to close at the low end of the trading range by the end of the day, then you could be selling those positions, probably at approximately the same level as were they were trading one hour after the open.

Commodity Trading, Dow Example

DOW

If the Bulls step back in, as they have done for the last two months, and close the markets above the tee line, a very simple assumption can be made. The uptrend is in progress as long as they cannot close it below the tee line.
Waiting to see what investor sentiment is doing after any price opens becomes a very prudent entry and exit strategy. As seen in the TLEO chart, it opened positive. It also started selling off immediately from that level. What should be witnessed after a candlestick buy signal? Continued buying! In the case of TLEO, there is nothing wrong with waiting one or two minutes to see if the buyers are still participating after the price opens positive following day candlestick buy signal.

TLEO, commodity trading

TLEO

@How the markets closed today would be very important for indicating what was occurring an investor sentiment. Obviously a close at the lower end of today’s trading range would reveal the tee line had not acted as support. You do not have to buy at the absolute bottom or sell at the absolute top. Your entry and exit strategies should include practices that improve the probabilities for profiting from that trade.

No Chat Session Tonight due to Traveling

Good Investing,
The Candlestick Forum Team


The History of Japanese Candlesticks

Throughout Candlestick Analysis you are going to find many war-like references. Between 1500 and 1600 the territories of today’s Japan were at constant war. Each daimyo (feudal lord) was in constant contention to take over their neighbor. This one hundred year period is known as Sengoku Jidai or the “Age of Country at War”. This was a definite period of turmoil. It slowly came to order in the early 1600’s through three dynamic generals – Nobunaga Oda, Hideyoshi Toyotomi, and Leyasu Tokugawa. Their combined leadership prowess has become legendary folklore in Japan’s history. Their achievements are described as: “Nobunaga piled the rice, Hideyoshi kneaded the dough, and Tokugawa ate the cake.” All the contributions from these great generals unified Japan into one nation. Tokugawa’s family ruled the country from 1615 to 1867. This become known as the Tokugawa Shogunate Era.
While the Candlestick methodology was being developed, a military environment persisted in Japan.

Understandably, the Candlestick technique employs extensive military terminology for its explanations. Investing is correlated to battle. It requires the same tactical abilities to win. The investor has to prepare for winning trades as a general prepares for battle. A strategy is required, the psychology of coming events have to be thought through. Competition comes into play. Aggressive maneuvers and strategic withdrawals are required to eventually win the war – to achieve financial success.

As stability settled over the Japanese culture during the early 17th centuy, new opportunities became apparent also. The centralized government lead by Tokugawa diminished the feudal system. Local markets began to expand to a national scale. The demise of local markets created the growth of technical analysis in Japan.
Osaka became regarded as Japan’s capital during the Toyotomi reign. Its location near the sea made it a commercial center. Land travel was slow and dangerous, not to mention costly. It became a natural location for the development of the national depot system, assembling and disbursing supplies and market products. It rapidly evolved into Japan’s largest city of finance and commerce. Osaka, the “Kitchen of Japan” with its vast system of warehouses, eventually established an atmosphere of price stability by reducing regional imbalances of supply. Osaka became the profit center of all Japan, completely altering the normal social standards. In all other cities the quest for profits was despised. Japan was composed of four classes, the Soldier, the Farmer, the Artisan, and the Merchant. It was not until the 1700’s that the merchants broke down the social barrier. “Mokarimakka” which means ” are you making a profit?” is still the common greeting in Osaka today.

Under Hideyoshi’s reign, a man named Yodoya Keian become a successful war merchant. He had exceptional abilities to transport, distribute and set the price of rice. His reputation become so well known, his front yard become the first rice exchange. Unfortunately, he became very wealthy. Unfortunate because the Bakufu (the military government lead by the Shogun) relieved him of all his fortune. This was done based upon the charge that he was living a life of luxury beyond his social rank. This was during a period in the mid 1600’s when the Bakufu was becoming very leary of the merchant class. A number of merchants tried to corner the rice market. They were punished by having their children executed. They were exiled and their wealth was confiscated.

The Dojima Rice Exchange, the institutionalized market that developed in Yodoya’s front yard, was established in the late 1600’s. Merchants were now capable of grading the rice, and negotiated setting the market price. After 1710, actual rice trading expanding into issuance and negotiating for rice warehouse receipts. These become known as rice coupons, and were the first forms of futures. The Osaka rice brokerage became the foundation for the city’s wealth. 1,300 rice dealers occupied the Exchange. Due to the debasing of coinage, rice became the medium of exchange. A daimyo in need of money could send his surplus rice to Osaka and get a receipt from a warehouse. This receipt (coupon) could then be sold. As with many daimyo, cashflow problems could be eliminated through this method. Sometimes many future years of crops were mortgaged to take care of current expenses.

With the rice coupon becoming an actively traded entity, the Dojima Rice exchange became the world’s first futures exchange. Rice coupons were also called “empty rice” coupons, rice that was not in physical possession. Rice futures trading became so established in the Japanese marketplace, that in 1749, 110,000 bales (rice traded in bales) were freely traded while there were only 30,000 bales in existence throughout Japan.

It was during this time period that Candlestick trading became more refined. Candlestick analysis had been developed over the years simply due to the tracking of rice price movements. However, in the mid 1700’s they were really fully utilized. “The god of the markets” Homna came into the picture. Munehisa Homna, the youngest son of the Homna family, inherited the family’s business due to his extraordinary trading savvy. This at a time when the Japanese culture, as well as many other cultures, thought it common that the eldest son should inherit the family business. The trading firm was moved from their city, Sakata, to Edo (Tokyo). Homna’s research into historic price moves and weather conditions established more concrete interpretations into what became known as Candlesticks. His research and findings, known as “Sakata Rules” became the framework for Japanese investment philosophy.
After dominating the Osaka rice markets, Homna eventually went on to amass greater fortunes in the Tokyo exchanges. It was said that he had over one hundred winning trades in a row. His abilities became legendary and were the basis of Candlestick analysis.

Japanese Candlestick analysis was never a hidden or secretive trading system. In was successfully used in Japan for hundreds of years. It has been only recently, about 25 years ago, that it first made its way into the U.S. trading community. Until then, there just wasn’t any interest from Western cultures to investigate the Candlestick Technique. Even then, it was not noticed all that much. The perception has been that it was difficult to learn and very time consuming. That may have been true until recently. The first books introducing it into the U.S. trading arena would describe how to make wooden boxes that were backlit. Then the chart graphs could be better viewed. Fortunately, the advent of computers and computer programming has taken Candlestick analysis ahead by leaps and bounds.
Until recently, the investment community knew about Candlesticks, they just didn’t know how to use them effectively. Interest has been increasing dramatically now that the roaring markets have collapsed. Investors, new and old, are now trying to investigate methods that protect them from the severe losses that occurred from March 2000 until now.
Hundreds of years of analysis and interpretation can be much more easily extracted through computer programming. Huge fortunes were amassed with simple charting techniques. The same will be true with all the benefits that computer software provides the investor today.

The interest in candlestick signal analysis in the United States has to be credited to Steve Nison. Over three years of extensive research produced Steve Nison’s initial publication “Japanese Candlestick Charting Techniques”, published in 1991. Much of the background and historical information about candlesticks, found in this site and many other sites, was probably the results of Steve Nison’s excellent research.

Candlestick Pattern Formations

Japanese Candlestick charting dramatically increases the information conveyed to the visual analysis. Each candlestick trading formation or series of formations can clearly illustrate the change of investor sentiment. This process is not apparent in standard bar chart interpretation. Each candle formation has a unique name. Some have Japanese names, others have English names.

Single candles are often referred to as YIN and YANG lines. These terms are actually Chinese, but are used by Western analysts to account for opposites; in/out, up/down, and over/under. INN and YOH are the Japanese equivalents. YIN is bearish. YANG is bullish. There are nine basic YIN and YANG lines in Candlestick analysis. These are expanded to fifteen to cover all possibilities clearly. The combination of most patterns can be reduced to one of these candlestick patterns.

Long Days Candlestick Pattern

Long days

A long day represents a large price move from open to close when candlestick charting. Long represents the length of the candle body. What qualifies a candle body to be considered long? That is a question that has to be answered relative to the chart being analyzed. The recent price action of a stock will determine whether a “long” candle has been formed. Analysis of the previous two or three weeks of trading should be a current representative sample of the price action.

Short Days Candlestick Pattern

Short Days

Short days can be interpreted by the same analytical process of the long candles on candlestick charts. There are a large percentage of the trading days that do not fall into either of these two categories.

Maruboza

In Japanese chart analysis, Marubozu means close cropped or close-cut. Bald or Shaven Head are more commonly used in candlestick analysis. It’s meaning reflects the fact that there are no shadows extending from either end of the body.

White Marubozu Candlestick Pattern

White Maruboza

The White Marubozu is a long white body with no shadows on either end. This is an extremely strong pattern used in stock analysis. Consider how it is formed. It opens on the low and immediately heads up. It continues upward until it closes, on its high. Counter to the Black Marubozu, it is often the first part of a bullish continuation pattern or bearish reversal pattern. It is called a Major Yang or Marubozu of Yang.

White Marubozu Candlestick Pattern
Black Marubozu


A long black body with no shadows at either end used in Japanese Candlesticks is known as a Black Marubozu. It is considered a weak indicator. It is often identified in a bearish continuation or bullish reversal pattern, especially if it occurs during a downtrend. A long black candle could represent the final sell off, making it an “alert” to a bullish reversal setting up. The Japanese often call it the Major Yin or Marubozu of Yin.

Closing Marubozu Candlestick Pattern

Closing Marubozu

A Closing Marubozu has no shadow at it’s closing end. A white body will not have a shadow at the top. A black body will not have a shadow at the bottom. In both cases, these are strong signals corresponding to the direction that they each represent.

Opening Marubozu Candlestick Pattern
 
Opening Marubozu

The Opening Marubozu has no shadows extending from the open price end of the body. A white body would not have a shadow at the bottom end , the black candle would not have a shadow at it’s top end. Though these are strong signals, they are not as strong as the Closing Marubozu.

Spinning Top Candlestick Pattern

Spinning Top

Spinning Tops are depicted with small bodies relative to the shadows. This demonstrates some indecision on the part of the bulls and the bears. They are considered neutral when trading in a sideways market. However, in a trending or oscillating market, a relatively good rule of thumb is that the next days trading will probably move in the direction of the opening price. The size of the shadow is not as important as  the size of the body for forming a Spinning Top.

Doji

Doji

The Doji is one of the most important signals in candlestick analysis. It is formed when the open and the close are the same or very near the same. The lengths of the shadows can vary. The longer the shadows are, the more significance the Doji becomes. More will be explained about the Doji in the next few pages. ALWAYS pay attention to the Doji.

The dimension of knowing what the formations signify magnifies the potential for profits. The bodies, unlike the bars of bar charts, reveal an immense amount of information.

On to Candlestick Research              Go To Products on Trading Candlestick Patterns

Buying Calls – Bullish Options Trading Strategy

Buying a Call is a decidedly Bullish position on an underlying stock value. The investor has the opportunity to participate in the rise of the stock’s value for the term of the contract with a predetermined risk. Most investors will look to sell their contract at a profit, while others may intend to exercise their right and purchase the underlying shares.

To exit a call you have three options. You may let the call expire worthless (lose the premium paid for the option). You may exercise the call at the agreed upon strike price, and turn around and sell the stock at the current market price and profit from the difference. You may sell your call when it rises in premium in tandem in the rise in the under lying stock value.

The main benefit of buying a call is the limited risk of capital. The investor has a much smaller cash layout, with a limited downside loss, and unlimited upside gain. On the flip-side, the option investor does not have the same rights of the individual shareholder such as dividends and voting rights.

In theory, the potential profit on a long call is unlimited as long as the underlying value continues to rise. The potential loss is limited to the premium paid for the contract.

Buying Calls is a long call strategy that is best used in a bullish market where a rise in the price of the underlying stock is anticipated.  By electing to purchase a long call option instead of the under lying stock, you increase your leverage and reduce the inherent risk of the trade. The most you can lose on your purchase is the cost of the premium. Buying Calls can be a great way to increase your participation in certain stocks without tying up a log of funds. Options allow you to control a larger number of shares for less capital.

The Chicago Board Options Exchange (CBOE) provides this concise definition for Buying Calls. Buying an equity call gives the owner the right, but not the obligation, to buy 100 shares of underlying stock at a specified price (the strike price) at any time before a specific time (the expiration date). This is a bullish strategy because the value of the call tends to increase as the price of the underlying stock rises, and this gain will increasingly reflect a rise in the value of the underlying stock when the market price moves above the option’s strike price.

The profit potential for the long call is unlimited as the underlying stock continues to rise. The financial risk is limited to the total premium paid for the option, no matter how low the underlying stock declines in price. The break-even point is an underlying stock price equal to the call’s strike price plus the premium paid for the contract. As with any long option, an increase in volatility has a positive financial effect on the long call strategy while decreasing volatility has a negative effect. Time decay has a negative effect.


Return to main Options Trading Category

Hot Penny Stocks

Hot penny stocks are those stocks that trade from .001 of a penny to $5.00. They are extremely risky yet they have remarkable reward potential. Penny stocks are referred to as over the counter stocks because they are listed on the Over the Counter Bulletin Board.

To qualify as a penny stock, the stock must meet four criteria.

  1. The stock must be priced below five dollars.
  2. The stock is not traded on a national stock exchange or on the NASDAQ.
  3. The stock may be listed on the “pink sheets” the NASD or the OTC Bulletin Board as explained above.
  4. Lastly, the company that issues the stock must have less that $5 million in tangible assets and must only have been in business less than three years.

Many investors buy penny stocks considered “hot penny stocks” because it does not take a large investment to get started. They give the average investor the opportunity to obtain a significant number of shares without having to invest a large chunk of their hard earned money. In other words it provides the successful trader the ability to turn a relatively small investment into a large fortune. This is precisely why hot penny stocks are so popular. The downside of course is that the volatility of shares and the lack of corporate transparency that can quickly make a penny stocks worthless.

It is important to note that the true value of a company and the price of their hot penny stocks are not always necessarily indicative of each other. In fact, most penny stocks are at the developmental stages and have been overlooked by the investment community for reasons unknown. While this has given penny stock investing a bad reputation, there are those penny stocks that truly represent a legitimate investment opportunity. Those are the best penny stocks that you need to find! There are actually studies that show that many companies have standards that they must meet before they are allowed to be traded OTC. The ones that you must watch out for are the companies that are unethically managed. These are the so called hot penny stocks that that are promoted and then quickly sold off to make a profit. By the time naive investors have bought them, the hype has worn off and they cannot sell them. Watch out for these schemes!


There are also those situations when companies are well established and are still considered to have hot penny stocks. These are companies that are truly trying to grow so that they go above the penny stock status and can potentially be traded on the NYSE or another major exchange. These businesses truly opt to increase their customer’s value in the stock market.

Hot penny stocks contain an element of risk just like any other type of investment. The point is that you must build your list of penny stocks very carefully. Do as much research as you can, and think twice before investing in a hyped up penny stock. There are penny stocks worth investing in, but it is up to you, the investor to find them.