Archives for October 2019

Trading Basics

When things don’t go well in any sort of endeavor, time honored advice is typically to get back to the basics. Better advice in stock tradingoptions trading, or commodity trading is to stick to trading basics from the start and not need to “get back to” trading basics. So, what are trading basics? The basics of trading are to work from a plan and to work the plan. The plan in trading basics is a well thought out and frequently tested trading strategy. Successful trading requires a knowledge of the fundamentals for trading stocks, trading optionstrading commodities such as gold futures and oil futures , or trading futures in such exotic entities as futures on interest rates. It also requires technical analysis tools such as Candlestick chart analysis in order to take advantage of a breakout gap, full scale stock price reversal, or to sell stock at the top of a trading cycle.

A good trading strategy includes taking the time to learn how to do and routinely carry out fundamental analysis. It includes learning how to do technical analysis with Candlestick analysis in order to anticipate and profitably trade changes in stock pricescommodity prices, or futures prices. Starting with the trading basics puts traders in the position to make money in trading. Carrying on with trading basics brings the trader closer to profitable trading. Besides learning the basics of fundamental and technical analysis the trader needs to learn and use the trading basics of using a trade station, making trades in a timely manner, and simply being there when the trading action starts.

The most important factor to success in trading is showing up. That sounds silly but it is the foundation of trading basics. The new trader will need to dedicate an amount of time to learning about market and what is traded. He will need to deep in touch with market news for stocks, bonds, options, and the rest. For the beginning trader who envisions successful trading as executing trades via clicks of a mouse trading basics will require that he learn how to devote a portion of his time to the homework necessary for successful trading. No matter what equity a trader is trading he will find that the market moves when the market decides to move. Traders profit from following the market, doing technical analysis, and executing timely trades. This means that when the trader is not “doing his homework” he needs to be at the trade station following the equity which he is trading.

The last of the trading basics mentioned here the periodic review of trading results. This is not the least important of the basics; it is the most essential to long term success. No one is capable of setting up a trading strategy for all seasons. Markets change, rules change, currencies change, and trading software changes. A trade needs to review his results and then review his trading process. It is by doing so that the trader gets better at predicting stock price, learns how to spot a stock market correction, and learns to avoid overpriced stock. It is by following the basics that the trader comes to long term success.


Market Direction

Let the market tell you what the market is doing! This is sage advice that comes from the Japanese Rice traders. Their  centuries of falling candlestick signals developed a very simple trend analysis program. It provided the visual graphics of what investor sentiment was doing. This has a completely different investment philosophy than what has been created over the past 100 years of Wall Street analysis. The purpose of fundamental analysis is to reveal which stocks/sectors will have the greatest potential for the future. Investing in future price movements based upon fundamental research is a high risk/low probability investment program. Yet it seems to be the most accepted in this day and age. The Japanese Rice traders had a completely different perspective on how to make money from the markets. Let the market tell you what the market is doing! Then invest in those entities that are confirming what the market is conveying.

Trading Basics, Dow

DOW

The Dow chart reveals a very slow steady uptrend for the month of December. The market indexes can provide a certain amount of statistical direction based upon the first few trading days of a new year. The Dow had been up over 125 points during the day. This was the first time the Dow has moved in a range more than 100 points in the last four weeks of trading. This low volatility phenomenon last occurred in 1996. A strong bullish characteristics of todays trading indicated the Bulls still in control. The magnitude of todays trading reveals what the thought process was for many money managers as they were assessing whether 2011 was going to be a strong or weak year.

A strong bullish move in the overbought conditions usually indicate exuberance coming into the trend. However, closer analysis to today’s trading revealed many stocks moving in the same range as they have been for the past four weeks, there just was more stocks moving positive. This would indicate a continuation of the buying. The exuberance was not showing up. This would indicate more upside trading on the short term. The strength of the market revealed in the first week of a new year is usually a prelude to the strength of the market over the year. This is one of the rules of thumb. Do rules of some always work? Not necessarily, but the anticipation of certain expect nations can be better verified by witnessing what the candlestick signals are doing during specific time frames.
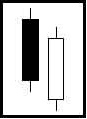
The combination of these indicators are very important for portfolio management as well as option training. Just as the first week provides an indication of the potential strength of the market trends for the year, the strength of a candlestick signal will illustrate the strength of a price move. Obviously, the stronger the signal, the more compelling for establishing a position of a portfolio. The strength of a signal will also determine what type of option strategy should be applied to the trade.

Mini option training – Tuesday night January 4, 2011.

Tomorrow night will be a two-hour introduction to option training presented by the Candlestick Forum. This training is to introduce investors to the basics of options. Why they are used, how they are used most effectively, and how to apply the correct training strategy to the correct trend analysis. Most investors oversimplify the option training strategies. If a stock price is going higher, by the calls! That is where most investors lose their money. Learn how to correctly use calls and puts. Learn how to correctly use call strategies and put strategies. Time and magnitude are very important factors for trading options correctly. Join us to learn the basics of options and how they can be applied successfully using candlestick analysis.

Chat session tonight at 8 PM ET – the strong sectors for the beginning of 2011

Good Investing,
The Candlestick Forum Team


Holiday BulbsHoliday Bulbs

HOLIDAY SPECIALS FOR THE INVESTOR WHO HAS EVERYTHING

HOLIDAY GIFT PACKAGES – Free Shipping today! 
Profitable Candlestick Trading
Candlestick Signal Flash Cards
Major Signals Mouse Pad
Special Gift Membership Subscriptions 
 

Current Website Special
Fast Track On Trading – ON SALE!!!

Website special reflects current newsletter. If you are reading an archived newsletter you will be directed to Current Website Special

Futures Options – Opening New Markets

Futures options are similar to futures themselves in that both give the holder the right to buy or sell the underlying commodity for a specific price on a specific day. Beyond this there are some significant difference between the two and how they are traded.

Rights and Requirements

The main difference between futures options and futures has to do with rights and requirements. Futures options give the holder the right to buy or sell (depending on the option) the underlying commodity for a specific price on a specific date while futures obligate the purchase or sale. While there are investment strategies for futures that eliminate the need for an investor to accept delivery of 10 tons of pork bellies, the basic concept is the same; futures require the buyer to take delivery (in one form or another) of the commodity in question.

Futures Options Contracts

Futures options markets trade options contracts, which specify the underlying asset, the expiration date, and the strike price. Those involved in day trading can trade options contracts to make a profit on the difference between the buying price and the selling price when the options are sold before expiration, or to make a profit from the underlying asset when they are exercised.

As with futures contracts, futures options contracts are traded by day traders and longer term traders in futures markets, and also by non traders with an interest in the underlying commodity. When traded for the underlying commodity, options contracts work the same way as futures contracts, but only give the right to buy or sell the underlying commodity rather than the obligation. For example, a farmer will sell options on his cattle if he thinks prices are going to drop before he takes them to market; conversely, a meat processing company will buy futures on cattle if they believe that prices will rise. Both are non-traders but they have interests in the commodity. The final part of the equation is the investor who attempts to make a profit by successfully trading these commodities.

Futures or Cash Settlement

Futures options are settled in either cash or a futures contract in the underlying security when they are exercised. In-the-money, cash-settled futures options are valued using the trading price of the underlying security at expiration, and the profit is placed into the trader’s account. In-the-money, futures settled options are converted into the appropriate futures contract, which the trader can then buy or sell to realize the profit or hold the purchase and simply continue commodity trading.

Because futures options contracts only give the holder the right to purchase, successful traders don’t have to purchase losing positions. If an investor is holding a position that has not prospered according to the contract, he or she can just walk away from the agreement and let it expire. This is the benefit of futures options over standard futures contracts; the ability to walk away from a losing position leaves the investor with a reduced exposure. Conversely, an investor that is holding a contract when the buyer does not exercise his or her position has profited by receiving the premium for selling that position. Such a strategy is helpful during negative periods in the market because it allows for profit taking in a less risky manner.

Conclusion

Futures options, although they are quite similar to standard futures contracts, still possess features that make them very desirable for successful trading. This type of trading can open new markets for investors looking to make money.

Stock Market Tips Make Investing a Hit or Miss Proposition. The Candlestick Signals Produce High Probability Situations.

Stock market tips are usually the demise of most investors. The dream of most investors is to find the stock market tips that are going to make them wealthy.  Unfortunately, that does not happen.  Depending upon stock market tips will lead most investors into a demoralizing method of investing.  Consider the factors that surround stock market tips.  The information is usually relatively old by the time it reaches the ordinary investor.  If the stock market tips are coming from an acclaimed guru of a stock market, it has probably been well positioned into accounts before the general public is made aware of the recommendation.

What you do when executing stock market tips?  That should be the first question.  Most stock market tips emphasize getting into the position as quickly as possible.  Whatever great things are going to happen in the stock price are going to happen soon.  Stock market tips  are not representative of an intelligent investment strategy.  Investing involves implementing a program where an investor can continue to improve return results.  Candlestick signals provide the format for establishing consistent investment returns.

The major problem that comes from putting funds into everybody’s stock market tips is very simple to understand.  If that particular investment situation does not perform as expected, the investor is right back where they started.  They do not have a viable investment strategy.  Candlestick signals, on the other hand, are based upon high probability situations.  Establishing a position based upon one of the major candlestick signals allows an investor to evaluate when to get into a position and when to get out of a position.

The signals are the result of many centuries of observations. If the statistical results of the major candlestick signals were not proven, we would not be looking at them today.  The psychology built into a major signal is simple common sense investment philosophy.  As demonstrated in the piercing signal, the Japanese Rice traders have a high expectation of what the result should be.  Having this knowledge makes investment programs very easy to implement.

Piercing Pattern

PIERCING PATTERN

Description

The Piercing Pattern is composed of a two-candle formation in a down-trending market. The first candle is black, a continuation of the existing trend. The second candle is formed by opening below the low of the previous day. It closes more than midway up the black candle, near or at the high for the day.

Criteria

  1. The body of the first candle is black; the body of the second candle is white.
  2. The downtrend has been evident for a good period. A long black candle occurs at the end of the trend.
  3. The second day opens lower than the trading of the prior day.
  4. The white candle closes more than halfway up the black candle.

Signal Enhancements

  1. The longer the black candle and the white candle, the more forceful the reversal.
  2. The greater the gap down from the previous days close, the more pronounced the reversal.
  3. The higher the white candle closes into the black candle, the stronger the reversal.
  4. Large volume during these two trading days is a significant confirmation.

Pattern Psychology

After a strong downtrend has been in effect, the atmosphere is bearish. Fear becomes more predominant. The prices gap down. The bears may even push the prices down further. However, before the end of the day, the bulls step in and dramatically turn prices around. They finish near the high of the day. The move has almost negated the price decline of the previous day. This now has the bears concerned. More buying the next day will confirm the move.

Being able to utilize information that has been used successfully in the past is a much more viable investment strategy than taking shots in the dark.  Keep in mind, when you are given privileged information about stock market tips, where you are in the food chain. Are you one of those privileged few that gets top-notch pertinent information on a timely manner, or you one of the masses that feed into a frenzy and allow the smart money to make the profits?

Training Tutorial

The Piercing Pattern

Remarkable results have been observed with this signal. This 35 minute video provides a clear understanding of what this signal indicates and how to trade it for profit.

Candlestick Forum Flash Cards   These unique Flash Cards will allow you to be “trading like the Pro’s” in no time.

Return to Candlestick Explanation of the Major Signals

RSS Free Stock Market Technical Analysis and Japanese Candlestick News Feeds

Review topics for our recent free News Feeds. If you would like to receive these articles
immediately upon release, select  XML  for quick shortcut instructions to all our news and articles.

Candlestick Stock Analysis – Candlestick Stock Analysis
Anticipating the Stock Market – Anticipating the Stock Market
Bargain Stocks – Bargain Stocks


Trading Chinese Stocks – Trading Chinese Stocks
Low Stock Market Volume – Low Stock Market Volume
Oil Stocks – Oil Stocks
Trading Stocks in a Bear Market – Trading Stocks in a Bear Market
Earnings Reports – Earnings Reports
Stocks Trading at a Discount – Stocks Trading at a Discount
Selling Gold – Selling Gold
Buying US Treasuries – Buying US Treasuries
Retirement Stocks – Retirement Stocks
Consumer Stocks – Consumer Stocks
Buy Cheap Stocks – Buy Cheap Stocks
Find The Market Bottom with Candlesticks – Find The Market Bottom with Candlesticks
Trading During A Recession – Trading During A Recession
Basic Stock Trading – Basic Stock Trading
Foreign Investment – Foreign Investment
Stock Trading in a Volatile Market – Stock Trading in a Volatile Market
Picking Depressed Stocks – Picking Depressed Stocks
Trading Gold – Trading Gold

5 Star Trading Plan


Investing with Candlesticks – Investing with Candlesticks
Successful Trading System – Successful Trading System
Trading Hot Stocks – Trading Hot Stocks
Candlestick Stock Trading – Candlestick Stock Trading
Conservative Stock Investing – Conservative Stock Investing
Profit from Stock Market Gains – Profit from Stock Market Gains
Follow Investment Capital – Follow Investment Capital
Stock Diversification – Stock Diversification
Best Stock Advice – Best Stock Advice
Making Money with Stocks – Making Money with Stocks
How to Sell Stock – How to Sell Stock
Start Stock Investing – Start Stock Investing
When to Sell Stock – When to Sell Stock
When to Buy Stocks – When to Buy Stocks
Stock Price Analysis – Stock Price Analysis
Candlestick Day Trading – Candlestick Day Trading
Strategic Stock Trading – Strategic Stock Trading
Picking Offshore Investments – Picking Offshore Investments
American Depository Receipts – American Depository Receipts
Stock Investment Profits – Stock Investment Profits
Investing in the Stock Market for Dummies – Investing in the Stock Market for Dummies
Risk Premium – Risk Premium
The Strike Price – The Strike Price
Stocks for Dummies – Stocks for Dummies
A Trailing Stop – A Trailing Stop
Stock Market Holidays -Stock Market Holidays
Use the Quick Ratio – Use the Quick Ratio
Finding Profitable Investments – Finding Profitable Investments
Balancing a Stock Portfolio – Balancing a Stock Portfolio
Low Risk Investments – Low Risk Investments
Stock Profits – Stock Profits
Stock Market Indecision – Stock Market Indecision
Picking Hot Stocks – Picking Hot Stocks
Identify Overpriced Stocks – Identify Overpriced Stocks
Best Trading Opportunity – Best Trading Opportunity
Trading Leverage – Trading Leverage
European Style Option – European Style Option
Investing in Japanese Recovery – Investing in Japanese Recovery
Investing For Long Term Profits – Investing For Long Term Profits
Trading Oil Stocks – Trading Oil Stocks
Trading Tactics – Trading Tactics
Sell Stock on the News – Sell Stock on the News
Market Correction – Market Correction
Best Trading Practices – Best Trading Practices
Trading Stock Volatility – Trading Stock Volatility
Trading with Japanese Candlesticks – Trading with Japanese Candlesticks
Identify Stock Buying Opportunities – Identify Stock Buying Opportunities
Get Ahead of the Market – Get Ahead of the Market
Analyzing Stocks – Analyzing Stocks
Buy Calls – Buy Calls
Buy Puts – Buy Puts
Consolidation Pattern – Consolidation Pattern
Trading Breakouts – Trading Breakouts
Stock Value Analysis – Stock Value Analysis
Stock Market History – Stock Market History
Business Cycle Investing – Business Cycle Investing
Useful Stock Investment Information – Useful Stock Investment Infomation
Trading Basics – Trading Basics
Stock Futures – Stock Futures
Stock Trading Signals – Stock Trading Signals
Interest Rate Investing – Interest Rate Investing
Consolidate Stock Gains – Consolidate Stock Gains
Long Term Stock Profits – Long Term Stock Profits
Stock Fundamentals – Stock Fundamentals
Increase Investment Profits – Increase Investment Profits
Buying Futures – Buying Futures
Fundamental versus Technical Analysis – Fundamental versus Technical Analysis
Use Puts to Protect Profits – Use Puts to Protect Profits
Successful Long Term Investment – Successful Long Term Investment
Stock Price Pattern Analysis – Stock Price Pattern Analysis
Predicting Stock Price – Predicting Stock Price
Successful Ratio Investing – Successful Ratio Investing
Technical Stock Investing – Technical Stock Investing
Investing in Earnings Potential – Investing in Earnings Potential
Stock Index Trading – Stock Index Trading
Earning Stock Trading Profits with Candlestick Signals – Earning Stock Trading Profits with Candlestick Signals
Be Your Own Stock Analyst – Be Your Own Stock Analyst
Stock Investment Success – Stock Investment Success
Gain Stock Investment Perspectives – Gain Stock Investment Perspectives
Online Stock Options Seminar – Online Stock Options Seminar
Interactive Stock Training Class – Interactive Stock Training Class
Learn Candlestick Analysis – Learn Candlestick Analysis
Be a Profitable Trader – Be a Profitable Trader
Basic Stock Market Training – Basic Stock Market Training
Online Training Webinars – Online Training Webinars
Selling Commodities – Selling Commodities
Buying Commodities – Buying Commodities
Fundamental of Trading Commodities – Fundamental of Trading Commodities
Commodity Pattern Analysis – Commodity Pattern Analysis
Purchase Commodities – Purchase Commodities
Futures Price – Futures Price
Analysis of Commodities – Analysis of Commodities
Commodity News Reports – Commodity News Reports
Basics of Commodity Trading – Basics of Commodity Trading
Commodities Research – Commodities Research
Commodity Supply And Demand – Commodity Supply And Demand
NYMEX Commodity Futures Price – NYMEX Commodity Futures Price
Successful Commodities Trading – Successful Commodities Trading
Learning about Commodity Futures – Learning about Commodity Futures
Commodity Price Breakout – Commodity Price Breakout
Trade Commodities – Trade Commodities
Commodity Price Reversals – Commodity Price Reversals
Commodity Price Trend -Commodity Price Trend
Commodity Volatility – Commodity Volatility
Coal Futures – Coal Futures
Sell Commodity Futures – Sell Commodity Futures
Commodity Market Liquidity – Commodity Market Liquidity
Commodity Value – Commodity Value
Long Term Commodity Investing – Long Term Commodity Investing
Tracking Commodity Profits – Tracking Commodity Profits
Bad Commodity Trading – Bad Commodity Trading
Best Commodities to Trade – Best Commodities to Trade
Investment and Trading Potential – Investment and Trading Potential
Commodity Options – Commodity Options
Commodity Futures Profits – Commodity Futures Profits
Commodity Price Patterns – Commodity Price Patterns
Scalping Commodity Profits – Scalping Commodity Profits
Commodity Futures Price – Commodity Futures Price
Commodity Trends – Commodity Trends
Winning with Commodities – Winning with Commodities
Commodity Market history – Commodity Market History
Commodity Trading Patterns – Commodity Trading Patterns
Learn Commodity Trading – Learn Commodity Trading
Agricultural Commodity –  Agricultural Commodity
Commodity Trading Signals – Commodity Trading Signals
Basic Commodity Information – Basic Commodity Information
Commodity Futures Options – Commodity Futures Options
Commodity Futures Trading – Commodity Futures Trading
Technical Commodity Analysis – Technical Commodity Analysis
Live Cattle Commodity Trading – Live Cattle Commodity Trading
Fundamental Commodity Analysis – Fundamental Commodity Analysis
Commodity Futures Equivalent – Commodity Futures Equivalent
Technical Commodity Trading – Technical Commodity Trading
Commodity Trading System – Commodity Trading System
Traded Commodities – Traded Commodities
Hedging Commodities – Hedging Commodities
Trading Commodity Futures – Trading Commodity Futures
Market Commodities – Market Commodities
Beginning Commodity Futures Trading – Beginning Commodity Futures Trading
Diversifying a Stock Portfolio – Diversifying a Stock Portfolio
Trading Momentum Stocks – Trading Momentum Stocks
Stock Market Volatility – Stock Market Volatility
Equity Market – Equity Market
Criteria for Buying Stocks – Criteria for Buying Stocks
Mid Cap Stocks – Mid Cap Stocks
Investment Capital – Balancing Risk Vs. Opportunity
Support and Resistance Zones – Support and Resistance Zones
Stock Market Report – Rolling With The Changes
Stock Quote – It’s Necessity in Today’s Electronically Driven Markets
Online Stock Market Investing – Online Stock Market Investing
Stock Investing Ideas – Stock Investing Ideas
Penny Stock Investing – Penny Stock Investing
Small Cap Stock Investing – Small Cap Stock Investing
Basics of Stock Investing – Basics of Stock Investing
Stock Worth Investing In – Stock Worth Investing In
Moving Average Trading – Moving Average Trading in Technical Analysis
Stock Market Trading Tips – Stock Market Trading Tips
Holiday Gifts – Holiday Gifts; Give the Unique Gift of Education for Individuals New to Investing in the Markets
Stock Market Trading Day – Stock Market Trading Day
Penny Stocks Trading – Penny Stocks Trading
How to Trade Forex – How to Trade Forex
Foreign Exchange Trade – Foreign Exchange Trade
Day Trading Options – Day Trading Options
Forex Mini Account – Forex Mini Account
Day Trading Futures – Day Trading Futures
Trading Fibonacci – Trading Fibonacci
Stock Trading Advice – Stock Trading Advice
Trading to Win – Trading to Win
Trading Success – Trading Success
Buying Margin – Buying “on” Margin
Currency Options – Currency Options
Options Trading Strategies – Options Trading Strategies
Trading Currency Online – Trading Currency Online
Forex Strategy – Forex Strategy
Buying on Margin – Buying on Margin
Currency Rates – Currency Rates
Stocks Shares – Stocks Shares
Trading Journal – Trading Journal
Bearish – Bearish
Buying Currency – Buying Currency
Sell Stock – Sell Stock and Buy Stock with Technical Analysis
Purchase Stock – Purchase Stock Options
Understanding the Stock Market – Understanding the Stock Market
Online Stock Trade – Steps for Placing an Online Stock Trade
Dow Theory – Dow Theory
Technical Analysis of Stock – Technical Analysis of Stock
Commodity Trading Online – Commodity Trading Online
Sell Currency – Sell Currency
Blog Articles – August 2009
Buy and Sell Stocks
Sell Short
Dividend Yield
Buy Online Shares
Future Contracts
Futures Trade
Futures Commodities

Investment Adviser – Investment Adviser
Buy Mutual Funds – Buy Mutual Funds
Buy Options – Buy Options
Technical Analysis Software – Technical Analysis Software
Currency Futures – Currency Futures
Calls and Puts – Calls and Puts
Forex Trading Software – Forex Trading  Software
Trade Stocks Online – You Want to Learn to Trade Stocks Online?
Trading Options Online – Trading Options Online
Blog Articles – July 2009
FX Trader
Commodity Trader
Forex Technical Analysis
Trading Course
Trade Account
Buying Stocks
Trading Volume
Stock Buying
Sell Stock
Buy Forex

Currency Trade – Currency Trade
Day Trading Tips – Day Trading Tips
Stock Analysis for Trading Gaps – Stock Analysis for Trading Gaps at the Bottom and Top of a Trend
Margin Call – What is a Margin Call
Foreign Exchange Market – Foreign Exchange Market
Forex Review – Forex Review
Trading Account – Trading Account
Blog Articles – June 2009
Sell Shares
Trading Day
Currency Trading Online
Brokerage Account
Margin Account
Margin Buying
Trading Forex Online
Option Trading  

Archived RSS Feeds

Selling Covered Calls – Neutral Options Trading Strategy

One of the best techniques when learning how to invest in stocks is selling covered calls. Selling a covered call means that there are investors willing to pay for the right to take a stock if it reaches a much higher price. Selling a call requires that you have at least 100 shares of a stock. It is an excellent stock market strategy to implement while waiting for a stock to reach your identified sell point. This technique can be used over and over, and it can be a great way to create income.

For example, say that you purchased 500 shares of ABC Corp in 2000 for $25.50 per share. Since the current price is $26.00, you have basically broken even in six years. While you didn’t know what would happen during that time, you still could have been making money on your investment by selling covered call options against your shares. This would have allowed you to make money investing in stock even though your investment was sitting around doing basically nothing. You have 500 shares, so you can sell five options, since options must be sold in groups of 100. In this example, you are going to sell out-of-the-money (OTM) covered call options. This means that the stock has a strike price (the target price for the buyer) which is higher that the current price. The covered call that you are selling has a strike price of $30.00 per share and a premium of $ 0.25. Since you have 500 shares, the five covered call options that you sell will bring in a total of $125.00. This technique works well especially if you want to keep this investment in your stock portfolio. Only a substantial move higher forces you to sell; since successful trading is making money, this is a good thing!

By selling covered calls, you are able to accumulate income passively over time by collecting the premiums on your options. If your option doesn’t reach and maintain the strike price during the time period, the premium and the stock are yours. If you get assigned on your options and are forced to sell your covered calls, it is even better. When the $30.00 strike price is met, not only did you receive $125 from the premiums, but you also have a gain on the stock from your original purchase price of $25.50. That turns into a $2,250 profit. Ultimately, the mark of a successful trader is making money, and that’s what you did selling covered calls.

Selling covered calls is an excellent stock option trading strategy, but it is no substitute for technical analysis and learning how to read stock charts. If you purchase a stock on a strong upward trend and someone forces you to sell your covered calls, you no longer have the stock and you are missing out on its upward climb. If you want to continue holding stock in this company, you must buy again and you will be forced to pay a higher price for it.

Selling covered calls is a great way to make money on your favorite holdings while you wait for them to trend upward. This is a great technique which will help you while you are playing the stock market.


Return to main Options Trading Category

Commodities Research

Commodities research is a basic part of commodities trading. Commodities research may be as simple as looking at commodity news reports on Bloomberg, Yahoo Finance, Google News, or your daily newspaper before starting commodity trading. More basic and timely commodities research information comes from the US Department of Agriculture via its Agricultural Market News. This information can be found online and is often what the news services pick up and report. Within the Agricultural Market News traders can find specific reports including daily updates including the Daily National Grain Market Summary. What traders read about commodities is for fundamental analysis. However, both fundamental and technical analysis are important for successful commodity trading. Reviewing recent and long term commodity price patterns will give guidance about future movement in commodities markets. The use of Candlestick charting can give the trader an advantage in trading commodities. A good place to start learning about trading commodities is with Commodity and Futures training.

Fundamental commodity analysis is the basis of what drives futures prices. However, as soon as the first trader has acted on new market fundamentals the market has changed. As traders buy futures or sell futures the commodity price changes. Options traders buying callsbuying putsselling calls, or selling puts all change the market with the sum of their trading activity. Although the trader will have a firm grasp of his or her commodities research it is market fundamentals that drive day to day trading. Rice traders in Japan during the days of the Samurai learned that price patterns repeated themselves and were predictive of subsequent market movement. The same principles that worked three hundred years ago work today with the application of Candlestick pattern formations and Candlestick trading tactics to help the trader profit from commodity price fluctuations.

Commodities research helps the trader anticipate futures prices but understanding market principles helps the trader execute profitable trades. By doing commodity research on a daily and ongoing basis the commodities trader can anticipate major market changes. Because commodities can vary in price over years by a factor or two or more buying futures several years out allows the trader to enter a position at relatively little cost. If market conditions, such as the current drought in Russia and Europe, drive up the price of a commodity such as wheat. The trader need not wait until expiration of his or her contract. The trader can execute a sell when he previous bought or a buy when he previously sold and exit the trade at a profit. Because grain futures can trade several years into the future and oil futures even farther out that is the time horizon for commodities research. A commodity trading system that starts with research of the commodityfs prospects several years into the future gives the trader a solid sense of the possibilities of the commodities marketsCommodity futures trading then becomes a matter of analysis and not one of speculation. Commodities research will help the trader stay well grounded in the possibilities and limits of the commodities that he trades.


Market Direction

The candlestick investor has a great advantage over other investors. The graphic formations immediately reveal what is occurring in investor sentiment. This becomes a very valuable tool for analyzing the market trends. As can be seen in the Dow chart, as the Dow approached the 50 day moving average, the trading formations became very indecisive. Today, the Dow formed a Hammer signal, with stochastics now in the oversold condition. This continued to show evidence that the 50 day moving average was going to act as support.

Commodities Research, Dow

DOW

That information is like a batter knowing what a pitcher is going to pitch next. Because investor sentiment is a predictable reoccurring process, an investor can be prepared for the next price move based upon very simple results following a candlestick reversal signal. After today’s Hammer signal at the 50 day moving average with stochastics in the oversold condition, it becomes a very simple analysis of what should occur the following day. A positive open would be that confirmation a reversal had occurred. Waking up tomorrow and seeing  the premarket futures are trading positive, a candlestick investor will have much more confidence in establishing long positions as quickly as possible.

HAMMERS and HANGING-MAN

Recognition: The lower shadow (or tail) should be at least two times the length of the body. The color of the body is not important although a black body has slightly more Bearish indications and a white body has slightly more Bullish indications.Pattern Psychology: This pattern at the bottom of a down trend is called a Hammer. This pattern at the top of an uptrend is called a Hanging-Man Related Articles: How to Trade The Hammer Signal , How to Trade the Hanging Man.

The appearance of a candlestick signal provides an immense amount of information. It represents what investor sentiment is doing right now. The signals represent a change that have been recognized by Japanese Rice traders for centuries. As can be seen in the wheat chart, last week demonstrated a large candlestick reversal signal. The Bearish Harami forming as the price move away from the T-line, was a clear indication there had been a dramatic change of investor sentiment.

Commodities Research, Dow

December Wheat

The T-line has an opportunity to act as support, creating a J-hook pattern. However, the strength of the reversal signal has to be addressed. The magnitude of the signal should have kept the candlestick trader prepared for a continued downtrend.

Chat session tonight at 8 PM ET

Good Investing,
The Candlestick Forum Team


Scanning Techniques To Higher Profits

Video Boot Camp

Current Website Specials

Click here for details

Website special reflects current newsletter. If you are reading an archived newsletter you will be directed to Current Website Special.

Options Trading Made Highly Profitable with Candlestick Charting

Learning the correct option techniques greatly enhances an investor’s ability to exploit profits while the same time minimizing risk exposure.  The minimum time and effort that it takes to become educated on the proper options trading strategies allows an investor to extract large profits from the markets. Combining the knowledge of candlestick analysis with the insightful knowledge conveyed in our Free Resources Directory on Trading Options puts investors in the position of controlling their own high profit strategies for the rest of their lives.

Full explanation for Bullish Options Trading Strategies, Bearish Options Trading Strategies and more.  Click Here to access additional Options Trading Explained.


Quick Reference Links 

Options Trading Strategies

Buying Calls     Selling Puts     Bull Call Spread     Bull Put Spread

Buying Puts     Selling Calls    Bear Call Spread     Bear Put Spread     Put Hedge

Buy Strangle     Buy Straddle    Sell Strangle     Calendar Spread


Click Here for a Glossary of Option Trading Terms

CLICK HERE FOR RECOMMENDED OPTION TRAINING TUTORIALS

CLICK HERE FOR OPTION EXPIRATION CALENDAR

Candlestick Charting – Why is it Different?

Would you like to learn about a type of commodity trading chart that is more effective than the charts you are probably using now? If so, keep reading. If you are brand new to the art/science of chart reading, don’t worry, we are going to discuss candlestick charting. This stuff is powerful, but it is really quite simple to learn and the results can be impressive!

Technical Analysis: a Brief Explanation

Stock technical analysis is simply the study of companies and their stock prices as reflected on price charts. Whether these charts employ candlestick charting or are simple bar charts, technical analysis assumes that current prices should represent all known information about the markets. Prices not only reflect facts, they also represent human emotion and the psychology and mood of the moment. Prices are, in the end, a function of supply and demand. However, on a moment to moment basis, human emotions…greed and fear, panic, hysteria, elation, etc. also dramatically affect prices. Markets may move based upon people’s expectations, not necessarily facts. A market “technician” attempts to disregard the emotional component of trading by making his decisions based upon chart formations, assuming that prices reflect both facts and emotion.  Charts, even those using only the basics of Japanese Candlestick charting, help the successful investor to compile data into a useful format.

Bar Chart Basics

Both standard bar charting and basic candlestick charting are commonly used to convey price activity into an easily readable chart. Usually four elements make up a bar chart, the Open, High, Low, and Close for the trading session/time period. A price bar can represent any time frame, as shown with the horizontal element of the bar. The total vertical length/height of the bar represents the entire trading range for the desired period. The top of the bar represents the highest price of the period, and the bottom of the bar represents the lowest price of the period. The Open is represented by a small dash to the left of the bar, and the Close for the session is a small dash to the right of the bar. At this point, you might be asking yourself why you need to know candlestick chart analysis if you understand a bar chart. Having said that, let’s look at the stock investing basics of Japanese Candlesticks now.

Candlestick Charting Explained

The answer to the question above may not yet seem obvious, but the results are. Basically, candlestick charts are much more visually appealing and informative than a standard two-dimensional bar chart. As with a standard bar chart, candlestick chart patterns have the basics as well; OPEN, HIGH, LOW and CLOSING price for a given time period are included. The body of the candlestick is called the “Real Body” and it represents the range between the open and closing prices. A black, or filled-in, body represents that the commodity or stock closed lower than its open, or in a bearish condition. When the body is open or white, the commodity or stock closed higher than its open, indicating a typically bullish condition. A thin, vertical line that may be found above and/or below the real body is known as the Upper or Lower Shadow, and its presence represents the high or low price extremes for the trading period. Now that you have the basics of the candlestick charting, let’s compare them to bar charts.

Comparing Candlestick Charting and Bar Charts

Lacking the Shadows of a basic candlestick chart, a bar chart cannot reflect the difference between a price extreme and a high or low. For example, a stock that opened high, but traded low for the day would not be accurately depicted in a bar chart. In a basic Candlestick chart, however, the Upper Shadow would show the extreme of the opening price as well as the trading range for the day.  In this example, the basic candlestick chart formation more accurately represents the trading of the day. In addition, since the stock closed lower than the open, the Real Body would be black; indicating that the day’s trading was bearish. A typical bar chart is simply unable to provide this level of information. And remember, these are just the basics of a candlestick chart!

In conclusion, even the most basic of candlestick charting methods provides its user with a valuable technical analysis tool. When used with a productive stock investing system, you can successfully analyze stocks and their trends before you invest. Why use a limited bar chart when you can have the power of candlestick charting? Your bottom line will know the difference!


Holiday Gift Packages

The Candlestick Forum has several gift ideas to fit every budget
Click here for Current Website Specials.

Website special reflects current newsletter. If you are reading an archived newsletter you will be directed to Current Website Special
 

European Style Option

In the USA European style options are seen on the over the counter market while American style options are typically seen in standard options trading exchanges. Because of the increased flexibility that an American style option offers this style will often trade at a premium when compared to the less flexible European style option. Nevertheless, unless an investor is looking to pick up a stock for long term investment at a low price there is little difference between the two types as both types of contracts can be exited when the trader simply wants to take his profit and not buy or sell the underlying stock, commodity, or future in question. In trading options of either style the trader will be wise to investigate the basics of the equity in question. This is fundamental analysis and it will give the trader a broad view of the potential of the underlying equity in question. To guide the daily buying and selling of options the trader will use technical analysis with Candlestick chart formations. Thereby he will better understand market sentiment and be able to anticipate market trends and market reversal in so far as these market factors will affect the equity underlying the option in question.

Trading a European style option versus and American style option does little to change the leverage and investment risk aspects of options trading. Because in each case the trader can invest only the price of the options premium his capital outlay is the same. Because in each case the trader can exit the position with a profit and not buy the equity his degree of leverage is the same. Because in each case the trader is never obligated to buy the underlying equity unless the price performs as expected investment risk is minimal. In the end the most important aspect of trading a European style option is the typically the same as for an American style option. It is to follow the price of the underlying equity with technical analysis tools such as Candlestick patterns in order to accurately anticipate price changes and to trade accordingly.


Market Direction: The visual capabilities of candlestick signals allows an investor to better analyze what price movements should do at specific levels. The Dow has just now pushed through the resistance level of the recent downtrend. This was fairly well expected based upon the candle formations that came up to that resistance level. Whereas other technical methods may have been tentative in their portfolio positioning prior to the breakout, the candlestick formations were illustrating strong price movements. This observation is much more important than what the actual formations are showing. Having a more clear understanding of what a price trend has a high probability of doing permits an investor to be positioning a portfolio with much more confidence.

European Style Option, DOW

DOW

Understanding the results of candlestick patterns also reinforces the magnitude an investor is establishing long or short positions. As can be seen in the RES chart, establishing a long position over the past few days was done so based upon the identified patterns. On a short-term basis, a J-hook pattern indicated a price movement that would be equal to wave one, prior to the profit-taking wave two. Additionally, the longer term chart revealed a Fry pan bottom pattern that was right at the breakout area. Adding the results of a J-hook pattern to the results of the longer term Fry pan bottom breakout, this created an extremely high probability trade result. The price should continue higher. Furthermore, the price should not only move higher, but based upon the results incurred after a Fry pan bottom breakout, the price should move to the upside with excessive force.

European Style Option, RES

RES

All boats will rise in a rising tide. Many stocks will move higher in a rising market. Candlestick analysis allows an investor to take advantage of price movements that are going to produce excessively high rates of return under normal market conditions. To not take advantage of the information built into candlestick signals is doing a disservice to one’s own investment capabilities. The Japanese Rice traders accumulated   hundreds of years identifying where price trends are reversing and which price trends have the greater profit potential. The successful investor is going to try to find the best trading programs. A trading program does not remain in existence if it doesn’t perform successfully. Japanese candlesticks have been around for hundreds of years. That should eliminate one vital fear most investors have when learning a new trading technique. “Am I learning something that does not necessarily perform well?” If candlestick signals did not work successfully, we would not be looking at them today. Please take the time to learn how to use candlestick analysis correctly and you will have constant control of your investment future for the rest of your life.

What is an effective tool for learning how to use candlestick signals successfully? Although the Candlestick Forum has very easy to understand training CDs on all aspects of candlestick analysis, most investors do not become proficient from just reading about how to use a trading technique. New members to the Candlestick Forum website should be aware of the daily chat room. This is where an investor can reinforce and expedite the learning process. There are many good stock trade ideas being passed back and forth each day. Please take advantage of this valuable tool. It will definitely speed up the comprehension of correct analysis using candlestick signals.

Chat session tonight at 8 PM ET . Learn how to cultivate the trading portfolio to the best possible trade positioning.

Good Investing,

The Candlestick Forum Team


Website special reflects current newsletter. If you are reading an archived newsletter you will be directed to Current Website Special

Trailing Stop – A Little Insurance For Your Profits

In today’s world, you buy insurance for everything. You have a policy that insures your next cruise in case of hurricanes, you spend a small fortune for health insurance, and you even have a policy that protects your coffee maker! Well, if that $40 coffee maker needs a little protection, what about your stock portfolio? In this article we’re going to talk about something that will not only save you money in the stock market, it can even help you make more money. We’re going to discuss Trailing Stop Orders.

First, the definition; a Trailing Stop Order is a percentage-based stop loss strategy. Stop Loss Orders are defensive strategies that protect a stock if the price drops below a certain point. A Trailing Stop Order is different from a typical Stop Loss Order in that it does not rely on a target price, but rather a target percentage to implement a sell. A Stop Loss only prevents you from dropping below a target stock price that you determine; a Trailing Stop follows a stock as its price rises. By doing this, a Trailing Stop Order not only protects against a fall, but it also allows for additional profits. Here’s how it works:

Many stop loss strategies & techniques offer you this protection. You identify a bottom for your stock and say, “If my stock drops to X, I want to sell immediately.” In the case of a Trailing Stop, you don’t identify an exact dollar amount, but a percentage instead. This is the insurance for your original investment. Assuming your stock has risen while you have owned it, you can set your Trailing Stop percentage such that it doesn’t fall below your original price.

Remember that if you’re protecting your original return on investment, it now includes the cost of both buying and selling your shares. If you’re happy with simply not losing, place a Stop Loss Order and relax at this point; if you want more, let’s do something else.

OK, you could have just insured your stock against a bad loss; it’s good stock market advice, but your stock charting indicates a rising trend on this company. Are you willing to only protect your investment or do you want something more? That’s what I thought, you want more. I have the answer for you. The difference in a Trailing Stop Order is that since it’s a percentage, it moves with your stock price. When your stock was at $25 per share, your 20% Trailing Stop would implement a sell if the price dropped to $20 per share. Well now that your stock has soared to $50 per share, you want to protect your profit, right? That’s why you have a Trailing Stop; a 20% stop order won’t sell your stock unless it drops to $40 per share. Because the Trailing Stop can move as the stock increases, your profit is protected against an unexpected fall. That insurance just allowed you to make and protect an additional $20 per share and that money will look real nice in your pocket and it just made you a successful trader as well!

Trailing Stop Orders are a helpful way to not only protect what you have, but to protect what you might gain as well. When used as part of a stock trading plan, it can be a valuable piece of insurance for your portfolio. You have insurance for everything; it’s time to have it for your portfolio as well!