Learn JAPANESE CANDLESTICKS with Stephen Bigalow via online webinar training sessions.
There are really only 12 major Candlestick patterns that need to be committed to memory. The Japanese Candlestick trading signals consist of approximately 40 reversal and continuation patterns. All have credible probabilities of indicating correct future direction of a price move. The following dozen signals illustrate the major signals. The definition of “major” has two functions. Major in the sense that they occur in price movements often enough to be beneficial in producing a ready supply of profitable trades as well as clearly indicating price reversals with strength enough to warrant placing trades.
Utilizing just the major Japanese Candlesticks trading signals will provide more than enough trade situations for most investors. They are the signals that investors should contribute most of their time and effort. However, this does not mean that the remaining patterns should not be considered. Those signals are extremely effective for producing profits. Reality demonstrates that some of them occur very rarely. Other formations, although they reveal high potential reversals, may not be considered as strong a signal as the major signals.
Below is the summary of the major candlestick formations and their definitions. For free print version of signal, with pattern recognition and trading psychology – Click Here Additionally, clicking on any of the individual signals will take you to the specific trading criteria plus signal enhancements and pattern recognition for printout.
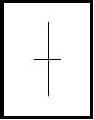 |
A Doji is formed when the open and the close are the same or very close. The length of the shadows are not important. The Japanese interpretation is that the bulls and the bears are conflicting. The appearance of a Doji should alert the investor of major indecision. |
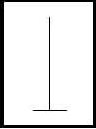 |
The Gravestone Doji is formed when the open and the close occur at the low of the day. It is found occasionally at market bottoms, but it’s forte is calling market tops. The name, Gravestone Doji, is derived by the formation of the signal looking like a gravestone. |
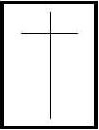 |
The Long-legged Doji has one or two very long shadows. Long-legged Doji’s are often signs of market tops. If the open and the close are in the center of the session’s trading range, the signal is referred to as a Rickshaw Man. . The Japanese believe these signals to mean that the trend has “lost it’s sense of direction.” |
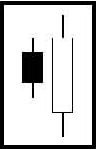 |
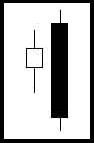
The Bullish Engulfing Pattern is formed at the end of a downtrend. A white body is formed that opens lower and closes higher than the black candle open and close from the previous day. This complete engulfing of the previous day’s body represents overwhelming buying pressure dissipating the selling pressure. |
 |
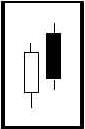
The Bearish Engulfing Pattern is directly opposite to the bullish pattern. It is created at the end of an up-trending market. The black real body completely engulfs the previous day’s white body. This shows that the bears are now overwhelming the bulls. |
 |
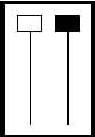
The Dark Cloud Cover is a two-day bearish pattern found at the end of an upturn or at the top of a congested trading area. The first day of the pattern is a strong white real body. The second day’s price opens higher than any of the previous day’s trading range. |
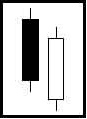 |
The Piercing Pattern is a bottom reversal. It is a two candle pattern at the end of a declining market. The first day real body is black. The second day is a long white body. The white day opens sharply lower, under the trading range of the previous day. The price comes up to where it closes above the 50% level of the black body. |
 |
Hammer and Hanging-man are candlesticks with long lower shadows and small real bodies. The bodies are at the top of the trading session. This pattern at the bottom of the down-trend is called a Hammer. It is hammering out a base. The Japanese word is takuri, meaning “trying to gauge the depth”. |
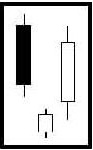 |
The Morning Star is a bottom reversal signal. Like the morning star, the planet Mercury, it foretells the sunrise, or the rising prices. The pattern consists of a three day signal. |
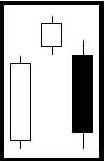 |
The Evening Star is the exact opposite of the morning star. The evening star, the planet Venus, occurs just before the darkness sets in. The evening star is found at the end of the uptrend. |
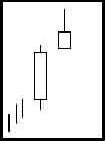 |
A Shooting Star sends a warning that the top is near. It got its name by looking like a shooting star. The Shooting Star Formation, at the bottom of a trend, is a bullish signal. It is known as an inverted hammer. It is important to wait for the bullish verification. Now that we have seen some of the basic signals, let’s take a look at the added power of some of the other formations. |

Act Today and receive Over 8 hours of video tutorials on The 12 Major Signals for only $12.00
(retails in our site for over $500)
Limited One Time Offer for a small $12 processing fee!
PLUS – 30-day Free Trial Membership if ordered today
Next – Basics of Japanese Candlesticks Go to Products on Trading Candlesticks
Training Tutorial
Candlestickforum Flash Cards These unique Flash Cards will allow you to be “trading like the Pro’s” in no time.