Movers and Shakers – Influencing Stock Prices
Anyone knows who has invested in, or even watched, the stock market knows that there are a number of factors that cause stock prices to change; performance of a company, publicity for a company, news that affects the industry and numerous other factors can change stock prices either up or down. While there are a number of different factors that change stock prices, they are in one of three categories: fundamentals, sector changes or market swings. Successful traders will work to understand these influences and this understanding will help decide whether the movement says buy, sell or wait.
Fundamentals
Economic fundamentals clearly have the most direct influence on changes in stock prices. While stock chart patterns indicate that profits and revenues are on a steady upward climb and have no indication of peaking, investors will bid up a company, causing the stock prices to change as they rise to reflect the activity. In contrast, if the trends of struggling stocks show the stock as being flat or declining, it is logical to look for stock prices to change in a negative direction.
Both concepts are examples of fundamental analysis and how fundamentals can change stock prices. Other changes can occur that, subtly and in more complex manners, will affect the stock prices as well, though maybe not in such an immediately detectable way. Such factors can be increased debt, poor acquisitions, and so on that can create a long-term change in stock prices. The conclusion is that changes in the underlying business can directly change stock prices.
Sector Changes
When there are changes in a particular industry or business sector, stock prices will change to positively or negatively reflect the changes. For long term investing, it is wise to remember that some sectors are cyclical in nature and that there will be changes in stock prices that tend to be repetitive. Such a pattern can actually help investors to initiate successful trades if they are able to chart this cycle and respond appropriately.
Another factor that can change stock prices for an entire sector is when a particular industry becomes extremely popular or extremely negative. An example of both situations is the phenomenon of the Internet. Just as quickly as the sector took its companies and their stock prices soaring upward with stock price breakouts, most of them came crashing back to reality when the sector fell.
Market Swings
The old saying is, ?What goes up must come down.? As pleasant or painful as it can be, this tends to also be true of changes in the stock market. When the market is trending upward, most stock prices will change to adjust to this movement. Unfortunately, the same is also true when the market is moving downward. This becomes an opportunity for a savvy investor to use his or her stock trading system. With a system like Japanese Candlesticks, a trader can best anticipate the trends and identify times to make purchases and sales based on a stock investing system that has proven successful for more than 300 years.
Conclusion
A change in fundamentals may be an opportunity to buy more shares of a growing company or it may signal the time to sell if the changes are for the worse. A change in the sector is usually temporary so most long-term investors will ride out dips due to these factors. Assuming that there are no detectable changes in the company?s fundamental and technical analysis, a trader might be more inclined to follow his regular stock trading plan and stock charting techniques to capitalize on the highs and lows of the stock market.
Market Direction
The sideways trading of the past few days is not unusual during the holiday vacation period. The Nasdaq has been moving sideways for the past 3 to 4 weeks. The 50 day moving average is coming up to meet the trading area. With the stochastics in the Nasdaq getting towards the oversold area, the probability of the 50 moving average acting as support looks good. After the steady uptrend in the markets for the past four months, the flat trading appears to be a resting stage.
The advantage of the slow steady uptrend is that the profit taking has been occurring along the way. This should modify any massive tax shifting of portfolios at the end of the year. The major advantage of a sideways general market condition is what the candlestick signals are revealing. There will be positive stock/sector moves during a sideways market. There will be other stocks/sectors showing strong short signals. The effects of the signals will not be influenced by the general market when there is not a definite trend influence. The signals pinpoint where the buying and selling is occurring. This allows the candlestick investor to exploit the price moves at the right times in specific stocks.
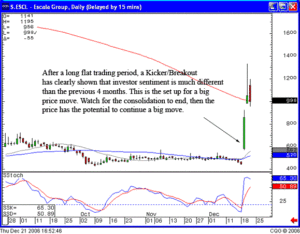
Knowing what the signals represent, as far as investor sentiment, puts the candlestick investor in a strong position. What is the high probability expectation after a major signal? As illustrated in the ESCL chart, the candlestick signal provides very valuable information that most investors will not interrupt. The Kicker signal, forming off a major moving average, has very powerful implications. Strong dynamics are created from the Kicker signal. ESCL, after a Kicker signal, shows that there is a new perception about the stock price. This is more evident after a long period of flat, indecisive trading.

ESCL
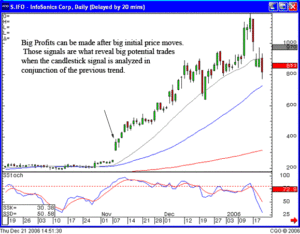
The breakout from a flat trading area is usually produced by an announcement that completely alters the future of that company. A break out, in the form of a Kicker signal, is that much more compelling. Would you buy a stock after it has had an 80% move in one day? Most investors won’t. But if you know what to expect after a candlestick breakout move, an 80% price move does not act as a mental deterrent, it becomes a stimulant/signal. The ability to analyze the information conveyed in candlestick signals then allows an investor to exploit profits from a strong price move that most investors would shy away from.

IFO
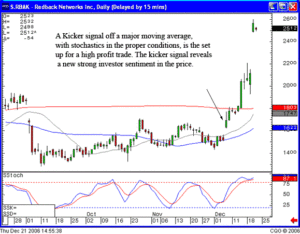
If the eyes become acclimated to recognizing high profit trades, the candlestick investor to participate in big price moves from the initial move. RBAK was brought to everybody’s attention in the Candlestick Forum chat room. The chat room produces a double advantage. Investors learned how to use candlestick signals correctly having a constant flow of knowledge when analyzing live trades. Additionally, many eyes watching for high profit candlestick signal trade potentials produces a source of good trades that most investors might have missed. Do all trades move from $16.50 to $26 in two weeks? Not always, but having the ability to recognize a high potential trade puts the probabilities in the investors favor that they are in a situation that could create big returns.

RBAK
The point of investing is placing funds in investment situations that have good investment probabilities. The graphic formations of candlestick signals are the result of hundreds of years of ‘actual’ statistical analysis.
Breakouts are created like any other candlestick formation. It is the accumulation of investor sentiment during a specific time frame. That time frame may be condensed to a one day or two day time period. Who are the investors that are buying a stock at five dollars and selling 30 days later at $21? The investors that understand what the breakout signals illustrate. This is not difficult to understand. The information compiled into candlestick signals is knowledge that has been analyzed for the past few centuries. Utilize that information for your own portfolio success. Click here for the Candlestick Forum Break-Out training CD.
Investment cruise
This coming April 2007, Mr. Bigalow will be one of three or four speakers on an investment cruise. These cruises are extremely beneficial to investors that would like to learn a number of investment techniques. Being exposed to a number of investment techniques all at one time creates huge advantages. It allows investors to combine investment techniques into the mode of investing that is most comfortable for them. Watch for of the dates and details of this cruise. They are not only educational but extremely fun. This is an opportunity to gain a concentrated education on investment techniques that are working successfully.
Chat session
The chat session tonight will be at 8 p.m. ET. Everybody is welcome. This will be the last chat session until after the first of the year. Click here for instructions on how to join the stock chat.
Good investing
The Candlestick Forum Staff
New Year Specials – 20% Off all Quick-Download Videos and E-Books – Buy Now before Offer Ends!
“Profitable Candlestick Trading” and “High Profit Candlestick Patterns“
Speak Your Mind