Every investor should have a stock trading plan, especially going into a new year of investing. The development of the next year’s stock trading plan should include the evaluation of the previous year. Specific sectors moved very well during 2005. The energy stocks for example. Analyzing what sectors or industries could have strong moves in the coming year is like shooting in the dark. However, simple sectors scans utilizing candlestick signals reveal which sectors/industries appear to be bottoming out and starting an upward trend. Assuming that some sectors will perform well after other sectors have performed well provides a smaller universe for watching for candlestick buy signals. It can be easily assumed that if mail order catalog companies or online companies are seeing dramatic increases in sales, then the transportation/delivery industry could be expected to perform better.The candlestick charts reveal when new dynamics enter a sector.
When developing a successful stock trading plan, some mild preplanning should be put in place. Although the candlestick signals will identify specific sectors that are starting to perform well, having some anticipation of what those sectors might be helps confirm establishing positions in those sectors when the signals do appear. Always keep in mind that prices move based upon the perception of changes in fundamentals. Currently, confidence is coming back into the electronics industries. This may fall in line with the concept that technology is starting to advance at a very rapid pace.
The most successful stock trading program for 2006 may be a two faceted approach. Candlestick signals can be utilized for identifying the sectors that will make the biggest moves this coming year. Also, they will identify the individual stocks that announce product advances which may not only dramatically change their own fundamental capabilities, but may also alter the dynamics of a whole industry.
Market Direction
The bullish signal that made itself evident on the first day of trading this year has produced very strong profits in the portfolio. Having the ability to visually witness what investor intentions were from the first day of trading created an opportunity to be investing aggressively, the portfolio positioned all to the long side. Knowing the truisms found in candlestick analysis has produced some very large gains in positions. The longer a trend continues, the more confident the average investor will exhibit. Where do most investors buy? They get more confident at the top. Does this imply that the top is getting close? Not necessarily, but the effects of continued confidence can be seen from candlestick chart patterns that revealed the buyers coming in early and continuing their buying. That can be clearly witnessed in a couple of our recommendations.
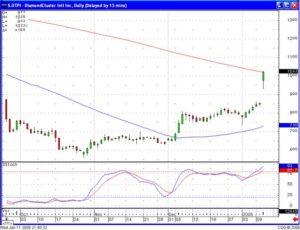
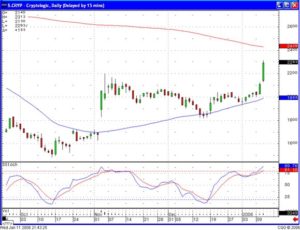
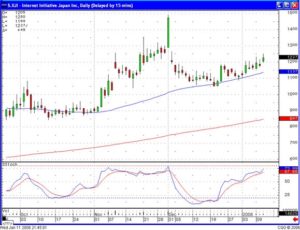
DTPI has been in a slow and steady uptrend for over a month before it was finally discovered by an analyst to recommend it. Candlestick signals alerted investors to start buying, if they did not get in at the $6.50 level, at the $7.50 level or the $8.00 level. CRYP was identified as a buy in mid-December and created another buy signal at the first of January. IIJI is another chart pattern that is revealing strong potential to the upside, a fry pan bottom forming off the 50 day moving average.

DTPI

CRYP

IIJI
Will candlestick signals always find the best trade situation? They will greatly improve your chances of gaining big profits when you learn them and always apply them with your stock trading plan!
Speak Your Mind