Stock price volatility is an indicator that is most often used by options traders to find changes in trends in the market place. There are two main types of stock volatility including historical volatility and implied volatility that are used in the options markets. The increase or decrease in volatility results from changes in investors emotions in the market place. More specifically greed and fear in the market place are the two main factors that cause stock prices to change. Stock price volatility tends to rise when there is new information released in the markets however the extent to which it rises is determined by the relevance of that new information as well as to the degree in which the news surprises investors. In today’s article we will discuss both types of volatility and how each type is used.
Historical volatility, often referred to as actual volatility and realized volatility, is the measure of a stock’s price movement based on historical prices (stock price history). and it is used to measure how active a stock price typically is over time. It measures the fluctuations in the share price, and more specifically it is measured by taking the daily percentage price changes in a stock and calculating the average over a specific time frame. It makes sense that long term investing requires the use of longer time frames to calculate the historical stock price volatility (60-day to 360-day) while short term investing requires the use of shorter time frames (5-day to 30-day).
Implied volatility is the current volatility of a stock and is estimated by its option price. In other words, the implied stock price volatility is that level of volatility that will calculate a fair value that is equal to the current trading option price. When looking at an option to determine its implied volatility, there are five parts to take into account. These include the strike price, the expiration date, the current stock price and the stock dividends paid by the stock. Investors will then use an options pricing model, using these parts, to find the implied volatility. This calculation is often used to find an option’s value in the market. When options trading, investors will use this calculation when setting up combination strategies. These investment strategies are used to find expensive or cheaper options. It is important to note however, that each option on a stock can and will most likely have a different implied volatility because there different strike prices and expiration dates.
The stock price volatility can also be useful for non-options trading as well. Traders must be very careful when doing this and should combine volatility with other technical indicators. Implied volatility tends to be a leading indicator of stock direction. For instance, when a stock falls and the implied volatility doesn’t change, the market doesn’t really worry about it. Conversely, if the implied volatility rises, then the market is nervous about the stock’s downside potential.
There is a lot more to the stock price volatility that every investor should know and understand, especially those investors interested in online options trading. The importance of understanding the fundamentals to trading and investing in stock cannot be stressed enough.
Market Direction
When the markets become extremely volatile, that usually prelude’s a change of investor sentiment. As we have witnessed in the Dow over the past few weeks, the daily trading range has expanded to 400 to 800 points a day. These excessive swings in daily trading illustrate the indecision that is going on between the bulls and the bears. This becomes vital information for investors. After the strong bearish move following the Dumpling Top pattern, the next question becomes whether the consolidation that has occurred, over the past week and a half, was ready to form a bearish J-hook pattern or a bullish double bottom. Until that can be answered, the risk factor of being exposed to the market was too great. Consider your own emotions during the past few weeks. When the market is down 777 points, it is very difficult to find any reasons to be bullish. More than likely, the fear of what might be going on in our economy was probably enhanced. The major benefit of candlestick analysis is the visual depiction of what direction investor sentiment is likely to move. Today’s bullish trading; bringing both the Dow and the NASDAQ up through the T-line provided more evidence to the bullish side. Until today is trading, it could not be clearly evaluated whether the T. line was acting as resistance or not.

DOW
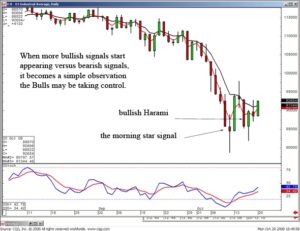
Price volatility becomes a valuable input when utilizing candlestick signals. As seen in the Dow, the reasonal bottoming action has revealed more bullish candlestick signals than bearish candlestick signals. Add that information to the fact that stochastics were slowly moving up, today’s strong close provides more evidence that the Bulls appear to be taking control. The next confirmation would be a close above the 9450 area, a reasonable resistance area. The longer prices appeared to stabilize, the more likely the markets ‘fear’ will dissipate.

NASDAQ
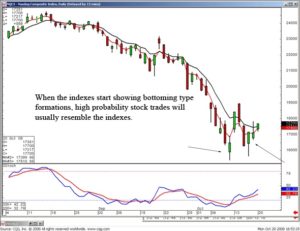
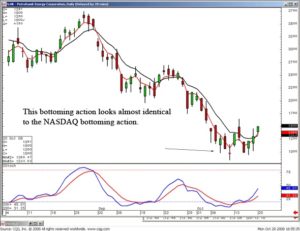
When the indexes are showing bottoming signals, our scanning procedures will likely find individual stock charts with the same patterns. As can be seen in the NASDAQ chart, it is forming a stutter step bottom. It is not difficult to find numerous individual stock charts with the same pattern set up. As often discussed in our evening chat sessions, it is much better to find stocks that are moving in the same direction as the market in general. Why go against the current? The probabilities of being in a correct trade are increasingly improved when the market and the sector are all producing the same bullish patterns. Candlestick analysis is merely the implementation of common sense investment procedures put into a graphic depiction. It allows an investor to put all the probabilities in their favor.

HK
Do you want to have a much better understanding on which way the market is moving? Do you want to be able to find the best probability individual stock trades in those market conditions? If you are not a member of the Candlestick Forum, you are missing out on the immense amount of information that is provided by candlestick signals. Our daily chat room involves constant analysis of what signals and price movements are revealing. The best method for learning a trading program successfully is to have a community of investors that are all assessing the same information at the same time. When you back up the live information with over 500 pages of Candlestick Forum information, you get a much better grasp of how the successful investor looks at the market. Take advantage of the membership special this week. This is the time to be learning how to understand what the market movements are telling you. You will not be disappointed with the amount of insights you gain from working with other candlestick investors. Join us today. The information you gain from candlestick analysis will benefit your investing for the rest of your life.
Chat session tonight at 8 PM ET for members only.
Good investing,
The Candlestick Forum Team
This Week’s Special
Free Video Download with Monthly Membership Purchase
Free video PLUS EXTRA Free Month with Annual Membership Purchase
Website special reflects current newsletter. If you are reading an archived newsletter you will be directed to Current Website Special.
Speak Your Mind