The most successful stock traders keep a trading journal, they have a stock trading plan, and they constantly document their trades in their journal. Not only do they keep this journal, but they know what information they must document in the journal and they do it every time they trade. They keep a thorough and detailed record of every trade and the information below in order to grow as a trader and to prevent themselves from making recurring mistakes when trading stock.
- Numbers – Keep a trading journal that contains information on your key markets. Donft just read stock charts but write down the highs, lows, close, and volume of those markets that you follow as well as your most important technical indicators. This will keep you in tune with the markets.
- Record Every Trade – As stated above you must record every trade you make, not just when you feel like it!
- Record your Feelings and your Thoughts – In order to fully comprehend why you performed a specific action when you place a trade, you must document how you felt when you placed the trade as well as your though process that occurred. The psychology of investing tells us that you must not only understand the technical aspects of stock trading, but you must also understand the emotional aspects as well. Thoughts and feelings shape your behavior so it makes sense that you would want to document these things as you place a trade.
- Document your Strengths and Weaknesses – You must document in your trading journal, your strengths and your weaknesses so that you know what you are good at what you need to work on. You will always have things that you need to improve upon when you trade stock, and the hard work is never over.
- Develop a Trading Plan – You must have a trading plan before you even begin trading in the stock market, and you must also document as part of your trading plan, how you will work to overcome your weaknesses. Just identifying your weaknesses is not enough; you need to implement an action plan as to how specifically you will overcome your limitations. Focus on your strengths to help you do this.
- Track Performance – You must track your performance in your trading journal. Your personal data will show you not only your progress but again, where you have the need to improve. Track your wins vs. your losses and ensure that you are winning overall. If you are losing overall, then you will need to take a step back and reevaluate your trading plan and trading strategies.
- Journal Everyday – You must document in your journal every single day you trade. Go back and review and analyze what you have written. It does not do you any good to write it all down if you never revisit it. Use your journal in part as a workbook to improve your trading. You will be amazed at how much you learn from yourself!
Remember, you are only as good as you make yourself. Have a trading plan, document your trades, and trade with discipline and you should reach your true trading potential.
Market Direction
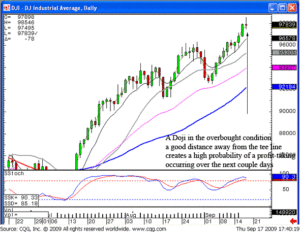
Both the Dow and the NASDAQ formed a Doji in today’s trading. This does not necessarily mean the uptrend has come to an end. However, the advantages a candlestick investor derives from knowing what a Doji represents allows for the preparation of the next days trading strategy. The uptrend is still in progress. However, a Doji has formed in the overbought conditions. Positive trading on the open tomorrow would indicate the uptrend remains in progress. Weakness on tomorrow’s open would demonstrate today’s indecision has now produced a high probability scenario for a profit-taking pullback.

DOW
As we have seen in this recent uptrend, the pullbacks have been very short-lived. Either a two or three day pullback was followed by the next bullish uptrend. In most cases, the profit-taking ended very quickly. This created a decision making process. Was this the time to take profits or was this just a pullback during an uptrend? If the uptrend continues to look as if it is the predominant analytical factor but there appears to be a reversal, maybe profit taking, should I sell a profitable position and be prepared to buy it back if the uptrend continues? This is a question most investors have to face. But there is another solution.
Option trading is usually considered for trying to make large, leveraged profits from a price move. They can also be used effectively for protecting profits. The use of candlestick signals allows an investor to analyze when a price reversal should be occurring. The price reversal could be merely profit taking or it “could” be the beginning of a major reversal. Not knowing which it could be, there are some very simple options strategies that can be put into place.
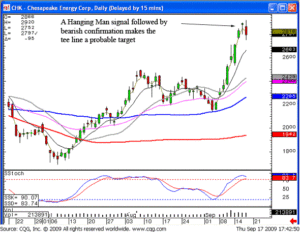
Option strategies are merely a tool that exploits the information found in candlestick signals and patterns. As illustrated in our recent recommendations of Chesapeake Energy Corp., The Hanging Man signal, followed by selling, produces an extremely high probability situation that a pullback in price is about to occur. Strong price move has ramifications. It could be the pre-requisite for a Jay hook pattern. The price could come down and test the T-line. A bounce up from the tee line would indicate the Jay hook pattern was in progress. Or this could be the top of an uptrend and a major reversal has occurred. What options strategies would be beneficial under these circumstances?

CHK
If the market opens weaker tomorrow, and it is easily visualized that a Hanging Man signal was confirmed in today’s trading, what would be the logical conclusion? Probably CHK would selloff. Would it support on the tee line? That we do not know. A strategy for a one-day option trade could be to buy a September 28 put for $.40. If the market sold off hard tomorrow, testing the tee line at approximately the $26.85 level, holding the stock would have lost approximately $1.15. Buying the September 28 put for $.40 in the morning may now have moved to $1.15 when the price did test the tee line. At that time, what is the important factor we are looking for at that level? Whether the price held the tee line or not.
If the price moves down to the T-line, the put trade is closed. A 70 cent gain in the option offsets the $1.15 loss of the stock. At this point, a better decision making process can be made. If the price closes near the tee line, what should be watched for the next day? Whether the price holds the tee line or not. That decision can be made without a major move to get to that level. The $.40 was insurance to offset a price move. That has occurred on the previous trading day utilizing a put to help offset the loss required to get to the tee line.
Candlestick analysis utilizes options strategies to exploit large profits out of the market or protect existing profits. The Candlestick Forum will be presenting a Two day option trading program on September 26 and 27th. Click here for details. Option trading strategies are very simple. It is knowing how to apply those simple strategies with the correct candlestick analysis that will greatly improve option trading returns. Have you ever wondered why some people have had to spend thousands upon thousands of dollars to learn sophisticated option strategies that don’t seem to work? Then they have to go back and spend more money to learn why they are not making money with option strategies? That does not need to be done! Candlestick analysis is merely the graphic analysis of what investor sentiment is doing. That is the most important aspect of a successful trade. Once you have learned that, utilizing simple option trading strategies will produce very large profits without spending mega-thousands to learn how to do it.
Chat session tonight at 8 p.m. ET – we will be looking at a few very simple but effective options strategies in conjunction with candlestick analysis.
Good investing,
The Candlestick Trading Team
This Week’s Special
Last week to Save 50% OFF Options Trading Course
Annual Membership Special – Receive an Extra Month + Bonus
Website special reflects current newsletter. If you are reading an archived newsletter you will be directed to Current Website Special.
Speak Your Mind