Utilizing a stock trading system provides an investor with many benefits. The most important benefit is utilizing proven trading techniques. Most investors do not have a stock trading system. They tend to buy what is most advocated by investment publications and the experts on the financial news stations. The problem with that investment style is that when most industries and stocks are already highly publicized, most of the price move is already gone.
A true stock trading system is one that finds price moves before everybody is aware of them. Candlestick signals are a highly productive means for finding price patterns that work effectively. When one coordinates Candlestick signals with known high profit patterns, an investor can develop a stock trading system that constantly puts the probability in their favor. Making a study of the Candlestick signals, especially the 12 major signals, in conjunction with recognizing some simple high profit patterns allows an investor to consistently place investment funds in trades that will produce profits an inordinate percentage of the time.
When developing a stock trading system, one of the objects should be to keep it very simple to apply. The J Hook Pattern provides the Candlestick investor with some very simple profitable applications. The first uptrend will usually show clear Candlestick sell signals when it comes to an end. The top may be formed with the stochastics in the overbought area or very close to the overbought area. Because of the strong initial uptrend, the first evidence of sell signals should be acknowledged. Even if it is suspected that the uptrend could be forming a J Hook Pattern, why a risk remaining in the trade? When sell signals become evident, take profits.
What criteria makes a Candlestick investor suspect a J Hook Pattern to form? The analysis of the market trends in general might provide that information. For example, if a stock price has had a strong run up while the market indexes have had a steady uptrend, and the market indexes do not appear to be ready for a significant pullback, continuing its uptrend, then a strong stock move could warrant some profit-taking before the next move up in its trend. The benefit of being able to identify Candlestick signals is being prepared for the witnessing of some Candlestick buy signals after a few days of pullback. These signals would also alter the trajectory of the stochastics that should also be pulling back.
Witnessing Doji’s, Hammers, Inverted Hammers, or Bullish Haramis after a few days a pullback becomes an alert that the sellers are starting to wane. If the stochastics are flattening out during that same time frame, then a set-up for a J Hook Pattern is taking place. Taking profits when the first sell signals occurred in the initial uptrend eliminate the downside risk. Those Candlestick sell signals indicate that it is time they get out of the trade. Even though the strength of the initial move would cause us to suspect that a J Hook Pattern may form, there is no guarantee that the pullback couldn’t retrace 20%, 40%, 60%, or even greater, of the initial up-move.
This creates a trading strategy that allows for an investor to utilize the common sense built into the Candlestick signals. When it is time to get out, get out. If, after a few days, small Candlestick buy signals start forming, there is nothing wrong with buying back into the position. The second entry of this trade now has some targets that can be clearly defined. The first target should be the test of the recent high. Although this may not be a huge percentage return to that level, at least the probabilities indicate that it should be profitable.
The benefit of Candlestick signals, once again, can be applied if and when that recent high is tested. Witnessing another sell signal as the price approaches the recent high trading level would be a clear indication that the recent high was going to act as resistance. This would induce taking quick profits and getting back out of the trade. On the other hand, if strong signals are seen as the recent high is breached, that would be a clear indication that the recent high was not going to act as a resistance level and that the new leg of the trend is in progress. Recognizing this pattern and the elements that form it allows an investor to move decisively at the right points of a trend. Being prepared for the pattern and knowing what signals to look for creates opportunities to participate in a profitable trend while greatly reducing risk.

LTR
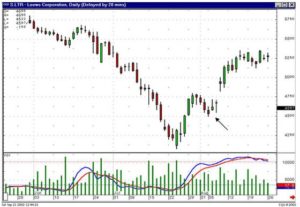
Note the J Hook Pattern in LTR. Once the trend started up, the pattern formed when the price pulled back for a few days. However, the stochastics never reached the oversold area and they came down only part way before hooking back up. The signals indicated buying before it pulled back too much, showing the buyers were going to test the high of the previous week. The gap above the recent high indicated that the buyers were very eager to see prices go to much higher prices.
The Candlestick signals should be the basis for a successful stock trading system. The signals consist of hundreds of years of actual analysis, not simulated back-testing. Investment patterns have also been identified through the years. When the Candlestick signals are applied correctly to the high-profit potential patterns, their effectiveness becomes all that much greater. For the investor that wants to create a stock trading system that can be monitored for a success/failure ratio, he should input as much proven trading techniques into his program as he can accumulate. The strongest element for starting any stock trading system should be the Candlestick signals.
Speak Your Mind