What does it mean if the market is considered to be bearish? In today’s article we explore what a bear market is as opposed to a bull market, as well as what a bear raid and a bear tack are as it relates to the stock market.
A bear market is a market condition in which the prices of stock or other securities are falling. It is also marked by widespread pessimism that causes negative market and investor sentiment that does not change for a while. Stock investors will anticipate more losses in this market as selling of stocks and other securities continues and causes pessimism in the stock market to continue. Analysts consider an entry into a bear market when there is a downturn of 20% or more in multiple market indexes over at least two months.
Bear markets should not be confused with a correction. Corrections are short term trends that occur for less than two months. While the correction may appear bearish in nature, you have not entered a true bear market unless the conditions described above have been met. The market indexes that a bear market can occur in are indexes such as the S&P 500 and the DIJA.
When investing in the stock market it is important to understand what signifies a bullish market. A bull market is characterized by optimism and investor confidence. The expectation of market players is that the strong results will continue.
Where were the terms bear and bull derived from?
The use of the terms bull and bear market where derived from the way animals attack. A bear swipes its paws down whereas a bull thrusts its horns up into the air. These actions act as metaphors for the movement of the markets. These terms can refer not only to the stock market, but also to commodities, forex, bonds and other financial instruments and their markets.
A bear raid is the illegal practice of attempting to push the stock price lower by taking short positions and spreading unfavorable rumors about the target firms, which was a popular practice back in the early 1900’s. A bear tack is a decline in the price of a stock, market sector, market, or investor sentiment that assumes a fall will occur soon. It is a buzz word that refers to bearish movements in the short to medium term.
Continue to expand your knowledge and learn more stock market terminology. There is a lot to learn and the proper education in absolutely necessary to successfully invest in the stock market.
Market Direction
The forces of a trend are not dictated by one candlestick signal. It is an accumulation of information provided by the charts that make for the accurate analysis of a price trend. Will there be sell signals in an uptrend? Definitely yes. Will there be buy signals in a downtrend? Definitely yes. The importance of analyzing a chart is to recognize the signals and its correlation to the surrounding indicators. Those indicators are made up of other candlestick signals as well as the locations of the moving averages and stochastics.
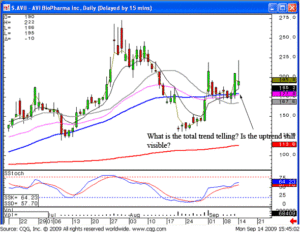
Will there be selling in an uptrend? Will a stock open lower the next day after a very bullish candlestick signal? The answer is yes and the frequency of these situations is relatively common. As illustrated in the AVII chart, after the price created a Jay hook/cradle type pattern on Friday, it opened much lower on Monday. Should this cause concern? Yes, but only to the point of keeping a closer eye on it during the trading day. Does the lower open mean the sellers are in control? That concern becomes diminished when observing the potential of a Jay hook pattern, the support that seem to sustain itself on the tee line and the stochastics appear to confirm a Jay hook pattern probability.

AVII
Many investors lose a portion of their income to panic selling when the price appears to go against the current trend. Analyze the whole chart picture, not one specific trading day. The probabilities work greatly in your favor when you allow the chart pattern to work itself out. As witnessed in today’s trading, AVII opened lower, used the tee line as support, then experienced more bullish participation. Before bailing out of a position early in the day, ask yourself whether the chart pattern is in a bullish trend, a bearish trend, or in the reversal stages. Making that simple assessment will often keep you in a position, allowing the full trend to work itself out.
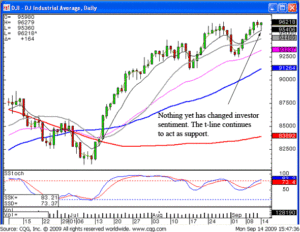
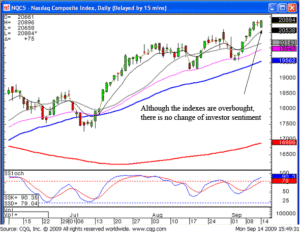
That same analysis process can be used when analyzing the markets in general. ‘Selling’ days in an uptrend do not necessarily indicate a change of trend direction. Indecisive candlestick formations forming in a pullback,after an uptrend, has much different connotation than decisive selling days in a pullback. The more you understand and become knowledgeable on what each individual and signal depicts, the more accurately you will be able to assess a price move.

DOW

NASDAQ
This becomes extremely important for the more leveraged a trading program becomes. The option trader needs to have a very clear and concise understanding of price trend movements. Candlestick signals benefit in this area dramatically. Option trading requires very fast and accurate decision-making processes. Candlestick analysis makes trading options a much more viable and disciplined trading program. Entry and exit strategies will become much more fined tuned with the graphic portrayal of investor sentiment. Take advantage of the information provided by each individual signal. Applying that information to the current chart pattern allows an investor to make educated assessments of what the next price move should do.
Chat session tonight at 8 p.m. ET
Good investing,
The Candlestick Forum Team
Speak Your Mind