If you are interested in buying commodities there are a number of things to do before opening an online trading account. The obvious ones are to research online trading software and take an online trading course such as Commodity and Futures Training. Aspiring traders will also want to have a fast internet connection and computer hardware with the capacity to handle lots of data in a hurry. A Windows 2003 server is typically sufficient. As a general rule of thumb the trader will want at least 4 GB of memory and a dual core 3.2 GHz processor or two Quad-core 2.6 GHz processors. Then the system will need two network cards, one pointed towards the system and the other pointed towards the exchange. A hard drive with 30GB or more memory capacity will be needed to store the software and log files. Once the trader has the hardware set up, the software installed, and has taken the first online class the work starts. To engage in successful online commodity trading the trader needs to develop a trading strategy for buying commodities.
A commodity is a thing that is bought, sold, and, commonly, consumed. Buying commodities like corn futures and oil futures is done for two reasons. Producers and processors of these commodities engage in hedging in the commodities markets in order to reduce investment risk. Other traders buying commodities and selling commodities do so in order to profit from recurrent commodity price fluctuations. Gold futures are different in that industrial use is a small aspect of the value of this precious metal. Gold prices fluctuate with the state of the economy and concerns about inflation. However, when buying commodities the trader is concerned about price. How the commodity is used is only important so far as that information affects commodity supply and demand. Buying commodities is profitable in so far as the trader is able to anticipate rises in commodity prices. The trader will buy futures on the commodity and then sell once the price has risen. If the price is likely to head down then the commodity trader will want to sell commodities instead of buying and then buy when the price has gone down.
The point of this discussion is that a commodities trader needs to learn the fundamental analysis of the commodity he trades and needs to use his trading software to do continual technical analysis in order to profit. Developing a commodity trading system is of utmost importance which is why a formal start to learning about buying commodities is important. An alternative to buying commodities is buying calls or buying puts on futures contracts. Unlike buying commodities, buying options does not confer an obligation to buy the commodity. The trader buys the right to either buy or sell the commodity future in question. He or she need only exercise the options contract if the price moves in the right direction. Although the options trader pays a premium for buying options he does not lose money based upon unexpected price movement when buying commodities.
Market Direction
When is it time to take profits? This is a difficult function for most investors. Many investors know how to enter trades, but they have a very difficult time knowing when do come out of a trade. That process is made simple using candlestick analysis. Because the signals have definite expected results, profitable trading strategies become very simplistic. The signals are usually the strongest indicators for when there has been a change of investor sentiment. Confirming indicators also dramatically improve the probabilities that a trend reversal has occurred.
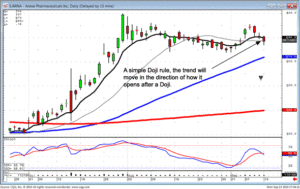
As illustrated in the ARNA chart, there was an obvious time to come out of that trade. The Doji, followed by the Bearish Engulfing signal, known as a left/right combination, indicated more weakness than what should be expected for an uptrend. The tee line acted as a possible support level. However, when the Doji was formed on the tee line, the candlestick investor had a very simple trade strategy. Knowing that the trend would move in the direction of how it traded after the Doji is a very simple but valuable trading tool. The lower open confirmed the downtrend. This was also reinforced by the fact the tee line did not act as support. That was the appropriate time to be out of this trade.

ARNA
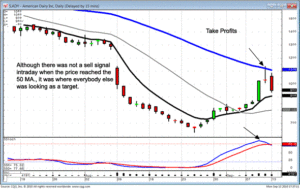
There will be times when it is advisable to take some profits even though a candlestick sell signal has not yet formed. This is illustrated in the ADY chart. If buying at the Morning Star signal, and then seeing the price breach the tee line, what becomes the next logical target? The 50 day moving average! What assumptions can be made about the 50 day moving average? Everybody will be watching that level. They will be watching that level as a potential target. As a candlestick investor, taking profits as the price reached the 50 day moving average became more compelling. Note where the stochastics had moved to by the time the prices got to that level. Also note what occurred the previous day. A big bullish candle in the overbought condition. The following day, when the price moved a good percentage again to reach the 50 day moving average, taking half of the position off at the 50 day moving average is prudent even though there would not have been a candlestick sell signal developing at that time. Visibly the candlestick investor would be able to see the exuberant buying in the overbought condition.

ADY
The following day, when prices opened higher, the candlestick investor has some very simple entry and exit strategies. If the price continued bullish, coming back up through the 50 day moving average, and the previous days high, half of the position could have been bought back. That bullish strength would have indicated the 50 day moving average was not going to be resistance anymore. Filling the gap from early August would now be the next potential target. If the price had opened lower after the Doji, the remaining half position would’ve been closed out immediately. When the price opened higher, a simple stop loss strategy could be put in place. Placing the stop loss one penny below the previous days open, the Doji, would’ve indicated the bears were still in control.
Candlestick analysis is not merely identifying where the reversals are occurring, is using common sense visual elements of a candle bodies to decide when to be in or out of positions. Utilizing this information takes a great deal of the emotions out of ones investing.
Chat session tonight at 8 PM ET. – for members
Good Investing,
The Candlestick Forum Team
Quick-Start Trading Package – 50% OFF!!!
Fall 2010 E-Learning Online Training Schedule
Basic Stock Market Training with Candlestick Analysis
September 25 & 26, 2010
Options Training Course
October 16 & 17, 2010
Commodity Training
November 6 & 7, 2010
Boot Camp
November 20 & 21, 2010
Website special reflects current newsletter. If you are reading an archived newsletter you will be directed to the Current Website Special.
Speak Your Mind