Stock market investing becomes much easier when an investor can evaluate the direction of a market. Trends can be projected by the Candlestick signals and the market patterns that have occurred over and over in the past. Understanding what the Candlestick signals illustrate becomes a valuable tool. Familiarization with the psychology that forms the signals helps one understand what the next trading trend will be.
Stock market investing should be done with an accountable trading platform. The accountability is required for analyzing the probabilities of being correct. An investor, who is investing in the stock market or any other market, that does not maintain an investment strategy will never produce consistent returns. Investing without a trading program never allows an investor to analyze when to exit a trade. Also, it does not allow an investor to improve upon their stock market investing when trades don’t work. Candlesticks charts make this process much easier.
Candlestick signals provide a format for investors to get into trades where the probabilities are in their favor. Utilizing the Candlestick signals for entry and exit strategies also provides an investor with very simple stop loss procedures.
The fact that a Candlestick buy signal is formed by a reoccurring set of Candlestick formations permits an investor to utilize visual statistical analysis. The 12 major reversal signals would not be in existence today if they did not work an extremely high percentage of the time. Use these basic assumptions to your advantage.
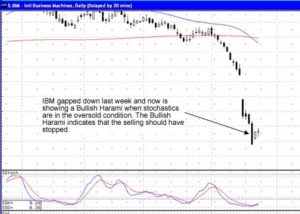
IBM is a prime example. This week it formed a Bullish Harami. The stochastics are in an oversold condition. The stock price gapped down the prior week with stochastics in the oversold area. This was an alert to start watching for a Candlestick buy signal. The Bullish Harami on Thursday resulted in continued buying, in a weak market, on Friday. This provides a format for trading IBM. If it shows more strength on Monday, the Bullish Harami will have provided a signal that the selling had stopped. This is not rocket science. These are observations that have worked successfully for the past few centuries.

IBM

BULLISH HARAMI
Description
The Harami is an often seen formation. The pattern is composed of a two candle formation in a down-trending market. The body of the first candle is the same color as the current trend. The first body of the pattern is a long body, the second body is smaller. The open and the close occur inside the open and the close of the previous day. Its presence indicates that the trend is over.
The Japanese definition for Harami is pregnant woman or body within. The first candle is black, a continuation of the existing trend. The second candle, the little belly sticking out, is usually white, but that is not always the case (see the Homing Pigeon signal). The location and size of the second candle will influence the magnitude of the reversal.
Criteria
- The body of the first candle is black, the body of the second candle is white.
- The downtrend has been evident for a good period. A long black candle occurs at the end of the trend.
- The second day opens higher than the close of the previous day and closes lower than the open of the prior day.
- Unlike the Western “Inside Day”, just the body needs to remain in the previous day’s body, where as the “Inside Day” requires both the body and the shadows to remain inside the previous day’s body.
- For a reversal signal, further confirmation is required to indicate that the trend is now moving up.
Signal Enhancements
The longer the black candle and the white candle, the more forceful the reversal.
The higher the white candle closes up on the black candle, the more convincing that a reversal has occurred despite the size of the white candle.
Pattern Psychology
After a strong downtrend has been in effect and after a selling day, the bulls open the price higher than the previous close. The shorts get concerned and start covering. The price finishes higher for the day. This is enough support to have the short sellers take notice that the trend has been violated. A strong day after that would convince everybody that the trend was reversing. Usually the volume is above the recent norm due to the unwinding of short positions.
Market Direction
The Dow showed some strong bottoming action this past week. Monday, there was a Spinning Top, confirmed with some buying on Tuesday. Wednesday, there was a Bearish Engulfing signal. A Bearish Engulfing signal at the bottom has a different meaning than a Bearish Engulfing signal appearing when the stochastics are in the overbought area. A Bearish Engulfing signal at the bottom is usually the last gasp selling. It acts as a forewarning to start looking for a Candlestick buy signal. That buy signal came on Thursday as a strong Bullish Engulfing signal.
Thursday, there was the strongest bullish trading day that the Dow has experienced in a couple of years. After that strong bullish signal, the selling on Friday may not be much to be concerned about. It is not unusual after a sustained downtrend to see a follow-through day of selling after a Candlestick buy signal. What will be important to see on Monday is more buying coming into the markets.
That leaves two definite scenarios to be watched for. A weak day on Monday, closing back down near the low end of Thursday’s Bullish Engulfing signal would reveal that the bears were still in control of the trend. That would instigate closing any remaining long positions.
Speak Your Mind