The most striking facet of Japanese candlesticks is their ease of identification. Hundreds of years ago, Japanese rice traders become ultra-wealthy using Candlestick signals to trade rice. These signals were developed through simple observation. As years of successful utilization of the signals progressed, they even were able to analyze the psychology behind forming the signals. This provided a very powerful tool for projecting future price movement.
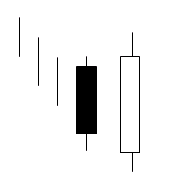
Two of the most compelling candlestick signals are the Bullish Engulfing Pattern and Bearish Engulfing Pattern. They are most effective when founding the oversold area, at the end of a substantial downtrend or the overbought area for the Bearish pattern. The Bullish Engulfing pattern consists of two bodies. The first body is the same color as the current trend, the second is the opposite color. The signal day opens lower than the previous days close, then it trades higher so by the end of the day, it will close above the previous days open. This new white candle now engulfs the previous days candle, known as the DAKI, or the embracing line.

Bullish Engulfing Pattern
Witnessing a white bullish candle, engulfing the previous black candle, stands out like a neon sign after a series of black candles. It becomes very plain to see that a change has occurred in investor sentiment. A couple of simple factors make the Bullish Engulfing pattern more convincing. The bigger the previous days candle being engulfed, the more effective the new trend signal will be. Or the lower the open of the white candle, then coming back up to engulf the previous day, the more powerful the next advance should be.
The formula is relatively simple:
(O1>C1) and (O O1). Defined as the open of yesterday is greater than the close of yesterday. And the open today is less than the close of yesterday, And the close of today is greater than the open of yesterday.
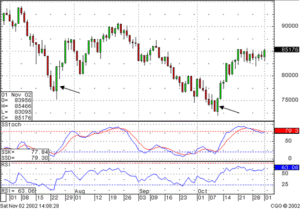
The Bullish Engulfing pattern represents a complete change in investor sentiment. Using this pattern as a buy signal eliminates the need to grab for the fallen knife. When is “low” the right time to buy? The Bullish Engulfing pattern reveals when the buyers have stepped in. Note in the Dow Jones industrial chart that the whole market sentiment reversed at the Bullish Engulfing formations. The signals work equally well when analyzing indexes as they do for individual stocks, commodities, futures or any other trading entity.
Having the knowledge of just eight or nine Candlestick signals, the Bullish and Bearish Engulfing patterns being on that list, produces huge advantages for analyzing the direction of the markets in general. This reinforces the analysis of an individual stock price. Training Video for Engulfing Patterns

Dow Jones Industrials
The Bearish Engulfing pattern is the exact opposite that of the Bullish Engulfing pattern. After an obvious uptrend, the bulls finally gap it open due to their exuberance to get in the position. If stochastics are showing that this is occurring in the overbought area, the candlestick investor becomes very diligent. A gap, however slight, away from the previous days close, should alert the candlestick investor that the trend may be ending. If long, putting a stop one half way down the last bullish candle is usually prudent. If trading comes back through that point and closes below the open of the previous day, a bearish engulfing pattern has formed. Now you can short the stock with confidence. If nothing more than being long, you now know to close the position. Knowing the direction of the market allows the investor to establish positions with more confidence. Knowing that the market indexes have turned positive permits an investor to commit funds to the long side with more aggression than normal. As seen in the above DOW chart, being able to visualize the Bullish Engulfing patterns after extensive downtrend would have allowed an investor to get in and make impressive profits.
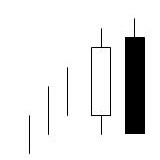
As in the Bullish Engulfing pattern, the Bearish Engulfing pattern is very easy to see. It stands out as a blatant change of direction in the trend. The white bodies in the uptrend now have a large black candle stopping the trend.

Bearish Engulfing Pattern
The black candle acts as an obvious sign against the uptrend. The formula is exactly opposite of the Bullish Engulfing pattern formula. ( C1 >O1) and the(O>C1) and (C>O1), The close of the first day is higher than the open, thus a white candle. The next day has an open than is higher than the previous day’s close and closes lower than he previous days open.
The visual depiction of a Bearish Engulfing pattern creates an ominous darkness at the top of a trend. It does not take learning complicated formulas or analyzing numerous indicators to understand a candlestick signal.

Enron
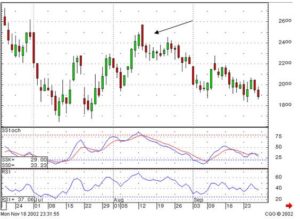
Note how the Bearish engulfing pattern terminates the uptrend in the Enzon Inc. chart.. As the trend persists, buyers finally get so exuberant, they gap the price up. It immediately starts losing ground until it finally closes lower than where it opened the previous day. This clearly illustrates that the sellers have gained strength. That confirmation of selling starts a trend of selling.
The Engulfing patterns are statistically valid for indicating reversals at the tops and the bottoms. As stated early, the signals are highly accurate when a bullish Engulfing pattern is witnessed during oversold conditions. Conversely, the Bearish Engulfing pattern is valid in the overbought area. But both have a recognized indicator at the other end of a trend. A big bullish Engulfing pattern observed at the top of a trend usually represents the last gasp of the trend. The same occurs at the bottom of a trend with the Bearish Engulfing pattern. The last gasp sellers create a bearish engulfing pattern which usually is followed by increased buying. Remembering this fact provides another opportunity to extract profits out of a price trend. When the “hopeful” are buying once more at the top or the “panicked” are selling their last stock position at the bottom, the Candlestick investor is already familiar with what that last bullish or bearish engulfing pattern indicates at the wrong end of a trend. Putting on positions becomes a comfortable endeavor while everybody else is buying or selling the wrong way.
The Candlestick Engulfing patterns have survived centuries of investment skepticism. The Japanese Rice traders become ultra-wealthy utilizing these patterns. This is not rocket science. Rice traders developed high profit trading programs using purely visual recognition of reoccurring high probability formations. This is the most convincing form of statistical analysis. Use it to your advantage.
Stephen W. Bigalow is author of “Profitable Candlestick Trading, Pinpointing Market Opportunities to Maximize Profits” and principal of the www.candlestickforum.com, the leading website on the Internet for providing information and educational material about Japanese Candlestick investing. Over fifteen years of extensive study and utilization of candlestick analysis has produced an array of easy-to-learn educational material about Candlesticks. As one of the leading Candlestick experts in the nation, Mr. Bigalow, through his consulting with major trading firms, has developed multiple successful trading programs for the day-trader to the long-term hold investor.
Speak Your Mind